


Serviços Personalizados
Artigo
 Inglês (pdf)
 Artigo em XML
 Referências do artigo
Indicadores

Links relacionados
-
 Citado por Google
 -
 Similares em Google
Compartilhar

 Permalink
South African Journal of Animal Science
versão On-line ISSN 2221-4062
versão impressa ISSN 0375-1589
S. Afr. j. anim. sci. vol.34 no.2 Pretoria 2004
Genetic parameters for quail body weights using a random regression model
Y. AkbaşI, #; Ç. TakmaI; E. YaylakII
IBiometry and Genetics Unit, Department of Animal Science, Agricultural Faculty of Ege University, Bornova 35100, İzmir-Turkey
IIÖdemiş Vocational Training School, Ege University, Ödemiş, Izmir-Turkey
ABSTRACT
A model including fixed and random linear regressions is described for analyzing body weights at different ages. In this study, (co)variance components, heritabilities for quail weekly weights and genetic correlations among these weights were estimated using a random regression model by DFREML under DXMRR option. Data of 1046 pedigreed quail were used. Individual live weights were obtained weekly from hatching to six weeks of age. Records for the same bird were taken as repeated measurements and single measurement error variance σ2e was assumed to be constant for all ages. Orthogonal polynomial regressions (on the Legendre scale) of sixth order were sufficient to model the additive genetic σ2a phenotypic σ2p and permanent environmental σ2pe (co)variances. Heritability estimates for ages were moderate, ranging from 0.007-0.61 and estimated measurement error variance was 9.60 g2. Correlations were found positive among weights. Genetic correlations were higher than phenotypic and permanent environmental correlations. The correlations between adjacent periods are more closely correlated than between remote periods.
Keywords: Quail, body weight, random regression
Introduction
Genetic evaluation of animals has been based on several traits depending on the species such as milk characteristics, body weight, feed intake and longevity. A trait that changes with age as a trajectory can be represented as a function of time. The trajectories are referred to as 'infinite-dimensional' characters (Kirkpatrick et al., 1994). Because each character takes on a value at each of an infinite number of ages, the value at each age can be considered as a distinct trait.
Animal and plant breeders are concerned with growth trajectories because of the potential to increase the economic value of domesticated species by altering growth patterns through artificial selection (Kirkpatrick et al., 1990).
There are an extensive number of growth models available, such as Brody, von Bertalanffy, Gompertz, Richards and Logistic, describing weight-age relationships for growing animals (Koops, 1986). However, when weight is regressed on time using data across animals, not only would the resulting growth curve be more inaccurate, but also the resulting parameters might be very biased if differences between animals and their environments were not take into account. This problem has generally been dealt with by estimating fixed and random effects independently but not within a linear mixed model framework (Meyer, 2000).
Random regression models are alternative procedures for the analysis of repeated measurements. These models use a fixed regression to describe the average shape of a lactation or growth curve, and a random regression for each animal to account for deviations from the fixed regression. This allows the repeated records collected on an animal to be directly incorporated into genetic evaluations and, since an animal model is fitted, results in the predicted lactation or growth curve being heritable. Random regression models have also been used to describe food intake and weight gain in pigs and growth and mature weight of beef cows (Lewis & Brotherstone, 2002).
Covariance functions are other suitable methodologies to describe genetic and phenotypic variations for infinite-dimensional characters (Meyer, 1998a). Additive genetic covariance function can be approximated using orthogonal functions such as Legendre polynomials (Kirkpatrick et al., 1990) or other defined co-variables as random regressions on time (Olori et al., 1999).
The major motivation for using orthogonal functions to estimate additive genetic covariance function is that the coefficient matrix can be used to analyze the patterns of inheritance. In particular, the coefficient matrix can be used to calculate the eigenfunctions and eigenvalues of the additive genetic covariance function (Kirkpatrick et al., 1990) which is useful to describe the patterns of variation (Kirkpatrick et al., 1994).
Using classical analysis, regression coefficients are generally treated as fixed to account for overall trends or trends within some fixed classes. However random regression coefficients can be fitted for each individual to allow for individual variation in the shape of the trajectory (Meyer, 1998b). Therefore, random regression models describe the genetic deviations from the fixed regressions, which allow each animal to have a different shape of growth curve on a genetic level.
The objectives of this study were to estimate coefficients of the covariance function and (co)variance components and heritabilities for weights taken each week and genetic correlations among these weights by random regression model.
Materials and Methods
A total of 1046 pedigreed half-sib and full-sib progeny from the random mating of 42 sires and 140 dams was used. One dam was placed into each cage and four dams were used for each sire. For more detailed information about material and other management systems applied, see Akbaş & Yaylak (2000). Individual live weights were obtained weekly from hatching to 6 weeks of age using a digital scale capable of discriminating 0.1 g increments.
Variance components for weights were estimated by average information and derivative-free REML algorithms using a random regression animal model with the DXMRR option of the DFREML package (Meyer, 1997). Goodness of fit of the different orders of models was tested by chi-square (χ2) test (Kirkpatrick et al., 1990).
Single measurement error variance was assumed to be constant for all ages. The following animal model was used:

yij : Body weight of ith quail at week j
F: Fixed effects
aij: Random additive genetic effect
rij: Random permanent environmental effect
eij: Random measurement error
The random regression model form of equation (1) can be rewritten as:
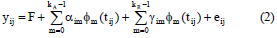
F: represents the fixed effects of sex (assumed to be similar for all ages) and age (modelled with polynomial fixed regressions of the same order as the random regression)
ajm: mth additive genetic random regression coefficients for animal i
yjm: mth permanent environmental random regression coefficients for animal i
kA: Order of fit for additive genetic random regression coefficients
kR: Order of fit for permanent environmental random regression coefficients
tij: jth age for animal i
Φm (tij) : mth Legendre polynomial evaluated for tii
eii : Measurement error
The covariance between first and second records of individual i can be written as:

Cov(yi1 yi2) :Covariance between body weights at ages t1 and t2
Cov(αim, αil ) :Covariance between mth and lth additive genetic random regression coefficients for animal i
Cov(yim, γα ) :Covariance between mth and lth permanent environmental random regression coefficients for animal i
Measurement errors are assumed to be i.i.d. with variance  and 0 otherwise. The three eigenvalues of the estimated additive genetic and permanent environmental covariance function were derived and the three eigenfunctions of these covariance functions were plotted.
Results and Discussion
Log likelihood values and changes in Log likelihoods with constant mean square error are given in Table 1. Log likelihood values and changes were increased with increasing order of model. The changes in log likelihood from the linear to the quintic model have been found to be significant.
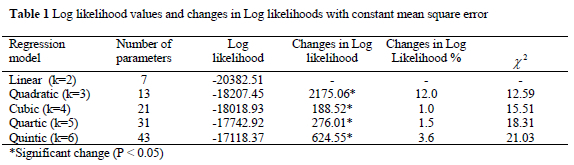
Since changes in likelihood value among models from simple linear to quintic model were significant (Table 1), orthogonal polynomial regression of order 6 has been chosen as sufficient model to fit additive genetic and permanent environmental (co)variances with the fixed regression in this study. The major change in likelihood (%12) was obtained in quadratic fit after simple linear model. The changes in likelihood from quadratic to quintic models were only % 1 - 4 but the changes were significant between models. It is also known that parameters can be estimated more accurately with full fit of parameters.
In this study measurement error variance was assumed constant through growth trajectory and found 9.60 g2 for 6 order of fit. Alternatively, measurement error variance can be assumed to be different in every week of growth period. The log likelihood increases with different orders of fit and assumptions about the measurement error variance structure. Assuming a constant measurement error structure, however, reduces computational requirements and convergence problems due to the large number of parameters to be estimated in individual analyses. Also it leads to making model comparisons easier (Meyer, 2000).
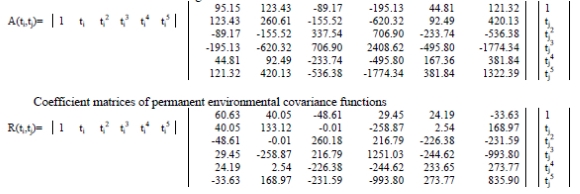
Estimates of coefficient matrices for additive genetic (A) and permanent environmental (R) covariance functions were as follows:
Coefficient matrices of additive genetic covariance functions
Six eigenvalues of the estimated additive genetic covariance function for sixth order of polynomial fit are given in Table 2. In this table, proportion of each eigenvalue of the total eigenvalues was calculated for determining their importance.
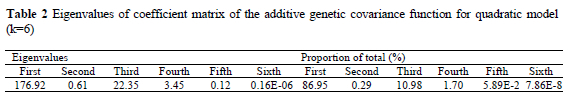
The first, second, third, fourth, fifth and sixth eigenvalues of the coefficient matrix of the additive genetic covariance function were 176.92, 0.61, 22.35, 3.45, 0.12 and 0.16E-06, respectively. The eigenvalue is proportional to the amount of genetic variation in the population corresponding to that eigenfunction. The first eigenvalue of the coefficient matrix of the additive genetic covariance function accounted for about 87% of the sum of all eigenvalues for quintic model. From the large size of the first eigenvalue it can be concluded that selection will produce rapid changes if this kind of alteration in the mean growth trajectory is favoured. However this is not the case for second and the third eigenvalues since the second and third eigenvalues accounted for about 0.3% and 11% of the sum of all eigenvalues, respectively. In contrast to the first eigenvalues, therefore, they represent a negligible proportion of the variation in additive genetic variance.
Eigenfunctions of additive genetic coefficient matrix of covariance function for the quintic model are plotted in Figure 1. The first eigenfunction was positive and not changing very much with increasing age while the second and third ones show some fluctuations.
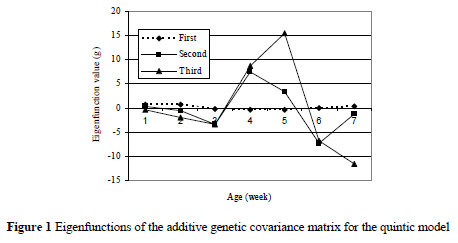
In this study, the first eigenfunction was positive and constant for all ages. However, opposite directional change were obtained in second and third eigenfunctions. These opposite directional changes are due to factors having contrasting effects on body weights at different ages. The eigenfunctions and eigenvalues contain information about understanding the potential of genetic improvement of growth trajectories. The eigenfunctions corresponding to genetic change show an increase or decrease in body weights at all ages. The first eigenfunction with large eigenvalue in this study describes that the populations have substantial genetic variation. Selection on first eigenfunction will increase body weights for all ages. This implies that selection for weight at any age will improve weights at all ages. Eigenfunctions with very small (or zero) eigenvalues, on the other hand, represent deformations for which there is little (or no) additive genetic variation (Kirkpatrick et al., 1990) as happened in the 4th and later eigenfunctions. Selection for second and third eigenfunctions, on the other hand, may be limited because of small eigenvalues relative to the first eigenvalue.
The heritability estimates for body weights at different ages are derived plotted in Figure 2. Heritability estimates were 0.007, 0.39, 0.45, 0.58, 0.61, 0.55 and 0.44 for weekly weights from hatching to 6 week of age. The highest h2 (0.61) was obtained at 5 weeks of age.
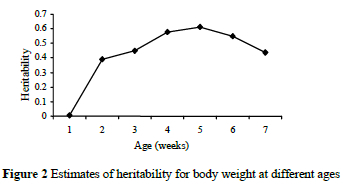
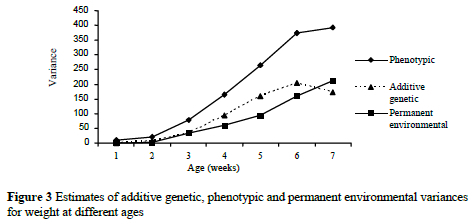
The heritability estimates yielded lower h2 at early ages and decreased slightly at later ages. This result may explain the changes of genetic variances for weights over ages. The changes of phenotypic and permanent environmental variances for weights over ages were increased by the increment of age. Phenotypic variance was increased more rapidly than genetic and permanent environmental variances. Permanent environmental variances increased considerably less over time than the genetic counterparts. The changes in genetic, phenotypic and permanent environmental variances for weights over ages are shown in Figure 3.
The additive genetic and phenotypic correlations among weights are given in Tables 3.
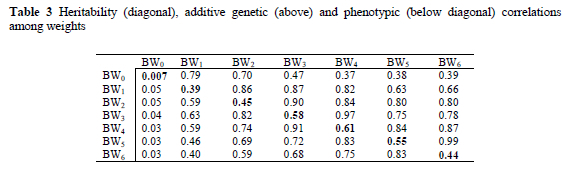
In this study, all correlations among weights were found positive. The correlations between adjacent periods are more closely correlated than between remote periods. Moreover, genetic correlations were higher than phenotypic correlations. Within the same interval, genetic correlations slightly decreased with time. The genetic correlations obtained, were all positive and suggested that selection for weight at an early age will have a positive effect on weight at a later age.
Acknowledgements
The authors are grateful to Karin Meyer for comments and helps in using the software.
References
Akbaş, Y. & Yaylak, E., 2000. Heritability estimates of growth curve parameters, phenotypic and genetic correlations among growth curve parameters, and the correlation of the parameters with weights at different age of Japanese quail. Arch. Geflügelk. 64, 141-146. [ Links ]
Kirkpatrick, M., Lofsvold, D. & Bulmer, M., 1990. Analysis of the inheritance, selection and evolution of growth trajectories. Genetics 124, 979-993. [ Links ]
Kirkpatrick, M., Hill, W.G. & Thompson, R., 1994. Estimating the covariance structure of traits during growth and ageing, illustrated with lactation in dairy cattle. Genet. Res., Camb. 64, 57-69. [ Links ]
Koops, W.J., 1986. Multiphasic growth curve analysis. Growth 50, 169-177. [ Links ]
Lewis, R.M. & Brotherstone, S., 2002. A genetic evaluation of growth in sheep using random regression techniques. Anim. Sci. 74, 63-70. [ Links ]
Meyer, K., 1997. DFREML 3.0α program package and user notes. Animal Genetics and Breeding Unit, Univ. New England, Armidale, New South Wales, Australia. 27 pp. [ Links ]
Meyer, K., 1998a. Estimating covariance functions for longitudinal data using a random regression model. Genet. Sel. Evol. 30, 221-240. [ Links ]
Meyer, K., 1998b. Modelling repeated records:covariance functions and random regression models to analyse animal breeding data. 6th World Congress on Genetics Applied to Livestock Production, Jan.11-16. University of New England, Armidale, NSW, Australia. [ Links ]
Meyer, K., 2000. Random regressions to model phenotypic variation in monthly weights of Australian beef cows. Livest. Prod. Sci. 65, 19-38. [ Links ]
Olori, V.E., Hill, W.G., McGuirk, B.J. & Brotherstone, S., 1999. Estimating variance components for test day milk records by restricted maximum likelihood with a random regression animal model. Livest. Prod. Sci. 61, 53-63. [ Links ]
# Corresponding author. E-Mail: yavuz@ziraat.ege.edu.tr

