


Services on Demand
Article
 English (pdf)
 Article in xml format
 Article references
Indicators

Related links
-
 Cited by Google
 -
 Similars in Google
Share

 Permalink
South African Journal of Animal Science
On-line version ISSN 2221-4062
Print version ISSN 0375-1589
S. Afr. j. anim. sci. vol.33 n.3 Pretoria 2003
Correlated responses in tissue weights measured in vivo by computer tomography in Dorset Down sheep selected for lean tissue growth
S.J. Nsoso ; M.J. Young; P.R. Beatson
Animal and Veterinary Sciences Group, Lincoln University, New Zealand
ABSTRACT
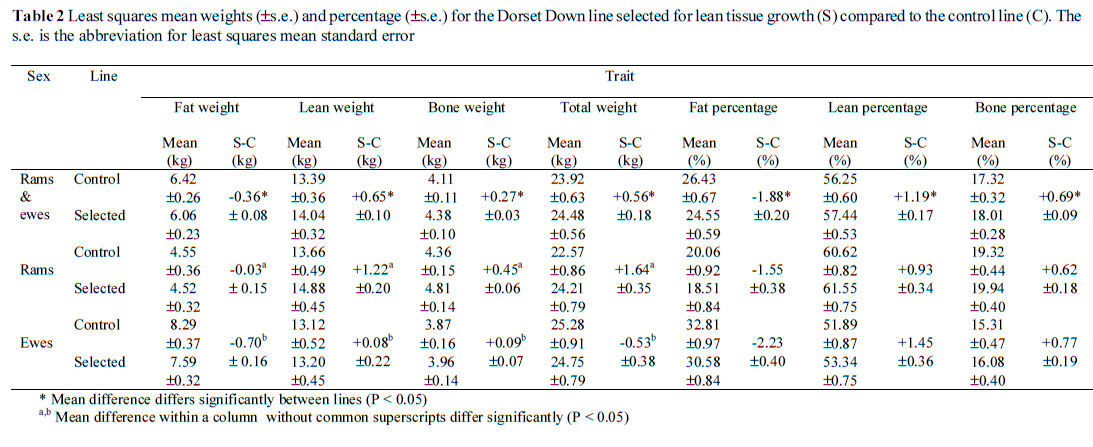
The aim of this study was to estimate correlated responses in lean, fat and bone weights in vivo in Dorset Down sheep selected for lean tissue growth. Over the period 1986-1992 inclusive, the lean tissue growth line had been selected using two economic indices for an increased aggregate breeding value incorporating predicted lean and fat weights with positive and negative economic weightings, respectively. The control line was selected for no change in lean tissue growth each year. Animals were born and run on pasture all year round. X-ray computer tomography was used to estimate the weights of lean, fat and bone in vivo in the 1994-born sheep, aged 265-274 days and selected randomly into 12 rams and 12 ewes from the selected line and 10 rams and 9 ewes from the control line. The lean tissue growth line had significantly greater responses in lean weight (+0.65 ± 0.10 kg) and lean percentage (+1.19 ± 0.17%) and significantly lesser fat weight (-0.36 ± 0.08 kg) and fat percentage (-1.88 ± 0.20%) compared to the control line. There was a significant increase in bone weight (+0.27 ± 0.03 kg) and bone percentage (+0.69 ± 0.09%) in the lean tissue growth line compared to the control line. Responses differed significantly between sexes of the lean tissue growth line, rams having a greater response in weight of lean (+1.22 ± 0.20 vs. +0.08 ± 0.22 kg) and bone (+0.45 ± 0.06 vs. +0.09 ± 0.07 kg), and a lesser response in weight of fat (0.03 ± 0.15 vs. -0.70 ± 0.16 kg) than the ewes. Selection led to significant changes in lean (increase) and fat weights (decrease), and bone weight increased. Although responses in the lean tissue growth line differed significantly between sexes, there were confounding factors due to differences in management and lack of comparison at equal stage of development. Therefore, to assess real genetic differences further studies should be conducted taking these factors into consideration.
Keywords: Lean tissue growth, computer tomography, selection index, responses, sheep
Introduction
Circumstantial evidence from surveys has accumulated that consumers in developed countries prefer to purchase and consume meat such as mutton and lamb with lower levels of fat than previously. This is mainly because of the possible association between high levels of dietary saturated animal fats and cardiovascular disease (Kempster et al., 1986; Simm, 1987). The decline in consumption of meat has been the major impetus leading to selection for changed body composition of farm animals such as sheep (Simm, 1986; Glimp & Snowder, 1989) to produce an ideal meat animal. An ideal meat animal is one which has a high ratio of muscle to bone and a high proportion of the most valuable joints, while possessing the ability to be within acceptable limits of fatness (Berg & Walters, 1983; Berg & Butterfield, 1985; Thorgeirsson & Thorsteinsson, 1989) at the most economical time of slaughter (Thorgeirsson & Thorsteinsson, 1989). Other reasons for producing lean carcasses as opposed to those with excess fat are that in biological and economic terms lean carcasses are more efficient to produce (Glimp & Snowder, 1989; Cameron & Bracken, 1992) due to fat being a more energy concentrated tissue.
In the short term farmers could respond to increases in financial incentives for lean meat or penalties for fat by slaughtering animals at lighter weights, ceasing castration of males and/or manipulating the quality or/and quantity of the diet (Simm & Dingwall, 1989; Simm, 1992). However, several of these short-term, non-genetic measures have disadvantages, e.g. the reducing of the slaughter weight of animals might lead to lower output per unit of land or capital, and the altering of feed quality and quantity may be impractical under extensive production systems (Simm, 1992). Furthermore, the time when the diet is manipulated, is critical since intermuscular fat, the fat depot which affects carcass value the most, is reaching maturity at an early stage in the growth curve (Wood et al., 1980; Berg & Walters, 1983; Kadim et al., 1988; Harrington & Kempster, 1989). Comparatively, genetic improvement is relatively slow, but provides a permanent and cost-effective improvement in carcass composition (Simm & Dingwall, 1989). Thus, genetic improvement, either alone or in combination with some of the measures outlined above, is an attractive option for affecting long-term, permanent improvement in carcass composition (Simm et al., 1987; Simm & Dingwall, 1989; Simm, 1992). The quickest route to genetic improvement can be through breed substitution where better genotypes are available.
Comparisons of most modern breeds at a given age or weight have shown that there exist differences in fat weight between breeds, but not lean weight. However, differences in fat weight disappeared when comparisons were made at a common degree of maturity (McClelland et al., 1976). Comparisons made at a constant estimated carcass subcutaneous fat proportion also showed that there was no variation in lean proportion within most traditional breeds (Kempster et al., 1987). Breed variants that do exist in all these comparisons are either of no economic importance at present (Young, 1989), e.g. the exceptionally lean Soay is very small (McClelland et al., 1976) or their benefits may be offset by disadvantages, e.g. the lean Texel has a slow growth rate, hence takes longer to reach acceptable slaughter fat levels (Kempster et al., 1987; Glimp & Snowder, 1989). Therefore, selection between breeds probably offers very little scope to improve lean tissue growth rate under the present farming systems. However, within breed, genetic variation exists, and selection within breed offers opportunities to increase lean tissue growth (Butterfield et al., 1983). The aim of this experiment was to estimate correlated responses in fat, lean and bone weights assessed in vivo using x-ray computer tomography (CT) in 1994-born ewes and rams of the Dorset Down flock selected for lean tissue growth.
Materials and Methods
Between 1986 and 1992 a closed Dorset Down flock at Lincoln University, New Zealand, was selected for lean tissue growth, with replacements being chosen on the basis of selection indices devised by Simm et al. (1987), namely:
I1 = 0.44LW - 0.58FD 1986-1988
I2 = 0.25LW - 0.58FD + 0.48MD 1989-1992
where LW is live weight, FD is ultrasound fat depth and MD is ultrasound muscle depth, all measured at eight and 11 months of age for ewes and rams respectively. The aggregate breeding value was lean and fat weights with positive and negative economic weightings respectively (Simm et al., 1987). Index 1 was used initially because muscle depth could not be measured accurately with the AIDD model 3 ultrasound machine (developed by the Auckland Industrial Development Division of DSIR) in use at the time. Inclusion of MD became possible with procurement of a real time B-mode ultrasound scanner fitted with a UST-58101-5 probe operating at 5-MHz (Aloka SSD-210 DXII, Aloka Co. Ltd., Japan).
Selection for lean tissue growth began in 1986 on animals born in 1984 and was repeated annually until 1992. Rams were used for breeding once, at two years of age. Ewes first lambed at two years of age. The total combined number of sires used, was 98, i.e. 39 and 59 from for the lean tissue growth and control lines respectively. On average five sires were used in each line each year. The lines were divided into sire families to reduce inbreeding, with the minimum number of ewes being 20 per family. In the lean tissue growth line the ram with the best index was selected from each family and allocated to the next family for breeding purposes. Ewes were retained in the sire family in which they were born. Ewes with superior indices were retained as replacements of older ewes culled for old age or poor reproductive performance. In the control line both rams and ewes were chosen, using the same indices as for the lean tissue growth line, but with the aim of obtaining no change in quantity of lean tissue growth.
The animals were born outdoors in September/October and weaned in November/December. They were kept on pasture all year round. Lean and fat weights could not be measured before 1994 because traditional carcass evaluation techniques for measuring these entities involved slaughter. However, potential breeding animals could not be slaughtered and slaughtering and dissecting of their relatives was not economically feasible. In1994 an X-ray CT scanner became available to assess lean and fat weights in vivo. Success in the application of CT to measure in vivo body composition of farm animals is evident in the literature, e.g. a number of studies have assessed body composition in vivo for different farm animal species, including sheep (Sehested, 1986; Young et al., 1996, 1998) and goats (Sorensen, 1992).
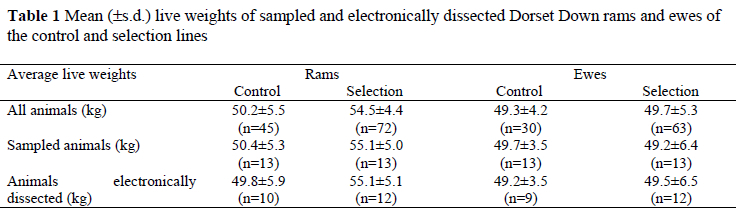
Fifty-two 1994-born Dorset Down rams and ewes aged 265-274 days, being nearly third generation of selection, were randomly selected using stratified sampling of three weight groups (low, medium and high) within sex, within line. This was achieved by randomly choosing four animals from the low and high weight groups, and five animals from the medium weight group within sex, within line to account for some of the known variation caused by live weight (Table 1).
A Technicare 2020 CT scanner was used to scan the sheep. All sheep were scanned with a scan circle diameter of 40 cm. Other scanner settings were 120 Kv, 100 mA, 5 mm slice thickness, 4 second scan time, 512 x 512 image matrix resolution and a "sharp" convolver filter for image reconstruction. Scanning of each sex (n=26) occurred over five days. Generally, a similar number of animals was scanned each day. Scanning was performed after withholding food for 12 hours. Half an hour prior to scanning each animal was given 1.0 mL (per 50 kg live weight) of10 mg/mL acepromazine ('ACEPRIL 10', Troy Laboratories, Pty, Ltd.) intramuscularly to relax the animal and decrease movement during scanning. Animals were also restrained in a cradle, lying on their backs with forelegs firmly strapped close to the chest and hind legs held in clamps. The Cavaleri principle (Gundersen et al., 1988) was employed to measure contents of muscle, fat and bone. This requires 10 to 15 slices or sections to be made at equal spaces through an object to provide an unbiased estimate of the volume of a 3-dimensional irregularly shaped object with an error (coefficient of variation) of less than 5%. The only requirement that had to be fulfilled, was that the first slice be chosen at random. Shape and orientation of the object are not important. Animals were scanned at 18-20 equally-spaced sites along their long axis. The first slice was chosen at random in the neck region close to the head, and subsequent slices were scanned at 55 mm intervals, with the last slice being after the knee joint. From these, slices were selected for analyses: the first slice chosen for analysis was in the neck region prior to the slice in which shoulders were apparent. The last slice for analysis was in the upper leg, after the last slice in which the thighs were apparent. These criteria resulted in a total of15-18 slices per sheep being chosen. Only 43 complete images of animals were recovered from the tapes. The nine lost animals were, one each from the lean tissue growth rams and ewes, and three and four animals from the control rams and ewes, respectively.
Image manipulation and analysis were performed, using a suite of software written by Jopson (1995, Agresearch, Invermay, New Zealand) and Photomagic (Microgfax, 1992), a bitman editing program. Images were prepared for analysis by removing non-animal material (e.g. straps, table) and internal organs. The resultant images comprised carcass plus skin. These images were analysed to determine the areas of bone, fat and lean in each slice, as described by Nsoso (1995). For a given tissue, areas were totalled across all slices within an animal and multiplied by the interslice distance to yield a volume. These volumes were converted to weight by multiplying by standard density values for carcass fat, muscle and bone of 0.925, 1.031 and 1.549 kg/dm3, respectively (N.P. Jopson, 1995, Pers. Comm., Agresearch, Invermay, New Zealand). Tissue percentages were derived for each animal by dividing individual tissue weight by total weight (sum of fat, lean and bone weights). These were derived to remove the effect of size, which is known to influence comparison between traits (Smith, 1984).
Six animals (three ewes and three rams) were chosen at random to estimate the effect of operator error in processing images. Repeatability of analysing the same image twice was never less than 99.9% for tissue-weight traits. Data were analysed using a GLM procedure (SAS, 1991). All fixed effects (birth rank, rearing rank, age of dam, sex, line and sex-line interaction) and a covariable (age at scanning) were fitted. Subsequently, all effects not significant at 5% were dropped from the model, leaving only line and sex-line interaction (Model 1). To adjust for differences in live weight between lines within sex (Table 1), latest live weights were nested within sex and fitted as a covariable (Model 2). In both models the sex-line interaction was fitted to allow estimation of least squares means that were used to estimate responses to selection between the line selected for lean tissue growth and the control line.
Yikj = μ + sexi + linej + (sex*line)ij + eijk Model 1
Yikj = μ + sexi + linej + (sex*line)ij + β i(LWijk - LWi) + eijk Model 2
Where:
Yikj = observation of individual
μ = population mean
sexi = sex (i=1,2)
linej = line (j=1,2)
βi = linear regression coefficient for LWijk deviation within sex
LWi = mean live weight within sex
LWijk = live weight of individual
εijk = random error
Significance (P < 0.05) of differences in responses was assessed by the Student's t- test (Little & Hills, 1978).
Results and Discussion
Selection led to significant increases in lean (weight and percentage) and significant decreases in fat (weight and percentage) in the lean tissue line compared to the control line (Table 2). This was consistent with the theoretical predictions of Simm et al. (1987) and the results of Simm et al. (1990) and Cameron (1992), using carcass dissection of crossbred progeny. With the exception of the study of Young et al. (1998), which is a component of the present study, there are no reports considering responses estimated from in vivo CT measurements to selection for lean tissue growth.
Responses in lean weight (+65 g per year) and fat weight (-36 g per year) (Table 2) were higher than those predicted from the index of Simm et al. (1987), namely +59 and -18 g per year for lean and fat, respectively. Greater responses observed than predicted could be the result of four effects, namely sampling errors (due to sample size and sampling approach), a founder effect, relative maturity and/or differences in management. It is unlikely that the scanning approach and image analyses influenced the realised responses found in the present study. Fifty-two animals were sampled from a total population of 210 animals. Live weights of the samples were similar to those of the sub-populations from which they were sampled. Fortunately the nine animals lost (leaving only 43 to be analysed) had little effect on these means (Table 1). This suggests that sampling did not bias results. Assumptions of the Caveleri principles (Gundersen et al., 1988) were fulfilled. More than 15 slices per sheep were used to estimate volume (16.4-16.8 slices per sheep) and the first slice was chosen at random and slices were equally spaced. Therefore, anatomical positioning effects are not likely to have influenced the results. Operator error should not have biased the results since the repeatability for total fat, lean and bone measurements were never less than 99.9%.
Two separate ram populations founded the lean tissue growth line of the present study, namely 1984-born animals used in 1986, and 1985-born rams used in 1987. Results from the present study are for progeny of rams descending from the 1986 founding population, which, relative to the 1987 ram-founding population, has selection differentials that were consistently greater for live weight and less for ultrasonic fat depth. This led to responses being greater in live weight and muscle depth and less for fat depth in the former descendants than the latter throughout the study period (Nsoso, 1995). Proof of founder effect influencing results requires assessment of the progeny in the year following that of this study (1995) to see if results follow the patterns shown by the 1994 group.
Differences between predicted and observed responses could reflect differences in degree of mature development. Simm et al. (1987) predicted responses for a 13.64 kg cold carcass, but mean carcass weight for the present study was estimated to be 10.56 kg heavier. In crossbred animals Simm et al. (1990) reported responses of+2.2 g/kg for lean and -1.1 g/kg for fat weight as carcass weight increases from 16.7 to 22.3 kg. However, the nature of the comparison reported by Simm et al. (1990) does not allow quantitative adjustment of responses as observed in the present study. They compared crossbred progeny of high and low index rams. The heritabilities of component traits in the sire sub-populations may be different and the degree of heterosis involved, was not reported. However, their work clearly showed that the magnitude of responses will increase with degree of maturity.
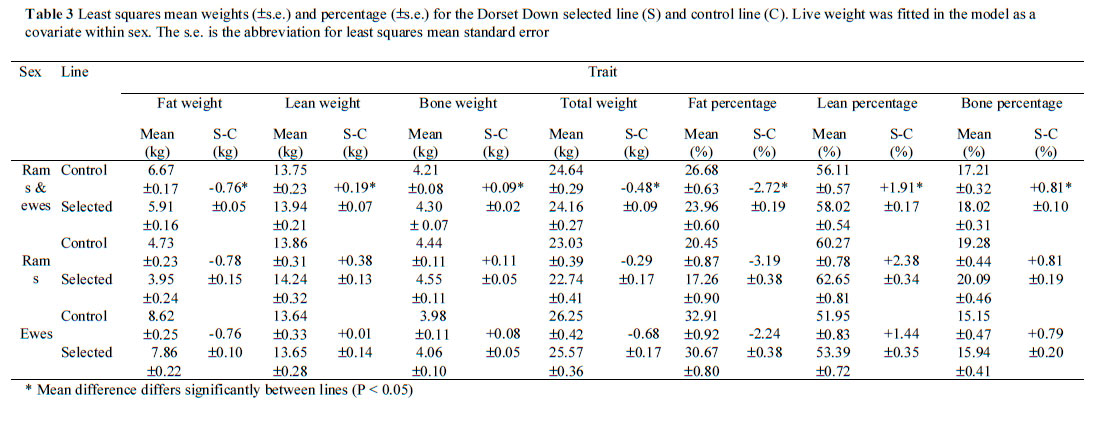
Results of the present experiment indicate an increase in carcass weight (+56 g/year), which meets the experimental aim to increase lean weight in order to increase carcass weight. In the present study bone weight increased (+27 g/year), as predicted by Simm et al. (1987). An increase in bone weight is inevitable since bone and muscle weight are functionally related and positively correlated genetically (Wolf et al., 1981). Accounting for differences in size by considering tissue proportions and by adjusting to a common live weight within sex, generally did not alter the interpretation of responses between the lines (Tables 2 and 3). The lean tissue line had lower (P < 0.05) fat (weight and percentage) and greater (P < 0.05) lean and bone (weights and percentages) than the control line. Comparing responses in traits independent of size is valid since this accounts for units and means of traits differing (Smith, 1984).
Lower responses in lean adjusted for size than for fat are because of the part-whole relationship between lean and size (Simm et al., 1987). Lean forms a greater proportion of the whole carcass than fat and bone. Adjusting for size removes much of the difference in lean weight. The CT responses parallel those seen in live weight (+489 and +290 g/year for rams and ewes, respectively) and ultrasound fat depth (+0.01 and -0.001 mm/year for rams and ewes, respectively) in that rams showed greater (P < 0.05) response in lean (+122 vs. +8 g/year) and significantly less response in fat (-3 vs. -70 g/year) than ewes. Bone weight was also higher (P < 0.05) in rams than ewes of the lean tissue growth line (Table 2). Such differences between the sexes could be due to genetic differences, differences in developmental stage and nutritional management.
Genetic size scaling theory is general and applies at the species level but its applicability between sexes is not known (Taylor, 1985). A sex difference occurred whereby at the same muscle:bone ratio, ewes were fatter (P < 0.05) (7.77 ± 0.29 vs. 4.68 ± 0.27 kg) than rams. Differences between the sexes could be a function of maturity (Taylor, 1985) or sexual maturity and timing of the breeding season. Adjusting for differences in size by expressing responses as percentages of the total carcass weight still led to ewes being significantly fatter (31.26 ± 0.84 vs. 19.19 ± 0.79%) than rams at equal muscle:bone ratios. Genetic size scaling theory is useful in highlighting differences between sexes. In order to assess sex-specific effects, comparisons need to be made of the two sexes under the same nutritional conditions and at equal maturity. Equal maturity could be defined as at a standardised growth stage, e.g. at equal subcutaneous fat proportion (Kempster et al., 1987), to avoid the problem caused by lack of a common measure of mature size of farm animals, as described by McClelland et al. (1976).
Management differences between rams and ewes did occur. Rams and ewes were run separately from weaning onwards (November/December). The ewes were on crop residues for eight weeks prior to scanning while rams grazed pasture. Adjusting for sex effects removes this management influence, which would produce responses less biased by management. However, if there is a genotype-environmental interaction, then such simple adjustments would not be appropriate. Ideally, animals should be kept under the same management conditions to allow for valid comparisons of responses.
Accounting for differences in size by considering tissue proportions (Table 2) and by adjusting to a common live weight within sex (Table 3) led to both sexes having tissue weights and relative size traits that did not differ significantly. This is consistent with the findings of Smith (1984) who reported that such adjustments for size provide valid comparisons, which are not complicated by means differing.
Conclusions
Results from the present study clearly demonstrate that significant desirable responses occurred in aggregate breeding value traits. Lean and fat weights and percentages increased and decreased respectively, to selection on economic indices for lean tissue growth in the lean tissue line compared to the control line. Bone weight and percentage also increased significantly in the lean tissue line compared to the control line. Although responses differed significantly between sexes of the lean tissue line, these could have been due to differences in management or in relative maturity of the sexes. Therefore, further studies based on larger samples for both sexes should be conducted independent of these confounding factors to assess the existence of real genetic differences.
Acknowledgements
The authors thank Chris Logan, Nigel Jay and Dennis Herrick for their assistance with CT scanning, Ross Wilson, manager of Lincoln University Sheep Breeding Unit for managing the sheep used in this study, G. Simm for comments made on earlier drafts. N.P Jobson provided assistance in the use of Bitman, Photomagic and Autocat to analyse images. S.J. Nsoso was the recipient of a Commonwealth Postgraduate Scholarship during the time of this study.
References
Berg, R.T. & Butterfield, R.M., 1985. New and inproved types of meat animals. In: Development in Meat Science. Ed. Lawrie, R., Elsevier Applied Science Publ., London. pp. 1-23. [ Links ]
Berg, R.T & Walters, L.E., 1983. The meat animal: changes and challenges. J. Anim. Sci. 57 (Suppl. 2), 133146. [ Links ]
Butterfield, R.M., Griffiths, D.A., Thompson, J.M., Zamora, J. & James, A.M., 1983. Changes in body composition relative to weight and maturity in large and small strains of Australian Merino rams. 1. Muscle, bone and fat. Anim. Prod. 36, 29-37. [ Links ]
Cameron, N.D., 1992. Correlated responses in slaughter and carcass traits of crossbred progeny to selection for carcass lean content in sheep. Anim. Prod. 54, 379-388. [ Links ]
Cameron, N.D. & Bracken, J., 1992. Selection for carcass lean content in terminal sire breeds of sheep. Anim. Prod. 54, 367-377. [ Links ]
Glimp, H.A. & Snowder, D.G., 1989. Production methods to increase lean and reduce fat in lamb: A review. SID Res. J. 5(3), 18-27. [ Links ]
Gundersen, H.G.J., Bendsten, T.F., Korbo, L., Marcussen, N., Moller, A., Nielsen, K., Nyengaard, J.R., Pakkenberg, B., Sorensen, F.B., Vesterby, A. & West, M.J., 1988. Some new, simple and efficient sterological methods and their use in pathological research and diagnosis. APMIS 96, 379-394. [ Links ]
Harrington, G. & Kempster, A.J., 1989. Improving lamb carcass composition to meet modern consumer demand. In: Reproduction, Growth and Nutrition in Sheep. Eds. Dyrmundsson, O.R. & S. Thorgeirsson, S., Dr. Halldor Palsson Memorial Publication. Agricultural Research Institute and Agricultural Society, Reykjavik, Iceland. pp. 79-90. [ Links ]
Kadim, I.T., Purchas, R.W., Rae, A.L. & Barton, R.A., 1988. The distribution and partitioning of fat in Southdown sheep selected for high and low fat depths in backfat. Proc. 34th Int. Congr. Meat Sci. Technol. (Part A). pp. 65-67. [ Links ]
Kempster, A.J., Cook, G.L. & Grantley-Smith, M., 1986. National estimates ofthe body composition of British cattle, sheep and pigs with special reference to trends in fatness. A review. Meat Sci. 17, 107-138. [ Links ]
Kempster, A.J., Croston, D., Guy, D.R. & Jones, D.W., 1987. Growth and carcass characteristics of crossbred lambs by ten sire breeds, compared at the same estimated carcass subcutaneous fat proportion. Anim. Prod. 44, 83 98. [ Links ]
Little, T.M. & Hills, F.J., 1978. Agriculture Experimentation: Design and Analysis. John Wiley and Sons, Inc. New York, USA. pp. 267-282. [ Links ]
McClelland, T.H., Bonaiti, B. & Taylor, St. C.S., 1976. Breed differences in body composition of equally mature sheep. Anim. Prod. 23, 281-293. Micrografx, 1992. Photomagic user's guide. Micrografx Inc. [ Links ]
Nsoso, S.J. 1995. Genetic control of lean tissue growth in sheep: genetic parameters and responses to selection. PhD thesis, Lincoln University, New Zealand. 213 pp. [ Links ]
SAS, 1991. Statistical Analysis Systems user's guide (6.08th ed.). SAS Institute Inc., Cary, North Carolina, USA. [ Links ]
Sehested, E., 1986. In Vivo prediction of lamb carcass composition by Computerised Tomography. PhD thesis, Agricultural University of Norway. 81 pp. [ Links ]
Simm, G., 1986. Economic selection indices for lean meat production in sheep. Proc. 3rd Wld Congr. Genetics Applied to Livestock Production. Volume IX: pp. 541-546. [ Links ]
Simm, G., 1987. Carcass evaluation in sheep breeding programmes. In: New Techniques in Sheep Production. Eds. Marai, I.F.M. & Owen, J.B., Butterworths, London. pp. 125-144. [ Links ]
Simm, G., 1992. Selection for lean meat production in sheep. In: Progress in Sheep and Goat Research. Ed. Speedy, A.W., CAB International. pp. 193-215. [ Links ]
Simm, G. & Dingwall, W.S., 1989. Selection indices for lean meat production in sheep. Livest. Prod. Sci. 21, 223-233. [ Links ]
Simm, G., Young, M.J. & Beatson, P.R., 1987. An economic selection index for lean meat production in New Zealand sheep. Anim. Prod .45, 465-475. [ Links ]
Simm, G., Dingwall, W.S., Murphy, S.V. & FitzSimons, J., 1990. Selection for improved carcass composition in Suffolk sheep. Proc. 4th Wld Cong. Genetics Applied to Livestock Production. Volume XV. pp. 100103. [ Links ]
Smith, C., 1984. Rates of genetic change in farm livestock. Res. Develop. Agric. 1, 79-85. [ Links ]
Sorensen, M.T., 1992. In vivo prediction of goat body composition by computer tomography. Anim. Prod. 54, 67-73. [ Links ]
Taylor, St. C.S., 1985. Use of genetic size-scaling in evaluation of animal growth. J. Anim. Sci. 61 (Suppl. 2), 118- 143. [ Links ]
Thorgeirsson, S. & Thorsteinsson, S.S., 1989. Growth, development and carcass characteristics. In: Reproduction, Growth and Nutrition in Sheep. Eds. Dyrmundsson, O.R. & Thorgeirsson, S., Dr. Halldor Palsson Memorial Publication. Agricultural Research Institute and Agricultural Society, Reykjavik, Iceland. pp.169-204. [ Links ]
Wood, J.D., MacFie, H.J.M., Pomeroy, R.W. & Twinn, D.J., 1980. Carcass composition in four sheep breeds: The importance of type of breeds and stage of maturity. Anim. Prod. 30, 135-152. [ Links ]
Wolf, B.T., Smith, C., King, J.W.B. & Nicholson, D., 1981. Genetic parameters of growth and carcass composition in the crossbred progeny of six terminal sire breeds of sheep. Anim. Prod. 32, 1-7. [ Links ]
Young, M.J., 1989. Responses to selection for leanness in Suffolk. MSc thesis, University of Edinburgh, Scotland. 60 pp. [ Links ]
Young, M.J., Nsoso, S.J. & Beatson, P.R., 1998. Response to selection for lean tissue growth in sheep as assessed by x-ray computer tomography. Proc. 6th Wld Congr. Genetics Applied to Livestock Improvement. 24, 153-156. [ Links ]
Young, M.J., Nsoso, S.J., Logan, C.M. & Beatson, P.R., 1996. Prediction of carcass tissue weight in vivo using live weight, ultrasound or X-ray computer tomography measurements. Proc. N. Z. Soc. Anim. Prod. 56, 205-211. [ Links ]
# Corresponding author. E-mail: snsoso@temo.bca.bw
1 Present address: Botswana College of Agriculture, Private Bag 0027, Gaborone, Botswana

