


Services on Demand
Article
 English (pdf)
 Article in xml format
 Article references
Indicators

Related links
-
 Cited by Google
 -
 Similars in Google
Share

 Permalink
South African Journal of Animal Science
On-line version ISSN 2221-4062
Print version ISSN 0375-1589
S. Afr. j. anim. sci. vol.33 n.2 Pretoria 2003
Derivation of standard lactation curves for South African dairy cows
B.E. MostertI, #; H.E. TheronI; F.H.J. KanferII
IARC-AII, Private Bag X2, Irene 0062, South Africa
IIDepartment of Statistics, University of Pretoria, Pretoria 0002, South Africa
ABSTRACT
Standard Lactation Curves were derived for South African Holstein and Jersey cows, using 20 herd-, 18 age- and six season classes. Six herd classes were below and 13 above the average production level for both breeds. A standard lactation curve was estimated for each combination of herd-, age- and season class, which resulted in 2 160 curves per trait per breed. Variation in Holstein yields was much larger than that of Jerseys, causing different herd classes to be defined for both breeds. South African cows displayed more variation in yields compared to those of Holstein cows in the Netherlands and Ireland. Season of calving had a pronounced effect on the shape of the Standard Lactation Curve, while the combination of calving age and lactation affected both the shape and level of the curves. Expected yields were therefore higher during the whole lactation in higher compared to lower herd classes.The results of this study form the basis for inclusion of records in progress and short lactations in national genetic evaluation.
Keywords: Calving age, herd levels, Holstein, Jersey, Standard Lactation Curves, season of calving
Introduction
Genetic analyses of South African dairy breeds are presently based on completed first lactations. Short lactations and records in progress (RIP) are not yet included in national evaluations. Projection of all incomplete lactations to a standard lactation length will allow early release of bull proofs in progeny test results. Farmers will be able to use the expected complete lactation yield of their animals from an early stage to assist in cost saving management decisions (Theron & Mostert, 2001).
The Standard Lactation Curve Method is based on the derivation of Standard Lactation Curves for contemporary groups of cows assumed to be kept in similar production environments. A Standard Lactation Curve based on the mean yield of the contemporaries indicates the expected pattern of production which can guide the projection process. This is particularly important in a production system where the shape of the lactation curve may be significantly influenced by the calving season and other non-genetic factors (Olori & Galesloot, 1999b). The aim of this study was to apply the Standard Lactation Curve Method to South African Jersey and Holstein cows to project records in progress and short lactations to a 305-day standard. This involves the derivation of herd levels and Standard Lactation Curves for South African data.
Material and Methods
For a complete description of the data and procedures used, Mostert et al. (2001) can be consulted. Test-day records for milk-, butterfat- and protein yield of Holstein cows with lactations completed over a three year period and Jersey cows with lactations completed over a 10 year period were obtained from the Intergrated Registration and Genetic Information System (INTERGIS) for cows participating in the South African Dairy Animal Improvement Scheme. After editing 2 537 577 test day records of 116 073 cows, 321 304 lactations in 1590 herds for the Holsteins and 1 673 972 test day records of 90 825 cows, 210 403 lactations in 1182 herds for the Jerseys were available for further analyses.
Daily yields were predicted for each cow on each of a set of 15 fixed days in milk (DIM), ranging between day 10 and day 290, with 20 day intervals for Holstein and Jersey cows separately. Daily yields for fixed days in milk between the first and last observed test-days were obtained by interpolating between successive observed yields, while daily yields before the first observed test and after the last observed test were obtained by fitting a lactation curve function, derived by Wilmink (1987). Lactations with predicted test-day yields at day 10 that were larger or lower than the mean plus two times the standard deviation of the yields predicted for day 10, were deleted. A 305-day yield was calculated for each lactation by linear interpolation from the 15 fixed test-day yields.
The data were classified into six seasons of calving, starting with December/January, and 18 calving age lactation combination classes. Best Linear Unbiased Estimates (BLUEs) were calculated for the effect of season of calving and calving age lactation combination classes on predicted test-days as well as interpolated 305-day yields, using PEST (Groeneveld & Kovac, 1990) and as descibed in Mostert et al., (2001).
The fixed days in milk and cumulative 305-day yields derived for each cow, were adjusted for the effect of season of calving by subtracting the corresponding season effect (BLUE). Following this, multiplicative adjustment for calving age lactation combinations were done by multiplying the yields by the appropriate age correction factor (ACF). Yields were adjusted to the equivalent of calving age lactation combination class 2, i.e. cows calving at 24-26 months of age for the first time. The age correction factor (ACF) was derived, using the BLUEs, as follows (Olori & Galesloot, 1999):
ACFj = (μ + ß2) / (μ + ßj)
Where
ACFj = correction factor for cows in age class j μ = overall mean yield
ß2 = solution for age class 2
ßj = solution for age class j
Herd classes were created (Olori & Galesloot, 1999) by using the mean of the adjusted 305-day yields of all cows across herds as the upper limit for herd class 7. The width of each class was taken as 0.25 times the standard deviation of 305-day yield. Different herd classes were created for each breed.
Herds were grouped according to their mean 305-day yield in a given year and separately for each trait and breed. The same herd could thus be grouped into two or more classes, depending on the average yield in different years and the trait.
Following this, 20 herd curves were derived for each breed by calculating the mean predicted yield on each of the fixed days in milk. Herd curves for classes 16-20 for the Holstein and 17-20 for the Jersey data had to be extrapolated, since the total number of lactations in these herd classes was too few for accurate estimation.
The BLUEs of the daily yield at each fixed day in milk for each of the six seasons of calving were added to each of the 20 herd curves to obtain 120 herd x season curves for each breed. Each of these 120 curves was then divided by each of the 18 calving age adjustment factors, resulting in 2 160 herd production level x season x calving age lactation curves for each trait and breed (Olori & Galesloot, 1999). These curves constituted the final Standard Lactation Curves for South African Jersey and Holstein cows.
Results and Discussion
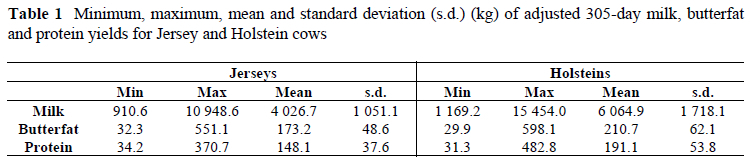
The minimum, maximum, mean and standard deviations for adjusted 305-day milk, butterfat and protein yields of Holstein and Jersey cows are presented in Table 1. The width of the herd classes was 262.8 kg for 305-day milk, 12.2 kg for 305-day butterfat and 9.4 kg for 305-day protein yields of Jersey cows and 429.5 kg, 15.5 kg and 13.5 kg for 305-day yields of Holstein cows.
According to the standard deviations in Table 1, much more variation exists for 305-day yields of Holstein cows in comparison with Jersey cows, resulting in upper limits of herd levels ranging from 3487.7 kg to more than 11 219.2 kg for adjusted 305-day milk yield, 117.7 kg to more than 396.7 kg for adjusted 305-day butterfat yield and 110.3 kg to more than 352.6 kg for adjusted 305-day protein yield. In comparison with these, the upper limits of adjusted 305-day yields for Jersey cows ranged from 2450.0 kg to more than 7180.0 kg for milk, 100.2 kg to more than 319.1 kg for butterfat and 91.6 kg to more than 260.9 kg for protein yields. These limits are much wider than those reported by Olori & Galesloot (1999) for Holstein cows in Ireland as well as in the Netherlands.
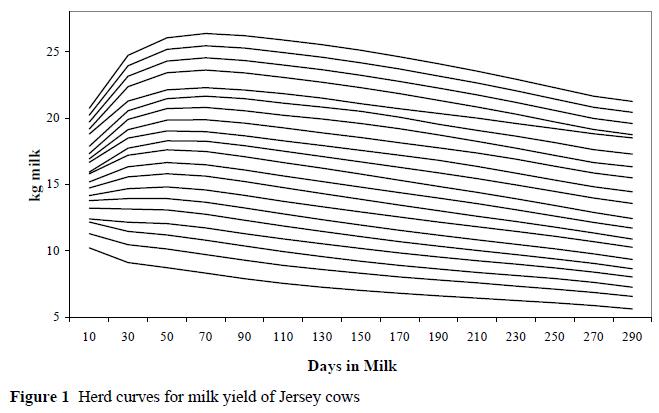
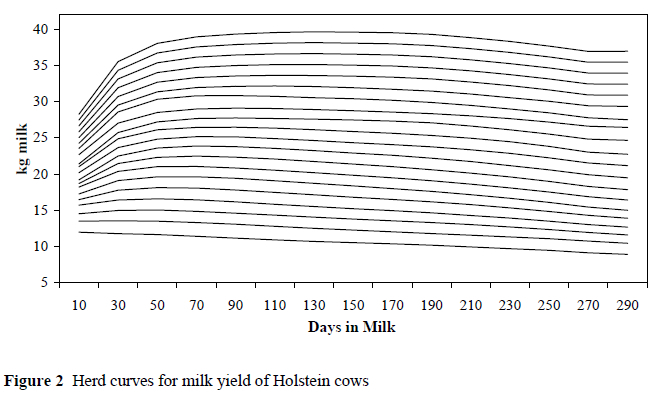
Lactation curves for different herd classes were more or less parallel. Except for the first three fixed days in milk, herd level of production has a scale effect on lactation curves, causing vertical shifts in the entire lactation curve, as can be seen from Figures 1 and 2. The lowest curves are atypical lactation curves, in that the peak yield is realized at the first test day.
The lactations of South African Holstein cows are more persistent than those of Jersey cows, especially in the higher herd level of production classes, probably due to the more general application of BST in Holstein herds.
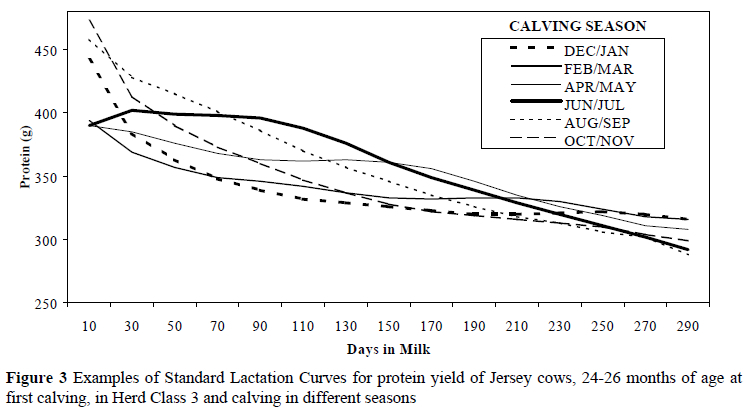
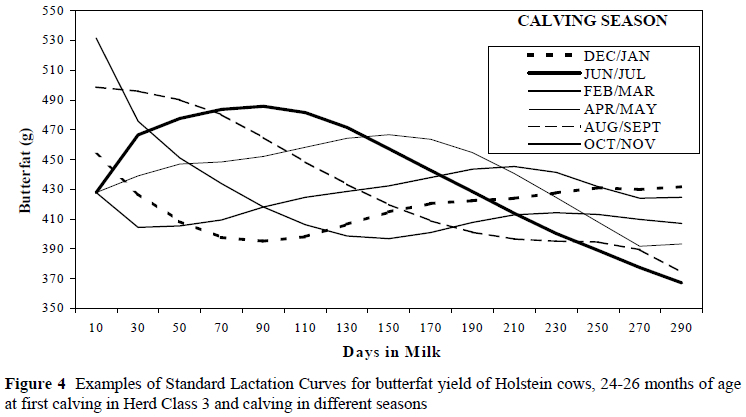
Season has a pronounced effect on the shape of the Standard Lactation Curves (Figures 3 and 4). Within and between breeds this observed effect and pattern was generally the same for all traits. Cows calving in June/July produced according to a typical lactation curve, while those calving in December/January exhibited nearly a mirror-image of the June/July curve. The February/March and April/May curves showed a late surge in yield, often called the 'spring hump'. Olori et al. (1999) also reported a strong influence of calving season on the shape of lactation curves. According to Olori & Galesloot (1999) Holstein cows in Ireland calving in February and March exhibited a typical lactation curve, while others showed a spring hump. Standard Lactation Curves for Holstein cows in Hungary indicated that cows calving in October/November had the highest milk, fat and protein yields in the second half of the lactation compared to other calving seasons. Cows calving in June/July had the lowest yields, during most days of the lactation (J.B. Galesloot, 2000; CR Delta, Product Division NRS, P.O. Box 454, NL-6800 AL Arnhem, The Netherlands, Pers. Comm.).
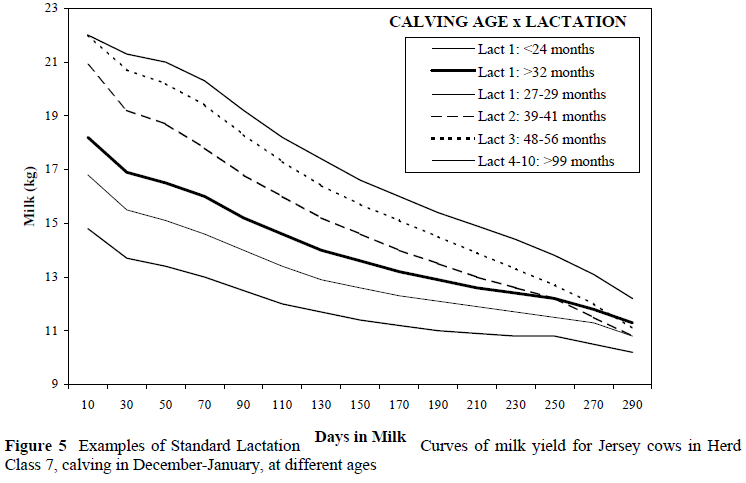
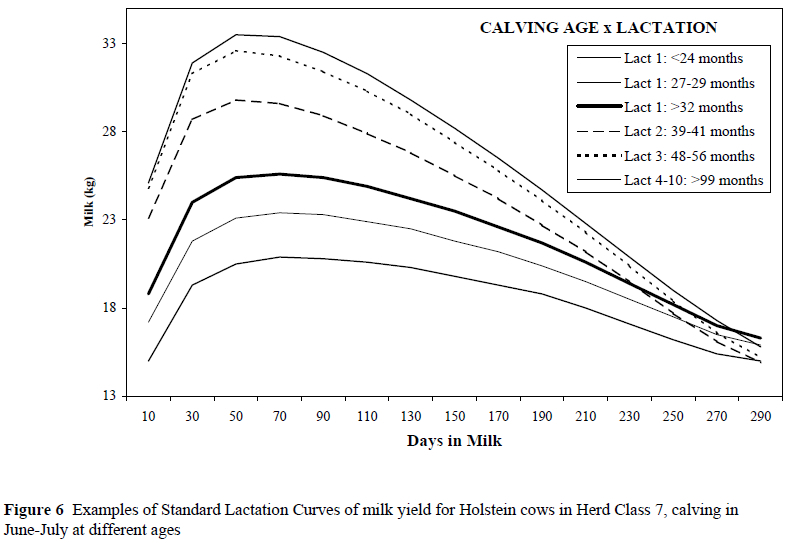
Calving age lactation combinations affected both the level and shape of the Standard Lactation Curves (Figures 5 and 6). The differences in Standard Lactation Curves due to this effect were largest in the first half of the lactation. Differences between first and second parities were relatively large compared to differences between later parities. Furthermore, multiparous cows were less persistent and produced much higher yields in the early stages of lactation than primiparous cows. These differences, however, declined towards the end of lactation. These effects were also reported by Olori & Galesloot (1999) for Holstein cows in Ireland.
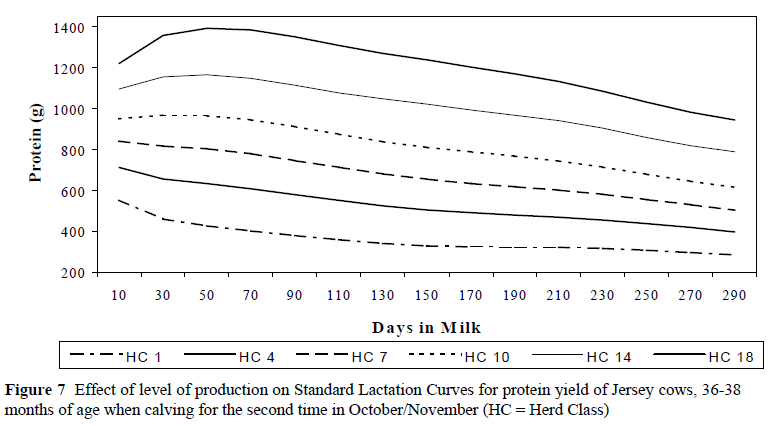
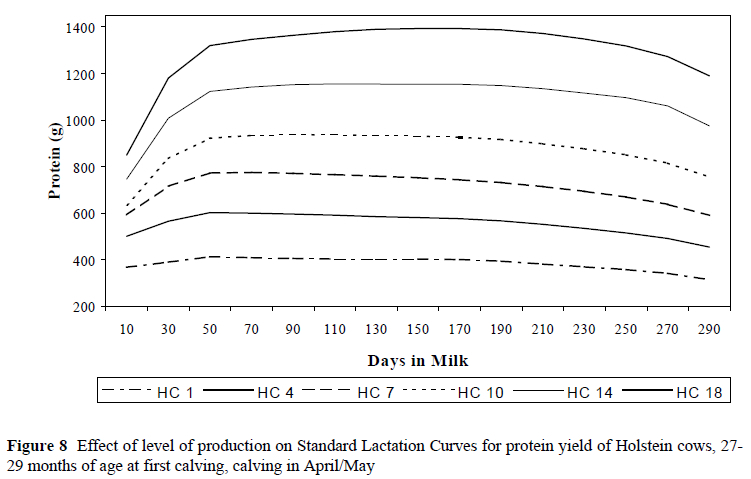
As indicated by the herd curves, herd level of production had a scale effect on Standard Lactation Curves, causing curves of different herd classes to be almost parallel. Expected yields were, therefore, higher during the whole lactation in higher herd classes, compared to lower herd classes. Furthermore, Standard Lactation Curves of higher herd classes tended to be more curved than those of lower herd classes. Persistance of yield was thus lower at higher herd levels, compared to lower herd levels. These results were also reported by Olori & Galesloot (1999) for Holstein cows in Ireland, as well as by Galesloot (2000) for the Dutch goat population and Galesloot (2000, Pers. Comm.) for Holsteins in Hungary.
The Standard Lactation Curves derived in this study were based on the total daily yields obtained from milking twice or three times daily. These curves will, therefore, not be suitable for predicting daily yields from AM or PM milk samples unless these samples are accurately converted to a 24-hour yield equivalent. Since Standard Lactation Curves are highly dependent on the pre-determined standard curves in extending a record in progress, these curves need to be reviewed from time to time to ensure that they represent the current pattern of milk production which depends on current management practices and other environmental factors. In the long run selection can cause genetic changes in overall production, persistency of production and relative proportion of milk components, which will lead to changes in the shape of lactation curves. It is, therefore, recommended that these curves are reviewed every five years or even sooner if the rate of genetic progress is very rapid (Olori & Galesloot, 1999).
Conclusion
Standard Lactation Curves were derived for South African Holstein and Jersey cows using 20 herd-, 18 calving age and six season of calving classes. Six herd classes were below and 13 above the average production level for both breeds. For each combination of herd class, calving age class and season of calving class, a standard lactation curve was estimated, which resulted in 2 160 curves per trait per breed. Variation in yields of South African Holstein cows was larger than that of Jersey cows, which made it impossible to define similar herd classes for both breeds. South African cows also displayed more variation in yields compared to that of Holstein cows in the Netherlands and Ireland. This is probably due to the more diverse climatic conditions in different regions of South Africa.
As a result of this study, records in progress and short lactations can also be included in national genetic analyses.
References
Galesloot, J.B., 2000. Development of lactation curves and projection factors for 305-day yields for the Dutch goat population as a base for management indicators. Proc. 32nd Biennial Session Int. Comm. Anim. Recording (ICAR). Bled, Slovenia. [ Links ]
Groeneveld, E. & Kovac, M., 1990. A generalised computing procedure for setting up and solving Mixed Linear Models. J. Dairy Sci. 73, 513-531. [ Links ]
Mostert, B.E., Theron, H. & Kanfer, F.H.J., 2001 The effect of calving season and age at calving on production traits of South African dairy cattle. S. Afr. J. Anim. Sci. 31, 205-214. [ Links ]
Olori, V.E., Brotherstone, S., Hill, W.G. & McGuirk, B.J., 1999. Fit of standard models of the lactation curve to weekly records of milk production of cows in a single herd. Livest. Prod. Sci. 58, 55-63. [ Links ]
Olori, V.E. & Galesloot, J.B., 1999. Projection of records and calculation of 305-day yields for dairy cattle in the Republic of Ireland. IP/99.2174/PG/NK. [ Links ]
Olori, V.E. & Galesloot, J.B., 1999b. Projection of partial lactation records and calculation of 305-day yields in the Republic of Ireland. Proc. 1999 Interbull Meet. August 26-27, 1999. Zurich, Switzerland. [ Links ]
SAS, 1996. Statistical Analysis Systems user's guide, (Release 6.12). SAS Institute Inc., Cary, North Carolina, USA. [ Links ]
Theron, H.E. & Mostert, B.E., 2001. Future prediction of lactation production with IRIS. National Dairy Animal Improvement Scheme. Newsletter No 7, May 2001. [ Links ]
Wilmink, J.B.M., 1987. Adjustment of test day milk, fat and protein yield for age season and stage of lactation. Livest. Prod. Sci. 16, 335-348. [ Links ]
# Corresponding author. E-mail: bernice@irene.agric.za

