


Services on Demand
Article
 English (pdf)
 Article in xml format
 Article references
Indicators

Related links
-
 Cited by Google
 -
 Similars in Google
Share

 Permalink
South African Journal of Animal Science
On-line version ISSN 2221-4062
Print version ISSN 0375-1589
S. Afr. j. anim. sci. vol.33 n.2 Pretoria 2003
Variation in the chemical composition, physical characteristics and energy values of cereal grains produced in the Western Cape area of South Africa
T.S. BrandI, II, ; C.W. CruywagenII; D.A. BrandtI, II, III; M. ViljoenI; W.W. BurgerI
IElsenburg Agricultural Research Centre, Private Bag XI, Elsenburg 7607, South Africa
IIUniversity of Stellenbosch, Private Bag X1, Matieland 7602, South Africa
IIIAfgri Feeds, PO Box 135, Isando 1600, South Africa
ABSTRACT
Grain samples were produced at 10 different locations in the Western Cape region of South Africa, on 2.1 m x 6 m experimental plots, over a period of three years. Twenty different cereal grain cultivars were used in the study. A randomised square experimental design with four replicates per sample was used. An area of 1.35 m x 5 m from each plot was harvested during 1994, 1995 and 1996 and the yield was determined. Thousand seed mass (TSM) and hectolitre mass (HLM) were also determined. Samples were analysed for dry matter (DM), ash, crude protein (CP), ether extract (EE), neutral detergent fibre (NDF), acid detergent fibre (ADF) and in vitro organic matter digestibility (IVOMD). Digestible energy values (DE) for pigs were determined with a mobile nylon bag technique, while non-structural carbohydrate values (NSC) were calculated. In the first analysis, cultivars were compared by a one-way analysis of variance, followed by pooling of grain type data. Naked oats had the highest DE value, and the respective values (DM basis) for naked oats, wheat, triticale, 2-row brewer's barley, 6-row feed barley and oats were 18.0, 16.0, 15.8, 14.9, 14.4, and 12.6 MJ/kg DM. The high EE value of naked oats (97 g/kg) might be partly responsible for the high DE value. The 6-row and 2-row naked barley cultivars had the highest IVOMD (946 g/kg and 944 g/kg), followed by wheat (910 g/kg), triticale (905 g/kg), naked oats (899 g/kg), 2-row brewer's barley (882 g/kg), 6-row feed barley (844 g/kg) and oats (671 g/kg). Considerable variation was found between samples within a cultivar for DE and IVOMD. Two-row naked barley had the highest mean CP value (159 g/kg) followed by naked oats (159 g/kg), 6-row naked barley (154 g/kg), wheat (148 g/kg), triticale (146 g/kg), oats (143 g/kg), 2-row brewer's barley (136 g/kg) and 6-row feed barley (135 g/kg) on DM basis. Triticale had the highest yield, with naked oats and barley cultivars having the lowest yield.
Keywords: Cereal grains, chemical composition, energy value
Introduction
Approximately 75% of the total cost of intensive animal production is due to feed costs (Brand, 2000). Maize, which is traditionally the main energy source in diets of intensively fed animals, is grown mainly in the northern summer rainfall regions of South Africa. This leads to an additional transport cost of approximately 15% added to the price of maize in the Western Cape. Researchers have been forced, therefore, to investigate alternative grains that can be produced and used as a possible alternative in the Western Cape. An advantage of cereal grains vs. maize in diets is their higher protein content which allows lower inclusion levels of expensive protein sources, and hence a cost reduction of the final diet. Most of these cereal grains have been evaluated locally in balanced diets. These include barley (Kritzinger & Olckers, 1985), naked oats (Brand & Van der Merwe, 1996), wheat (Kemm et al., 1986) and triticale (Horsten, 1977; Brand et al., 1995) for monogastric animals, and barley (Brand & Swart, 1999; Lehmann et al., 2002) and triticale (Du Plessis, 1989; Griessel, 1991; Brand & Van der Merwe, 1996) for ruminants. Most of these studies indicate that maize can be replaced successfully by cereal grains, depending on the prices of both grain types. The current study was planned to obtain information on the variation in the chemical composition and energy value of different types and cultivars of cereal grains produced in the Western Cape area of South Africa. Such information is essential in the formulation of diets for optimal livestock production.
Materials and methods
Cereal grain samples were collected from experimental plots at 10 different locations in the Western Cape region of South Africa. Samples were obtained from grain produced on 2.1 m x 6 m experimental plots at Aurora, Bredasdorp, Caledon, Ceres, Eendekuil, Hopefield, Moorreesburg, Riversdal, Riviersonderend and Swellendam over a period of three years. A complete randomised design (Snedecor & Cochran, 1980) with four replicates per sample was used. An area of 1.35 m x 5 m from each plot was harvested during 1994, 1995 and 1996 and yields were determined. Grain types and cultivars used in the study include: 2-row brewer's barley (cv Clipper), 2-row naked barley (cv Vloekskoot), 6-row feed barley (cv Cape-barley, Dayan, Galleon, SVG 13, Turkish), oats (cv Calgoa, Cederberg, Heros, Perdeberg), naked oats (cv Bandicoot), wheat/triticale (cv Alpha/Kiewiet), wheat (feed grade) (cv Alpha), wheat (baking quality) (cv Palmiet) and triticale (cv Kiewiet, Rex, SCR 13, Usgen 18, Usgen 19).
Thousand seed mass was determined with an automatic seed counter. Hectolitre mass of wheat and triticale was determined by using the upper level of a two level funnel, and that of barley and oats by using the lower level, as described by the South African Wheat Board (1986). Samples were analysed for dry matter (DM), crude protein (CP), ether extract (EE) and ash by standard analytical methods (AOAC, 1984). Neutral detergent fibre (NDF) and acid detergent fibre (ADF) were determined, as described by Van Soest (1963) and Van Soest & Wine (1967). In vitro organic matter digestibility (IVOMD) was determined by the method as described by Tilley &Terry (1963).
Total digestible nutrient (TDN) content was calculated according to the equation of Engels (1966) as: TDN (%DM) = [(100 - % ash)/100] x (0.8 IVOMD +15.35). Non-structural carbohydrates (NSC) was calculated according to Smith (1995) as: NSC = 100 - (% NDF + % CP + % EE + % ash). Digestible energy (DE) was determined with the mobile nylon bag technique on pigs as described by Brand et al. (1989). The DE values were corrected for overestimation by the regression equation (y = 1.998 + 0.788x), as described by Brand (2000).
Analysis of variance (Snedecor & Cochran, 1980) was performed on the data to compare the different cultivars irrespective of grain type. Differences between mean values were indicated by least significant difference (LSD; P < 0.05). Cultivar data were pooled within grain type for comparisons between grain types. Due to differences in soil type, rainfall, fertiliser application and soil pre-treatment that occurred between localities and years, the effects of locality and year were not analysed. All statistical analyses were done with Statgraphics 5.0 (1991). Statistical significance is declared at P < 0.05, unless otherwise indicated.
Results and discussion
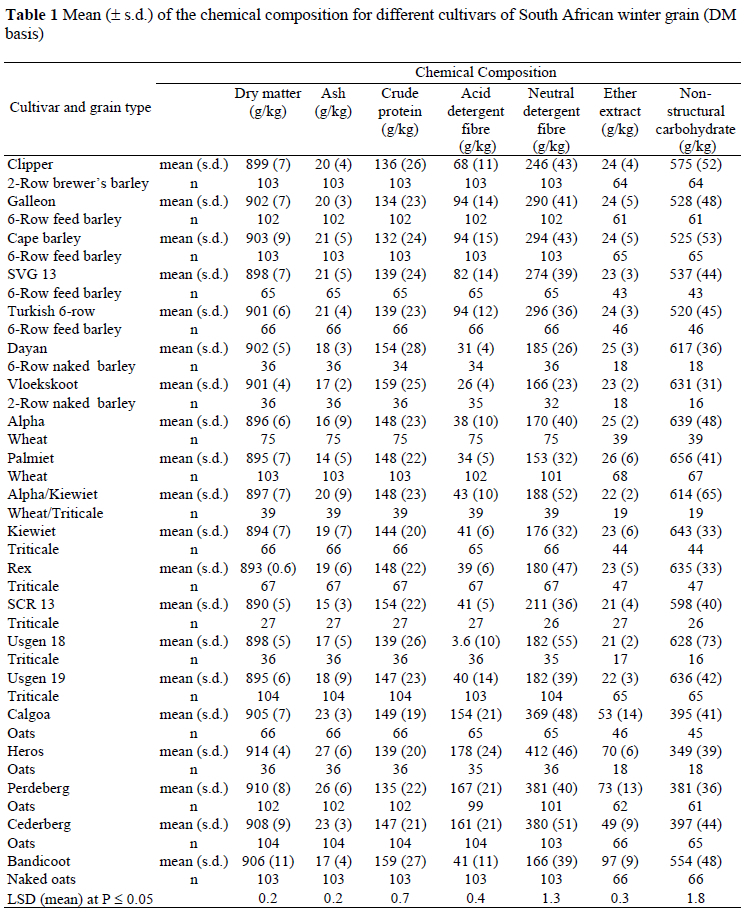
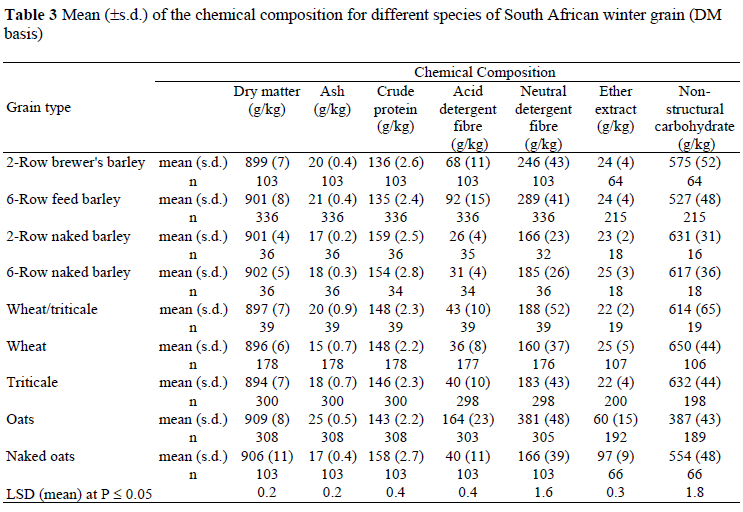
Results pertaining to the chemical analyses, physical properties and energy values of different cereal grain cultivars are presented in Tables 1 and 2, respectively, and that of different species in Tables 3 and 4, respectively. The mean CP value of all the grain cultivars varied between 132 g/kg (Cape barley, a 6-row feed barley) and 159 g/kg (Vloekskoot, a 2-row naked barley). In general, the naked oats cultivars had the highest CP value (Table 1). Due to considerable variation within both cultivars and species, no pattern was observed to rank species according to CP value. However, when cultivar data were pooled for species, it appears that the naked grains had the highest CP values followed by wheat, triticale and oats, while brewer's and feed barley had the lowest CP values. Pomeranz (1981) found a negative relationship between yield and CP concentration of wheat and Smith & du Preez (1994) reported a higher yield for Palmiet than for Alpha. In the current study no differences were found between wheat cultivars regarding yield or CP concentration. The CP value of individual wheat samples varied between 109-219 g/kg, which is similar to the variation reported by Batterham et al. (1980), viz. 122-217 g/kg. Kemm et al. (1986) collected 112 feed-grade wheat samples from different locations throughout South Africa and reported a mean CP value of 175 g/kg, which is higher than the mean value for wheat in the current study (148 g/kg). According to Taverner et al. (1975) the mean CP value of sound wheat was 133 g/kg. They also reported that the CP concentration decreased in sprouted and rust damaged wheat. The 2-row brewer's barley cultivar, Clipper, had a mean CP value of 136 g/kg. This was higher than the optimal CP for malting, viz. 125 g/kg CP (South African Wheat Board, 1992). Van der Merwe & Smith (1991) quoted a mean value of 111 g/kg CP for South African barley. In the current study the mean CP value of feed barley was 135 g/kg. Bourdon et al. (1987) reported CP values of 116 g/kg and 107 g/kg for 2-row and 6-row barley, respectively. Both the naked barley cultivars analysed in the current study had a CP value of almost two percentage units higher than that of feed barley and these values were also considerably higher than the 126 g/kg for naked barley reported by Bourdon et al. (1987). Radcliffe et al. (1983) found the mean CP value of nine different triticale cultivars from different locations in Southern Australia to vary from 112 to 141 g/kg. The variation between cultivars in the current study was smaller (139-154 g/kg CP), although the variation between individual samples was larger. Smith (1994) found the CP value of triticale in the Western Cape to vary from 85 g/kg to 224 g/kg, with a mean value of 123 g/kg. The mean CP value for South African triticale quoted by Van der Merwe & Smith (1991) was 113 g/kg CP. According to Van der Merwe & Smith (1991) the mean CP value of South African oats is 111 g/kg, while the current study indicated a mean value of 143 g/kg for oats produced in the Western Cape. Bourdon et al. (1987) reported CP values of 116 g/kg for oats and 151 g/kg for naked oats. In the current study, the mean CP value of naked oats was 159 g/kg.
The mean ADF value of all the cultivars ranged from 26 g/kg for Vloekskoot (a 2-row naked barley) to 178 g/kg for Heros oats (Table 1). The oat cultivars had the highest ADF value, followed by the feed and brewer's barley cultivars, while wheat, triticale and the naked grain cultivars tended to be low in ADF. This pattern is also evident when cultivar data were pooled within species (Table 3). Huge variations occurred within cultivar and species. Since ADF is negatively correlated with digestibility and energy content, the high ADF content of the oat cultivars impacted on the TDN and DE values (Table 4). According to Batterham et al. (1980) the ADF values of sound wheat ranged from 37 to 71 g/kg, while it ranged from 24 to 87 g/kg for weather damaged wheat. The NDF followed the same tendency as ADF. The mean NDF values of all the cultivars varied between 166 g/kg for Vloekskoot 2-row naked barley and 412 g/kg for Heros oats (Table 1). All the oat cultivars had NDF values >360 g/kg, the feed and brewer's barley cultivars values <300 g/kg, while wheat, triticale (except SCR 13) and naked grain cultivars had NDF values <200 g/kg. Pooled data (table 3) also confirmed this pattern. As with ADF, considerable variation in NDF content was observed within cultivars and species. Compared to the other barley cultivars, the lower ADF and NDF values in the naked barley cultivars are a result of the smaller husk-fraction of these cultivars. Bourdon et al. (1987) reported ADF and NDF values for 2-row, 6-row and naked barley of 63 g/kg, 75 g/kg, 22 g/kg and 174 g/kg, 209 g/kg, 123 g/kg, respectively. These values are much lower than values found in the current study (Table 3). The NDF values for wheat observed by Batterham et al. (1980) were considerably lower (100-152 g/kg) than values found in the current study. Campbell et al. (1995) found a negative relationship between test weight, ADF (r = -0.31) and NDF (r = -0.44), while they reported a positive relationship between test weight and starch (r = 0.43) in different cultivars of wheat grown on different localities over a three-year period. Oats differs from other cereal grains due to its higher fibre content. Oats contains 26% husks (Todorov, 1988), which is one of the main reasons for the higher fibre content. According to Van der Merwe & Smith (1991), oat husks contain 386 g/kg ADF and 718 g/kg NDF. These authors reported average ADF and NDF values for South African oats of 146 g/kg and 291 g/kg, respectively, which are lower than values found in the current study.
Although a marked variation in EE value was observed between cultivars for all the species, the mean EE value of all the barley, naked barley, wheat and triticale cultivars varied only between 21 g/kg (Usgen 18 triticale) and 26 g/kg (Palmiet wheat). The oat cultivars had EE values varying between 49 g/kg (Cederberg) and 97 g/kg (Bandicoot naked oats), with significant differences occurring both between and within cultivars. Pooled data indicated that oats had a higher (P < 0.05) mean EE value than barley, wheat and triticale, while naked oats had the highest EE value. The mean EE value of wheat in the current study was 37% higher than values observed by Traverner et al. (1975). Batterham et al. (1980) reported values for different wheat cultivars that ranged from 17 to 21 g/kg, which are somewhat lower than mean values found in the current study. The mean EE value of 2-row and 6-row barley cultivars varied slightly around 24 g/kg, and for naked barley from 23 - 25 g/kg, while variation between individual samples was higher. Bourdon et al. (1987) reported mean EE values of 23 g/kg, 21 g/kg and 23 g/kg for 2-row, 6-row and naked barley, respectively, which are quite similar to values in the current study. Van der Merwe & Smith (1991) reported the mean EE value for South African barley to be 22 g/kg, which is also in the range of the values in the current study. The mean EE value for triticale found in this study was 57% higher than the mean value for South African triticale (14 g/kg; Van der Merwe & Smith, 1991). Individual triticale samples varied from 14 to 54 g/kg. Bourdon et al. (1987) reported an EE value of 58 g/kg for naked oats, which is much lower than the 97 g/kg found in the current study.
The mean ash value of all the cultivars (Table 1) varied between 14 g/kg (Palmiet wheat) and 27 g/kg (Heros oats). Although considerable variation occurred between cultivars and species, oats had the highest mean ash value. No clear pattern was observed to rank species.
The mean NSC value of all the grain cultivars varied between 349 g/kg (Heros oats) and 656 g/kg (Palmiet wheat) (Table 1). Due to the higher NDF value of oats, all the oat cultivars (except naked oats) had NSC values <40%, while the NSC value of all the other grains was >52%. Pooled data (Table 3) indicated that wheat had the highest NSC value, followed by triticale, naked barley, brewer's barley, naked oats, feed barley and oats.
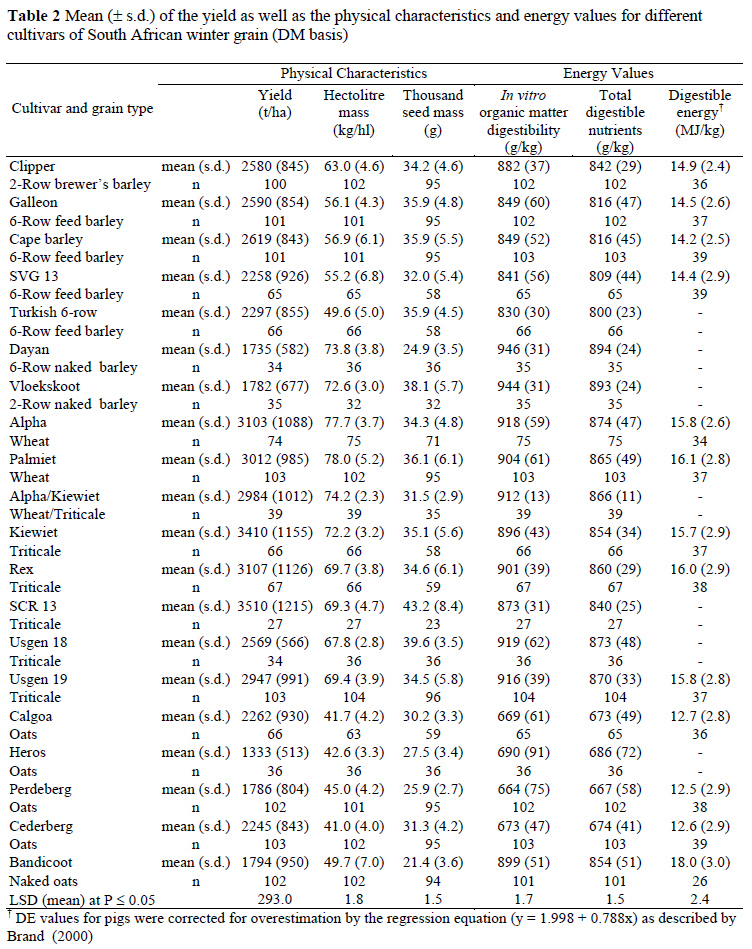
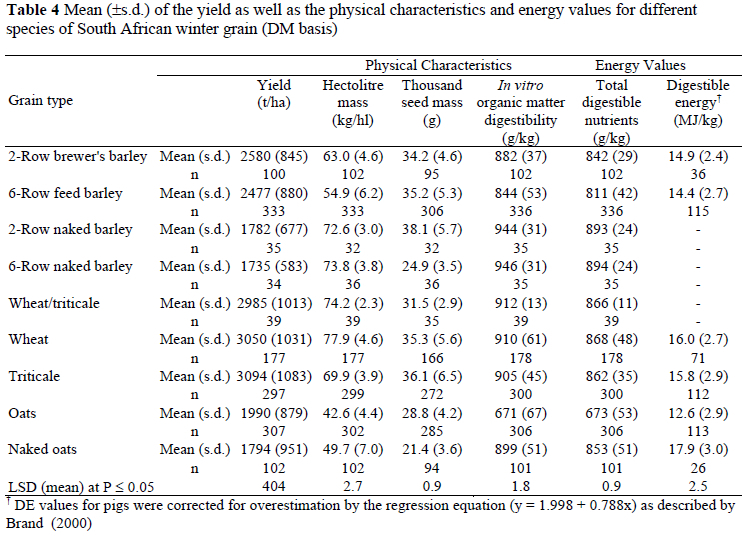
Mean grain yields of all the cultivars varied between 1333 t/ha (Heroes oats) and 3510 t/ha (SCR 13 triticale). Considerable variation occurred between both cultivars and species, due to factors such as soil type, rainfall, fertilisation and soil pre-treatment. Wheat and triticale cultivars had the highest yields (Table 1). Pooled data indicated that triticale and wheat had significantly higher (P < 0.05) yields than the other grains. There were no significant differences in yield between the other grains.
Regarding hectolitre mass, mean values of all the grain cultivars varied from 41.0 kg/hl (Cederberg oats) to 78.0 kg/hl (Palmiet wheat, Table 1). The wheat cultivars had the highest density, with HLM values between 77.7 and 78.0 kg/hl, while the oat cultivars had the lowest density, with values ranging from 41.0 to 45.0 kg/hl. Wheat, naked barley and triticale all had densities of approximately 70 kg/hl and higher, while values were between 54 and 63 kg/hl for feed and brewers barley, below 50 kg/ha for naked oats and <43 kg/hl for oats (Table 3). The mean thousand seed mass (TSM) of all the cultivars varied between 21.4 g (Bandicoot naked oats) and 43.2 g (SCR 13 triticale). No pattern was observed for cultivars and species, but when cultivar data were pooled, 2-row naked barley had the highest TSM and naked oats the lowest. According to Corah & Kuhl (1985) a higher fibre fraction is normally associated with a lower density in small grains. All the oat cultivars were lower in hectolitre mass than the other cereal grains used in this study, except for the naked oat cultivar, Bandicoot. In the naked oat varieties the husks are removed from the kernels in the threshing process (Todorov, 1988). According to Todorov (1988) the yield of naked oats is lower than that of normal oats, which corresponds with results found in the current study. The hectolitre mass of Bandicoot was only slightly higher than the oat cultivars (Table 2), but lower than that of the non-oat cultivars. This would suggest that the correlation between hectolitre mass and fibre content is not necessarily linear across all different grain types and that naked oats may be an exception to the rule. The same phenomenon was found for the DE content and the hectolitre mass of naked oats. By simply ranking grains in descending order of DE content, HLM values would also descend, while ADF, NDF and ash would be in ascending order, if the naked oats were excluded.
Mean in vitro organic matter digestibility values of all the cultivars varied between 664 g/kg (Perdeberg oats) and 946 g/kg (Dayan 6-row naked barley). The naked barley cultivars had significantly higher IVOMD and TDN values than any of the other grains. Wheat cultivars were second in ranking, followed by triticale, naked oats, brewer's barley and feed barley cultivars, while oat cultivars had the lowest IVOMD and TDN. This pattern was confirmed when cultivar data were pooled (Table 4). Brand & Swart (1995) found that hectolitre mass of barley accounted for 50% of the variation in IVOMD, while percentage of screenings was associated with 32.6% of the variation in IVOMD. Crude fibre accounted for 41.4% and ADF for 35% of the variation in IVOMD of barley. The naked barley cultivars had higher IVOMD values, due to higher hectolitre mass and lower fibre fractions. Only the two naked barley cultivars were superior to triticale in terms of IVOMD and TDN. This is probably due to the lower fibre fraction (ADF and NDF) in the former. Wheat and naked barley cultivars also had higher hectolitre masses than triticale. Van der Merwe & Smith (1991) reported lower TDN values for triticale than for wheat (867 vs. 889 g/kg), while comparable TDN (and IVOMD) values were found for wheat and triticale in the current study. The TDN value reported by Van der Merwe & Smith (1991) for South African triticale is higher than the mean values found in the current study. The considerable variation that occurred within cultivars emphasises the importance of using actual values rather than table values.
Considerable variation in DE content was observed between samples within cultivars for all the grains. This can have a significant effect on animal performance and emphasises again the importance of using actual nutritive values of feedstuff rather than table values in animal nutrition. Mean DE-values of the tested cultivars (Table 2) varied between 12.6 MJ/kg (Perdeberg oats) and 18 MJ/kg (Bandicoot naked oats). Pooled data (Table 4) indicated that naked oats had a significantly higher DE content than wheat and triticale, followed by brewer's and feed barley, which had a significantly higher DE content than oats. Digestible energy values for wheat are related to test weight (hectolitre mass) and degree of damage (Taverner et al., 1975; Batterham et al., 1976). The DE values determined by Taverner et al. (1975; 15.2 MJ/kg) and Batterham et al. (1976; 15.73 MJ/kg) for rust affected or weather damaged wheat, are lower than the values found in the current study. According to Batterham et al. (1976) the energy value of wheat decreased with 13% when the grain density decreased from 77 to 50 kg/hl. Van der Merwe & Smith (1991) reported a value of 16.2 MJ/kg for South African wheat, which corresponds with values found in the current study. Kemm et al. (1986) found a mean DE value of 14.95 MJ/kg for feed grade wheat. The wheat used in their study also had a lower mean hectolitre mass (72.2 kg/hl). The mean DE value of barley did not show a large variation between cultivars. The 2-row brewer's barley cultivar, Clipper, had a higher DE value than the 6-row feed barley cultivars. Batterham et al. (1980) found the mean DE value for 2-row brewer's barley (14.2 MJ/kg) to be slightly lower than that of 6-row feed barley (14.3 MJ/kg). Bourdon et al. (1987) reported values of 14.7 MJ/kg and 14.6 MJ/kg DE for 2-row and 6-row barley cultivars, respectively, compared to 14.9 MJ/kg and 14.4 MJ/kg in the current study. Individual samples varied form 10.3-16.5 MJ/kg. This observation does not support that of Batterham et al. (1980), who found little variation in DE values for barley (13.9-14.6 MJ/kg). In the latter study, the DE values varied from 13.9 MJ/kg to 14.60 MJ/kg. Van der Merwe & Smith (1991) presented a mean DE value of 14.7 MJ/kg for South African barley, which is similar to the value (14.6 MJ/kg) found in the current study. The amount of husks in grain is related to the fibre content (Todorov, 1988), which again is related to the hectolitre mass (Corah & Kuhl, 1985). Brand et al. (1995) found that all fibre fractions (CF, ADF, and NDF) were positively related to percentage of screenings and negatively related to hectolitre mass, percentage of plum kernels, and energy values. Barley, with a high percentage of screenings is undesirable for the malting industry (South African Wheat Board, 1992). For this reason, commercially available barley for animal feed is likely to have a high percentage of screenings and thus, a lower energy value. Barley contains about 15% husks which decreases its hectolitre mass (Todorov, 1988) and, therefore, its DE value. This explains its inferior DE value compared to that of wheat. The DE value of triticale ranked three, four and six out of the 13 cultivars on which DE was determined, and little variation was observed between cultivars. Charmley & Greenhalgh (1987) found the DE values of triticale (14.6-15.5 MJ/kg) to be slightly, but significantly, lower than that of wheat due to the higher fibre value. Van der Merwe & Smith (1991) reported a mean DE value of 15.8 MJ/kg (DM basis) for South African triticale, which corresponds with values of the current study. Leterme et al. (1991) reported a strong negative correlation between DE and crude fibre (r = -0.98) and ADF (r = -0.88) in triticale and according to Todorov (1988), grain density in triticale may be positively correlated with DE. Factors that could affect the DE value of triticale include a trypsin inhibitor and 5-alkyl resorcinol (Evans, 1985). According to Annison (1993) triticale and wheat contain soluble non-starch polysaccharide (NSP) cell wall components, mainly arabinoxylans with some β-glucans, which increase viscosity and water retention in the gut. Starch, protein and lipid digestion, as well as ME values can therefore be depressed in poultry. According to Van der Merwe & Smith (1991), the mean DE value of South African oats is 12.7 MJ/kg, which is slightly higher than the value found in the current study. Little variation occurred between mean DE values of different oat cultivars (excluding Bandicoot), while individual samples varied considerably. The DE value of Bandicoot (Table 2) exceeded that of wheat, triticale and South African maize (15.8 MJ/kg for yellow maize and 16.5 MJ/kg for white maize, according to Siebrits et al. (1997). The high EE value was probably responsible for the high DE value. Van der Merwe & Smith (1991) reported a TDN value of 740 g/kg for South African oats. This value is higher than the value found in this study. Due to the lower TDN value and higher fibre value of oats compared to other cereals, oats is not used at high levels in diets of non-ruminants. Oats is preferred in the diets of horses, because of its higher fibre content and bulky husks. It forms a loose mass in the stomach, which is readily digestible and decreases the incidence of colic in animals (Todorov, 1988).
Conclusions
Variation in chemical composition, physical characteristics and energy values observed between individual samples of cereal grains in this study, was higher than that documented in the literature. Such variation could impact on animal performance if diet formulations are based on mean table values. Values presented in this paper may be valuable, especially when specific cultivars are used in diet formulation.
The triticale cultivars, SCR 13, Kiewiet and Rex, and the wheat cultivars, Alpha and Palmiet, had the highest yields and would be preferred by grain producers. Naked oats, bread wheat (Palmiet) and the relatively new triticale varieties, Rex and Usgen 19, were superior in energy content, while the naked cultivars (both barley and oats) and the triticale cultivar, SCR 13, were superior in CP content and would be preferred by feed formulators.
The study presents an addition to the database of the chemical composition, physical characteristics and energy contents of South African feed grains. Additional information on these grains, such as amino acid composition, should be obtained in future work.
Acknowledgements
The Elsenburg Agricultural Research Centre as well as the Red Meat Research Trust of South Africa funded this study.
References
Annison, G., 1993. The role of wheat non-starch polysaccharides in broiler nutrition. Aust. J. Agric. Res. 44, 405-422. [ Links ]
AOAC, 1984. Official methods of analysis (13th Ed.). Association of Official Analytical Chemists, Washington DC. [ Links ]
Batterham, E.S., Lewis, C.E. & McMillan, C.J., 1976. Weather damaged wheat for pigs. Proc. Aust. Soc. Anim. Prod. 11, 401-404. [ Links ]
Batterham, E.S., Lewis, R.F. & McMillan, C.J., 1980. Digestible energy content of cereals and wheat byproducts for growing pigs. Anim. Prod. 31, 259-271. [ Links ]
Bourdon, D., Fevrier, C., Perez, J.M., Lebas, F., Leclercq, B., Lessire, M. & Sauveur, B., 1987. Tables of raw materials. In: Feeding non-ruminant livestock. Ed. Wiseman, J., Butterworths, London. [ Links ]
Brand, T.S., 2000. A review on research performed in South Africa on small grains as energy source in pig diets. Pig News Info. 21, 99-102. [ Links ]
Brand, T.S., Badenhorst, H.A., Siebrits, F. K. & Hayes, J. P., 1989. Use of the mobile nylon bag technique to determine digestible energy in pigs. S. Afr. J. Anim. Sci. 19, 165-170. [ Links ]
Brand, T.S., Olckers, R.C. & van der Merwe, J.P., 1995. Triticale (Tritico secale) as a substitute for maize in pig diets. Anim. Feed Sci. Technol. 53, 345-352. [ Links ]
Brand, T.S. & Swart, C., 1995. Chemical composition and energy values of South African barley grain. Afma Matrix. March 1995, 16-21. [ Links ]
Brand, T.S. & Swart, C., 1999. The relationship between various physical and chemical measurements on barley grain and its nutritive value measured by in sacco and in vitro techniques. J. Appl. Anim. Res. 15,153-163. [ Links ]
Brand, T.S. & Van der Merwe, G.D., 1994. Comparison of triticale cultivars with maize grain for finishing lambs. S. Afr. J. Anim. Sci. 24, 143-146. [ Links ]
Brand T.S. & Van der Merwe, J. P., 1996. Naked oats (Avena nuda) as substitute for maize in the diets of weanling and grower-finisher pigs. Anim. Feed. Sci. Technol. 57, 139-147. [ Links ]
Campbell, L.D., Biola, R.J. & Stothers, S.C., 1995. Variation in chemical composition and test weight of barley and wheat grain grown at selected locations throughout Manitoba. Can. J. Anim. Sci. 75, 239246. [ Links ]
Charmley, E. & Greenhalgh, J.F.D. 1987. Nutritive value of three cultivars of Triticale for sheep, pigs and poultry. Anim. Feed Sci. Technol. 18, 19-35. [ Links ]
Corah, L. & Kuhl, G., 1985. Translating grain grades into feeding values. Feedlot Management. Febr. p. 42. [ Links ]
Du Plessis, G.S., 1989. Die vervanging van mieliemeel met korogmeel vir die vetmesting van vleisbeeste. MSc-tesis, University of Stellenbosch, Stellenbosch 7600, South Africa. [ Links ]
Engels, E.A.N., 1966. Die uittoets van 'n in vitro-tegniek vir die voorspelbaarheid van die verteerbaarheid van ruvoere. MSc-tesis. University of Stellenbosch, Stellenbosch 7600, South Africa. [ Links ]
Evans, M., 1985. Nutrient composition of feedstuffs for pigs and poultry. pp 19. Pig and Poultry Branch, Animal Research Institute. Queensland Department of Primary Industries, GPO Box 46, Brisbane, 4001, Australia. [ Links ]
Griessel, A., 1991. Die vervanging van mieliegraan met koroggraan in suiwelkonsentrate vir melkbeeste. MSc-tesis, University of Stellenbosch, Stellenbosch 7600, South Africa. [ Links ]
Horsten, L.R.A., 1977. An evaluation of triticale as a feed grain for growing pigs. MSc thesis, University of Stellenbosch, Stellenbosch 7600, South Africa. [ Links ]
Kemm, E.H., Siebrits, F.K. & Ras, M.N., 1986. The composition and use of South African feed-grade wheat for growing pigs. S. Afr. J Anim. Sci. 16, 183-186. [ Links ]
Kritzinger, M.N. & Olckers, R.C., 1985. Gars as alternatiewe energiebron vir mielies in diëte van groeivarke. S. Afr. J. Anim. Sci. 15, 47-51. [ Links ]
Lehmann, M., Meeske, R., Van der Merwe, G.D. & Greyling, J.F., 2002. Replacing maize with barley, in concentrates, fed to Jersey cows grazing on kikuyu/ryegrass pastures. GSSA/SASAS Joint Congress, Christiana, May 2002. p. 111. [ Links ]
Leterme, P., Tahon, F. & Thewis, A., 1991. Nutritive value of triticale cultivars in pigs as a function of their chemical composition. Anim. Feed Sci. Technol. 35, 49-53. [ Links ]
Pomeranz, Y., 1981. Genetic factors affecting protein content and composition of cereal grains. Wld. Rev. Nutr. Diet. 36, 174-205. [ Links ]
Radcliffe, B.C., Egan, A.R., & Driscoll, C.J., 1983. Nutritional evaluation of triticale grain as animal feed. Aust. J. Exp. Agric. Anim. Husb. 23, 419-425. [ Links ]
Siebrits, F.K., Van Rensburg, W.H.J. & Coetzee S.E., 1997. Voedingswaarde van mielies. Porcus Feb/Mrt. 1997. p.16. [ Links ]
Smith, W.A., 1994. Wheat and triticale in ruminant diets. Afma Matrix. June 1994, 4-6. [ Links ]
Smith, W.A., 1995. Recent advances in dairy nutrition. Department of Animal Science, University of Stellenbosch, Private Bag X1, Matieland 7602, South Africa. [ Links ]
Smith , W.A. & Du Preez, J.J., 1994. Wheat and triticale in poultry and swine diets. Afma Matrix. September 1994, 25-27. [ Links ]
Snedecor, G.W. & Cochran, W.G., 1980. Statistical Methods. (7th Ed.). Iowa State University Press. Ames, Iowa. [ Links ]
South African Wheat Board, 1986. South African Wheat Board, PO Box 908, Pretoria, 0001. [ Links ]
South African Wheat Board, 1992. Rules relating to the classification, grading and packing of wheat, barley, oats and rye. South African Wheat Board, PO Box 908, Pretoria, 0001. [ Links ]
Statgraphics 5.0, 1991. Statistical Graphic System. Statistical Graphic Corporation Inc., 2115 East Jefferson Street, Rockville, MD, 20852, pp 015-033. [ Links ]
Tilley, J.M.A. & Terry, R.A., 1963. A two-stage technique for the in vitro digestion of forage crops. J. Brit. Grassl. Soc. 18, 104-111. [ Links ]
Taverner , M.J., Rayner, C.J. & Biden, R.S., 1975. Amino acid content and digestible energy value of sprouted, rusted and sound wheat. Aust. J. Anim. Sci. 26, 1109-1117. [ Links ]
Todorov, N.A., 1988. Feeds and feedstuffs in Europe. 2.3 Cereals, pulses and oilseeds. Livest. Prod. Sci. 19, 47-95. [ Links ]
Van der Merwe, F.J. & Smith, W.A., 1991. Dierevoeding. Anim. Sci. (Pty) Ltd., Pinelands, South Africa. [ Links ]
Van Soest, P.J., 1963. Use of detergents in analysis of fibrous feeds. II. A rapid method for determination of fibre and lignin. J.A.O.A.C. 46, 825-835. [ Links ]
Van Soest, P.J. & Wine, R.H., 1967. Use of detergents in analysis of fibrous feeds. II. Determination of plant cell wall constituents. J.A.O.A.C. 50, 50-55. [ Links ]
# Corresponding author. E-mail: tersb@elsenburg.com

