


Serviços Personalizados
Artigo
 Inglês (pdf)
 Artigo em XML
 Referências do artigo
Indicadores

Links relacionados
-
 Citado por Google
 -
 Similares em Google
Compartilhar

 Permalink
South African Journal of Animal Science
versão On-line ISSN 2221-4062
versão impressa ISSN 0375-1589
S. Afr. j. anim. sci. vol.33 no.1 Pretoria 2003
Evaluation of the growth parameters of six commercial crossbred pig genotypes 1. Under commercial housing conditions in individual pens
N.S. Ferguson#; S.T. Kyriazis
Animal and Poultry Science, School of Agricultural Sciences and Agribusiness, University of Natal, Private Bag X01, Scottsville 3209, South Africa
ABSTRACT
Simulation modelling is an active part of animal nutrition, which relies on mathematical functions to predict the performance of an animal. The Gompertz equation is one such function that is simple, but fits animal growth data well and when used in conjunction with allometry, can accurately predict the potential growth of an animal. When using this approach only three parameters are needed to sufficiently describe a genotype, viz. an estimate of mature size (protein weight at maturity - Pm), a rate of maturing (B) and an estimate of fatness (lipid:protein ratio at maturity - LPRm). The objective of this study was to estimate these parameters in South African commercial crossbred pigs under commercial environmental conditions. Thirty pigs each from six commercial genotypes were analysed using a serial slaughter method in which pigs were slaughtered at four and 14 days of age, and at 30, 40, 70, 80, 90 and 100 kg live weight. The animals were fed a choice between a high and low protein food and were housed in individual pens in two conventional open-sided housing facilities. The results indicated that there were no significant differences in mature weights or B of the various body chemical components between genotypes. This would support the use of a common set of growth parameters (B, Pm and LPRm of 0.0114±0.0005 /d, 40.0±1.86 kg, and 1.77+0.213 kg lipid/kg protein, respectively), inclusive of all commercial crossbred male pigs. However, the rate body lipid matures was significantly lower than the rate of other components within two genotypes. Evidence for the use of common allometric coefficients to define growth was inconclusive.
Keywords: Pigs, protein growth, Gompertz parameters
Introduction
Growth has traditionally been quantified by measuring the changes in body mass (live weight), various linear body dimensions such as height, hip width and girth (Brody, 1945), or, more recently, changes in the chemical components of the body over time (Emmans, 1988). These measurements can be obtained directly from the animal or alternatively, can be estimated using growth models. A comprehensive theory of growth that can be defined in terms of a series of mathematical functions has been an area of speculation, postulation and research for quite some time (Parks, 1970; Roux, 1974; 1976; Whittemore & Fawcett, 1976; Emmans, 1982; Roux & Kemm, 1981; Parks, 1982). The advent of modelling animal growth has further underlined the importance of functions that predict as accurately and as simply as possible the potential growth of an animal. The variables or parameters defined in these equations have a significant effect on the applicability of a particular model, as does the simplicity of these parameters (Emmans & Kyriazakis, 1999). Most growth functions draw attention to the relationship between live weight and time, irrespective of daily feed intake, but there are those that include the relationship between feed intake over time which have been able to accurately predict growth (Parks, 1970; Roux, 1974; Roux & Kemm, 1981; Parks, 1982). However, where growth is to be predicted as a means to determine voluntary food intake, as described by Ferguson et al. (1994), then these growth functions, by definition, cannot be considered despite their high predictive capacity. As one of the purposes of this study was to estimate parameters that can be used in a simulation model to predict voluntary food intake and nutrient requirements in commercial crossbred pigs, attention will be given to the Gompertz (1825) function, a live weight-time based function.
The Gompertz (1825) equation is probably one of the most well known equations describing growth, and can be described in the following form:
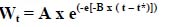
Where Wt = live weight at time t (kg)
t* = the point of inflection (days)
or = ln[-ln(W0/A)]/B where W0 = birth weight
A = mature weight (kg)
B = rate of maturing (/day)
The function is sigmoidal in shape, simple and fits a range of growth data well (Kyriazakis & Emmans 1991; Ferguson et al., 1994; Hancock et al., 1995; Gous et al., 1999). It adequately describes the more rapid increase in growth in the early stages of life and the slower decline in growth in the later stages (Whittemore, 1998). The parameters are of an empirical nature and because they have biological meaning, comparisons can be made between different genotypes of animals.
To use the Gompertz function to model animal growth there needs to be an adequate description of the animal. As shown by Ferguson & Gous (1993a) and Emmans & Kyriazakis (1999) three parameters, namely, an estimate of mature size (protein weight at maturity - Pm), a rate of maturing (B) and an estimate of fatness (lipid:protein ratio at maturity - LPRm), are required to accurately predict the potential growth of a pig. Together with allometry it then becomes possible to predict the growth of an animal (Ferguson et al., 1994). Unfortunately, there are few estimates of these growth parameters and the allometric relationships between the body components available for commercial crossbred pigs in South Africa. The objective of this experiment was to estimate these parameters and the allometric coefficients between lipid, moisture and ash weight vs. protein weight for six commercial crossbred South African pig genotypes, using a serial slaughter technique.
Materials and Methods
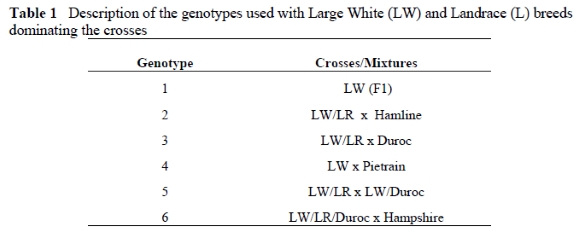
Thirty pigs from each of six commercial pig genotypes were chosen for the purposes of this trial. A description of the genotypes used, is shown in Table 1. All pigs were slaughtered at one of the following live weights or ages: four and 14 days, 30, 40, 70, 80, 90 and 100 kg. These age and weight groups were chosen to facilitate the planned statistical analysis discussed below. There were three piglets slaughtered at four and 14 days of age and four pigs at each of the subsequent weights. Due to insufficient facilities the trial was divided into two periods with three randomly selected genotypes grown in each trial period.
On arrival piglets were approximately eight weeks of age and were dewormed with a treatment of macro-cyclic lactones (Dectomaxtm) before being randomly placed into pens. Pigs were housed individually in pens of either approximately 2 m2 or 7 m2. The buildings were open-sided to allow free airflow, but had an insulated ceiling to minimise the fluctuation in ambient temperature. Each pen was furnished with two feeder bins (Big Dutchman) positioned side-by-side in order to facilitate the choice-feeding regime.
Animals were fed according to a choice feeding program. Two isoenergetic diets containing either a high (HP) or a low (LP) level of crude protein respectively were fed at the same time, thus allowing the pigs to satisfy their crude protein requirements for maximum protein growth (Bradford & Gous, 1991a,b; Kyriazakis & Emmans, 1991). Vitamins and minerals were included at 1.5 times the prescribed level recommended by the suppliers to ensure they were not limiting. The amino acids were balanced according to the ideal protein balance (Wang & Fuller, 1989).
The feeding of the pigs was divided into two phases to more closely meet the requirement of the growing animal. The first phase was from arrival to 40 kg live weight (W-40) and the second from 40 to 100 kg (40-100). In total eight feeds over the two trial periods were produced and samples were analysed using standard AOAC (1984) techniques. A description of the diets and the results of the chemical analyses are shown in Table 2. All feeds were offered on an ad libitum basis and each animal underwent a six-day training period, as described by Bradford & Gous (1991a). Water was supplied by means of drinker nipples, one or two per pen depending on pen size.
The animals were randomly divided into six slaughter groups excluding the two slaughter groups at the beginning of the trial, i.e. at four and 14 days. The animals were weighed on a weekly basis in order to determine their weight gain and nearness to their respective slaughter weight. On reaching their slaughter weight animals were killed either by means of a lethal intra-cardial injection of sodium-pentobarbitone (Euthanase) if they weighed 40 kg or less, or by exsanguination at the local abattoir if over 40 kg. The whole bodies of the animals killed by lethal injection were individually sealed in plastic bags and chilled at 10 °C overnight. The gastro-intestinal tract (GIT) was removed, weighed and flushed in order to determine gut fill. The empty body and washed digestive tract were then minced twice before sampling.
When slaughtered at the abattoir, blood was caught and sealed in plastic buckets. The viscera was collected and sealed in large plastic bags. The GIT was weighed and flushed before being weighed again to determine gut-fill. The viscera and blood were minced together and halved by weight. Unfortunately there was a 24 h delay period in retrieving the half carcasses from the abattoir due to abattoir regulations. During this time the hot carcasses were chilled at 0 oC, which may have led to some water loss from the carcass. However, according to Lawrie (1985) this would have been a loss of water of less than 1.5%. The half carcasses were cut up and minced twice together with the blood-viscera mixture before sampling.
Proximate analyses were performed on all samples according to the AOAC (1984). Moisture content was determined by freeze-drying the samples for 48 h. The dried samples were then subjected to bomb-calorimetry in order to determine gross energy. Protein content was calculated as N x 6.25, where N content of the dry matter was determined using the Dumas Combustion method in a Leco Nitrogen Analyser. The ash content was determined after incineration of the sample at 550 °C for six hours. Lipid content was calculated using an equation derived from previously analysed carcasses (Whittemore et al., 1976; Ferguson et al., 2000). After each sample was chemically analysed in triplicate, the results were pooled to give a single value per sample.
The data from the two periods were blocked and tested for significant differences. The fit-non-linear procedure in Genstat 5 (1997) was used to fit the Gompertz function to determine B and mature weights for protein, lipid, water and ash. To determine the relationship between body components the allometric function Y = aXb , as proposed by Huxley (1924), was used. The allometric constant (a)and exponent (b) were calculated by regressing the logarithmic weights of lipid, water and ash against that of protein weight. The intercept of this regression was then anti-logged to get 'a' while the slope provided the estimate of 'b'. Lipid, water and ash to protein ratios at maturity (LPRm, WAPRm, and APRm respectively) were calculated by dividing the component weights at maturity with the protein weight at maturity. Comparisons of the growth parameters and allometric coefficients between and within genotypes were done by means of the Student t-test using pooled estimates of standard error of the difference of means to determine significant differences.
Results
There were no significant differences between trial periods and therefore all six genotype data could be compared together. All parameters (B and mature weight) for protein, lipid, water and ash across the six genotypes are shown in Table 3. There were no significant differences between the various genotypes across all body components, but Blipid was significantly (P < 0.05) lower than the other components within Genotypes 2 and 5. The coefficients of variation of B did not exceed 11% while the estimates of the mature weight values were more variable, especially lipid (CV = 30%).
Figure 1 illustrates how closely the Gompertz function fits actual data, using protein weight of the two genotypes (Genotypes 1 and 5) that have the largest differences between parameters, as an example.
The lipid (LPRm), water (WAPRm) and ash (APRm) weights relative to protein weight at maturity of the six genotypes and their means are shown in Table 4. The APRm ratios remained relatively constant across genotype at a mean value of 0.22±0.01. Pigs from Genotypes 2 and 5 showed higher LAPRm values than the mean. Similarly, Genotypes 3, 5 and 6 had higher WPRm values.
The allometric constants and exponents relating lipid (alipid, blipid), water (awater, bwater) and ash (aash, bash) weights to that of protein are presented in Table 5. There were significant differences in the allometric exponents between genotypes, but there were no trends. For example, Genotype 5 and 6 had significantly different blipid exponents but similar bwater and bash exponents.
Discussion
The results suggest that there were strong similarities in growth parameters between the genotypes. This is possibly due to the six genotypes being of similar composites of the Large White breed. The absence of statistically significant differences in the mature size, rate of maturing and degree of fatness between the genotypes suggests that there are no differences in potential protein growth between the six genotypes and therefore in the growth of the empty body expected from these animals (Whittemore, 1998). However, it may be argued that real differences do exist between genotypes, but because of the high variability these differences are not statistically different. Using more replications may have reduced the variability and improved the accuracy of the comparison. Notwithstanding this argument, the data suggests that at least some of the genotypes have similar B and mature size values (e.g. Genotypes 1, 4 and 6). Within each genotype the estimation of B was similar for all body components except in the case of Genotypes 2 and 5. Within these genotypes only lipid had a significantly lower B value than the other components. Given that the mature weight, estimated by fitting data to the Gompertz function and the rate of maturing, are negatively correlated (Emmans, 1988), it is possible that Lm for Genotypes 2 and 5 were too high, resulting in a lower Blipid estimate. This correlation is a shortcoming attributable to the fitting the Gompertz function. For the remaining genotypes the assumption of a common rate of maturing for all body components appears to hold true (Emmans, 1981). This assumption is the cornerstone of nutritional models that use the Gompertz function and its parameters to predict the potential growth of the animal. If this assumption was incorrect, a model using the Gompertz function to predict growth would require B values for every body chemical component, thus making the description of genotypes and the simulation modelling of growth more complicated. However, with similarities among genotypes, the differences in growth performance observed on farms between similar genotypes could be attributable to different management, environmental and nutritional conditions. Larger emphasis should, therefore, be placed on the latter conditions in which these animals are grown when trying to predict growth and nutritional requirements for different farms.
Although there were no differences in estimates of mature protein weight and B, the variations were higher than estimates of variation made for a population by Knap (2000). Knap (2000) showed CV estimates of 7% and 3% for mature protein weight and B respectively, whereas the values from Table 3 are 14.3% and 6.6%, respectively. The weights of the lipid fraction at maturity showed a higher variation (CV = 30%) than any of the other parameters (Table 3). This was to be expected, given that the lipid fraction of the chemical body is the most variable component (Susenbeth & Keitel, 1988; Kyriazakis et al., 1991; Kyriazakis et al., 1994). The main reasons for the variation in the lipid fraction of the body include: (1) Environment, specifically temperature, and its effect on energy intake (Ferguson et al., 2000); (2) Feeding method and the balance of nutrients provided (Kyriazakis & Emmans, 1992a,b); (3) Genotype, in terms of maturity type and selection pressure exerted on growth rate and the inherent differences between individual animals within a certain genotype (Kyriazakis et al., 1994) and (4) Interactions between the environment, nutrition and genotype (Ferguson et al., 2000). The first factor is unlikely to have played a large role as the environmental conditions were the same for all pigs. However, the method of feeding, namely choice feeding (Rose & Kyriazakis, 1991) and the genotype seem to have been responsible for most of the variation in lipid growth between the individually penned animals. With only four pigs per slaughter group the effect of an incorrect choice and subsequent fattening can distort the final lipid weight. It would, therefore, appear that the main source of variability in lipid content was a result of the interaction between individuals within certain genotypes and the choice feeding method.
Genotypes 1 and 4 had lower than average estimates of LPRm while Genotypes 2 and 5 had higher values. It would appear from Tables 3 and 5 that the higher than average estimates of LPRm, WPRm and APRm in Genotype 5 were a consequence of a low Pm while for Genotype 2 it was a high Lm relative to Pm.
Due to the similarities in growth parameters it is likely that a single estimate of B and the mature components will suffice in describing the growth potential of commercial crossbred male pigs grown in South Africa. The results are presented in Table 6.
A comparison of the growth parameters estimated for commercial crossbred pigs in South Africa and those published in the literature are presented in Table 7. The estimates of Knap (2000) show a higher B and a lower Pm value in comparison to the other estimates. Bearing in mind that the values given by Knap (2000) are predictions of expected values for 2005, they contradict the prediction of Emmans & Kyriazakis (1999) that there is expected to be an increase in Pm over time. The value of B predicted by Knap (2000), however, shows an increase over time and would therefore imply higher protein growth rates and leaner pigs in the future. Comparing the results from the current experiment with the estimates given by Ferguson & Gous (1993b) indicates a possible genetic improvement over the last nine years in South Africa with current commercial crossbred male pigs having a slightly higher mature protein weight, but lower levels of fat and a higher rate of maturing.
Trait selection will, over time, change the mean values of the Gompertz parameters (Emmans & Kyriazakis, 1999). Mature protein weight along with B is expected to increase, while LPRm is expected to decrease with selection. According to Emmans & Kyriazakis (1999) the age or stage of growth at which selection takes place will affect the parameters differently. Early selection will affect the B value and later selection will affect the Pm, whereas selection at any weight against fatness will decrease LPRm. As genotypes are either fat or lean, there will be no direct relationship between Pm and LPRm. There is, however, a correlation between LPRm and B, as animals are lean at birth and get fatter as they mature. There is also a negative correlation between Pm and B, but this is an inherent characteristic of the Gompertz function rather than a biological phenomena (Emmans 1988). Knap (2000) investigated the time trends in the Gompertz parameters and reported that although pig genotypes have become leaner, the mature body size and thus Pm, have remained unchanged for commercial crossbred pigs. This is most likely a result of only selecting against fat at slaughter rather than for higher Pm. Furthermore, Knap (2000) indicated that both B and LPRm have shown a response to selection over time. This was also observed when the parameters of the current experiment were compared with those of a similar genotype reported by Ferguson & Gous (1993b). Selection against fatter animals at a given age will decrease LPRm and may, to a lesser extent increase Pm.
Although there were differences in the allometric constants and exponents between genotypes, these were small (CV's < 5%) with no discernable patterns in the differences. Despite there being differences in the allometric coefficients, these were sufficiently small to use mean values for comparative purposes. A comparison between values obtained in this experiment and values from the literature is presented in Table 8.
The mean value for blipid was 1.18 (s.e. ±0.05) which was lower than the values presented by Tullis (1981) (b = 1.84) and Doorenbal (1972) (b = 1.66), suggesting that although lipid is still growing relatively faster than protein in the current pigs, they are leaner than the pigs of Doorenbal (1972) and Tullis (1981). This supports the proposal by Knap (2000) that pigs are getting leaner with time.
The allometric coefficient for water (bwater) in this study was on average 0.875±0.005, which was lower than the value determined by Moughan et al. (1990) (b = 0.925), but higher than that reported by Emmans & Kyriazakis (1995) (b = 0.855). Whether these differences are significant or specific to South African breeds is difficult to ascertain given the dangers of using a limited set of data to extrapolate to all genotypes. However, the values are within an acceptable range (6%) of other published values. The estimate for bash is not significantly different from 1.0, which confirms that ash grows at a constant (0.19-0.20) relative rate as protein (Emmans & Fisher, 1986).
There were a number of possible sources of variation and error within the experiment that could have affected the results. Firstly, only four animals were used per slaughter group, which could have led to increased variation and possibly skewed means. More replications per treatment could also have lessened the variations caused by using choice feeding. Unfortunately due to the capacity of the facilities no more than four pigs per slaughter group could be accommodated. Secondly, no slaughters were performed at heavier weights (>100 kg) because of space limitations. This could have affected the accuracy of determining B and mature component weights because observations closer to mature size will have a larger influence on the outcomes of fitting the Gompertz function. Knap (2000) suggested that slaughter trials should continue up to a weight of at least 175 kg. Despite these shortcomings there are indications that when determining nutrient requirements crossbred pigs appear to be similar, and that using a common set of growth parameters will provide a reasonable prediction of growth in practice.
Conclusion
For all practical purposes there appear to be no differences in the growth parameters between the genotypes and, therefore, a common set of growth parameters can be considered to describe the growth of male commercial crossbred pigs in South Africa. However, the same cannot be said of the allometric relationships between protein weight and lipid, water and ash weight, where the results were too variable and inconclusive.
Acknowledgments
The authors wish to thank V.W. Manqele and O.J. Kambula at the pig section of the University Research farm, D. Davies, M. Ferreira, M. Hundley and S. Opperman for their technical assistance. This work was supported by grants from the Protein Research Trust and University of Natal Research Fund.
References
AOAC, 1984. Official methods of analysis (14th ed.). Association of Official Analytical Chemists, Inc., Washington, DC, USA. [ Links ]
Bradford, M.M.V. & Gous, R.M., 1991a. The response of growing pigs to a choice of diets differing in protein content. Anim. Prod. 52, 185-192. [ Links ]
Bradford, M.M.V. & Gous, R.M., 1991b. A comparison of phase feeding and choice feeding as methods of meeting the amino acid requirements of growing pigs. Anim. Prod. 52, 323-330. [ Links ]
Bridges, T.C., Turner, L.W., Smith, E.A., Stahley, T.S. & Loewer, O.J., 1986. A mathematical procedure for estimating animal growth and body composition. Trans. Am. Soc. Agric. Eng. 29, 1342-1349. [ Links ]
Brody, S., 1945. Bioenergetics and Growth. Reinhold, New York. [ Links ]
Doorenbal, H., 1972. Growth, development and chemical composition of the pig: (2) Fatty tissue and chemical fat. Growth 36, 185-194. [ Links ]
Emmans, G.C., 1981. A model of the growth and feed intake of ad libitum fed animals, particularly poultry. In: Computers in animal production, Occ. Publ. No. 5. Eds. Hillyer, G.M., Whittemore, C.T. & Gunn, R.G., Brit. Soc. Anim. Prod., London. pp. 103-110. [ Links ]
Emmans, G.C., 1988. Genetic components of potential and actual growth. In: Animal breeding opportunities, Occ. Publ. No 12. Brit. Soc. Anim. Prod., London. pp. 153-181. [ Links ]
Emmans, G.C. & Fisher, C. 1986. Problems in nutritional theory. In: Nutrient requirements of poultry and nutritional research. Eds. Fisher, C. & Boorman, K.N., Butterworths, London. pp. 9-39. [ Links ]
Emmans, G.C. & Kyriazakis, I., 1995. A general method for predicting the weight of water in the empty bodies of pigs. Anim. Sci. 61, 103-108. [ Links ]
Emmans, G.C. & Kyriazakis, I., 1999. Growth and body composition. In: A Quantitative biology of the pig. Ed. Kyriazakis, I., CABI-Publishing, Willingford. pp. 181-197. [ Links ]
Emmans, G.C. & Oldham, J.D., 1988. Modelling the growth and nutrition in different species. In: Modelling livestock production systems. Eds. Karver, S. & van Arendonk, J.A.M., Kluwer Academic Publishers, Dordrecht. pp. 13-21. [ Links ]
Ferguson, N.S. & Gous, R.M., 1993a. Evaluation of pig genotypes: (1) Theoretical aspects of measuring genetic parameters. Anim. Prod. 56, 233-243. [ Links ]
Ferguson, N.S. & Gous, R.M., 1993b. Evaluation of pig genotypes: (2) Testing experimental procedure. Anim. Prod. 56, 245-259. [ Links ]
Ferguson, N.S., Gous, R.M. & Emmans, G.C., 1994. Preferred components for the construction of a new simulation model of growth, feed intake and nutrient requirements of growing pigs. S. Afr. J. Anim. Sci. 24, 10-17. [ Links ]
Ferguson, N.S., Arnold, G.A., Lavers, G. & Gous, R.M., 2000. The response of growing pigs to amino acids as influenced by environmental temperature. Anim. Sci. 70, 287-297. [ Links ]
Genstat, 1997. Genstat 5 release 4.1 Reference manual. Claredon Press, Oxford. [ Links ]
Gompertz, B., 1825. On the nature of the function expressive of the law of human mortality and on a new method of determining the value of contingencies. Phil. Trans. Royal Soc. 115, 513-585. [ Links ]
Gous, R.M., Moran, E.T., Stilborn, H.R., Bradford, G.D. & Emmans, G.C., 1999. Evaluation of the parameters needed to describe the overall growth, the chemical growth, and the growth of feathers and breast muscles of broilers. Poult. Sci. 78, 812-821. [ Links ]
Hancock, C.E., Bradford, G.D., Emmans, G.C. & Gous, R.M., 1995. The evaluation of the growth parameters of six strains of commercial broiler chickens. Br. Poult. Sci. 36, 247-264. [ Links ]
Huxley, J.S., 1924. Constant differential growth-ratios and their significance. Nature 114, 895-896. [ Links ]
Knap, P., 2000. Variation in maintenance requirements of growing pigs in relation to body composition: A simulation study. PhD thesis, Wageningen University, Netherlands [ Links ]
Kyriazakis, I., Dotas, D. & Emmans, G.C., 1994. The effect of breed on the relationship between feed composition and the efficiency of protein utilization in pigs. Br. J. Nutr. 71, 849-859. [ Links ]
Kyriazakis, I. & Emmans, G.C., 1991. Diet selection in pigs: dietary choices made by growing pigs following a period of underfeeding with protein. Anim. Prod. 52, 337-346. [ Links ]
Kyriazakis, I. & Emmans, G.C., 1992a. The effects of varying protein and energy intakes on the growth and body composition of pigs. 1. The effects of energy intake at constant, high protein intake. Br. J. Nutr. 68, 603-613. [ Links ]
Kyriazakis, I. & Emmans, G.C., 1992b. The effects of varying protein and energy intakes on the growth and body composition of pigs. 2. The effects of varying both energy and protein intake. Br. J. Nutr. 68, 615-625. [ Links ]
Kyriazakis, I. & Emmans, G.C., 1999. Voluntary food intake and diet selection. In: A quantitative biology of a pig. CABI-Publishing, Willingford pp. 229-248. [ Links ]
Kyriazakis, I., Emmans, G.C. & Whittemore, C.T., 1991. The ability of pigs to control their protein intake when fed in three different ways. Physiol. Behav. 50, 1197-1203. [ Links ]
Lawrie, R.A., 1985. Meat science (4th ed). Pergamon Press, Oxford. [ Links ]
Moughan, P.J., Smith, W.C. & Stevens, E.V.J., 1990. Allometric growth of the chemical body components and several organs in the pig (20-90 kg liveweight). N. Z. J. Agric. Res. 33, 77-84. [ Links ]
Parks, J.R., 1970. Growth curves and the physiology of growth. I. Animals. Am. J. Physiol. 219, 833-836. [ Links ]
Parks, J.R., 1982. A theory of feeding and growing in animals. Springer-Verlage, Berlin, Germany. [ Links ]
Rose, S.P. & Kyriazakis, I., 1991. Diet selection of pigs and poultry. Proc. Nutr. Soc. 50, 87-98. [ Links ]
Roux, C.Z., 1974. The relationship between growth and feed intake. Agroanimalia 6, 49-52. [ Links ]
Roux, C.Z., 1976. A model for the description and regulation of growth and production. Agroanimalia 8, 83-94. [ Links ]
Roux, C.Z. & Kemm, E.H., 1981. The influence of dietary energy on a mathematical model for growth, body composition and feed utilization of pigs. S. Afr. J. Anim. Sci. 11, 255-268. [ Links ]
Susenbeth, A. & Keitel, K., 1988. Partition of whole body protein in different body fractions and some constants in body composition in pigs. Livestock Prod. Sci. 20, 37-52. [ Links ]
Tullis, J.B., 1981. Protein growth in pigs. PhD thesis, University of Edinburgh, UK. [ Links ]
Von Bertalanffy, L., 1938. A quantitative theory of organic growth [inquiries on growth laws (2)] Hum Biol. 10, 181-213. [ Links ]
Wang, T.C. & Fuller, M.F., 1985. The optimum dietary amino acid pattern for growing pigs. (1) Experiments by amino acid deletion. Br. J. Nutr. 62, 77-89. [ Links ]
Whittemore, C.T., 1998. The science and practice of pig production (2nd ed.), Longmann Scientific and Technical, Essex, UK. [ Links ]
Whittemore, C.T. & Fawcett, R.H., 1976. Theoretical aspects of a flexible model to simulate protein and lipid growth in pigs. Anim. Prod. 22, 87-96. [ Links ]
Whittemore, C.T., Moffat, I.W. & Taylor, A.G., 1976. Evaluation by digestibility, growth and slaughter of microbial cells as a source of protein for young pigs. J. Sci. Food Agric. 27, 1163-1170. [ Links ]
# Corresponding author. E-mail: ferguson@nu.ac.za

