


Services on Demand
Article
 English (pdf)
 Article in xml format
 Article references
Indicators

Related links
-
 Cited by Google
 -
 Similars in Google
Share

 Permalink
South African Journal of Agricultural Extension
On-line version ISSN 2413-3221
Print version ISSN 0301-603X
S Afr. Jnl. Agric. Ext. vol.51 n.1 Pretoria 2023
http://dx.doi.org/10.17159/2413-3221/2023/v51n1a11914
ARTICLES
Baseline Study of Soil Nutrient Status in Smallholder Farms in Limpopo Province of South Africa
Mokgolo M.J.I; Mzezewa J.II
ILecturer, Department of Plant Production, Tompi Seleka College of Agriculture, Private Bag X9619, Marble Hall, 0450, South Africa. matomej.josphistos19@gmail.com, ORCHID: https://orcid.org/0000-0001-9528-2263
IISenior Lecturer, Department of Soil Science, University of Venda, Private Bag X5050, Thohoyandou, 0950, South Africa. Jestinos.Mzezewa@univen.ac.za
ABSTRACT
An assessment of soil nutrient status based on farmers' samples was carried out in the Capricorn, Sekhukhune, and Waterberg Districts of the Limpopo Province of South Africa. A total of 336 soil samples were collected and analysed for pH, phosphorus (P), potassium (K), calcium (Ca) and magnesium (Mg). The results showed that the pH of more than 80% of the submitted soil samples was suitable for the production of most field crops ,while less than 20% required liming to make them productive. Phosphorus levels were very low (<8 mg kg-1), with most soils (>95%) needing P fertilisation to improve crop yields. Potassium was adequate (>250 mg kg-1) for most districts' crops. Between 70% and 74% of soils from Sekhukhune and Waterberg Districts were deficient in Ca (<200 mg kg-1). Magnesium was adequate (>300 mg kg-1) in more than 60% of the analysed samples. Apart from soil pH, all soil properties showed a high degree of variability across all districts. Further studies are needed to investigate the role of field management, crop rotation, field position in the landscape, lithology, and socioeconomic conditions of the farmer on the observed trends of soil nutrients.
Keywords: P Deficiency, Smallholder, Soil analysis, Soil fertility.
1. INTRODUCTION
Food production in sub-Saharan Africa (SSA) depends on the soil's capacity to provide nutrients to the growing plants (Smaling et al., 1997). However, research has shown that the soil in the region is increasingly showing signs of physical and chemical degradation and cannot support crop production (Smaling et al., 1997; Sanchez et al., 1997). Therefore, low soil fertility in SSA is a major contributor to low food production (Sanchez et al., 1997). This is against the ever-increasing human population in SSA that largely depends on agriculture for livelihood (Chikowo et al., 2014). Despite contributing 90% of food production in the region, smallholder farmers, also called small-scale farmers, occupy the least productive lands (Wiggins, 2009). This is due to the historical patterns of racial land dispossession and impoverishment, which systematically eroded successful land-based production systems and livelihoods in South Africa (Neves & Du Toit, 2013). Therefore, food sufficiency remains a pipe dream if farmers continue to depend on soils with low nutrient status for crop production. Like the rest of SSA region, the productivity of cropping systems in the smallholder agricultural sector in southern Africa is curtailed by low soil nutrient status (Snapp, 1998).
In their review of soil fertility status in South Africa, Barnard and du Preez (2004) stated that soil fertility was generally low. Soil acidification was identified as the most important cause of declining soil fertility, especially in high-rainfall regions. Nitrogen levels are low and often associated with low (<1%) soil organic carbon content typical of South African soils (Du Preez et al., 2011). Previous studies indicated that phosphorus (P) was deficient in most South African soils (Van Niekerk, 1989). Van Biljon (2010) reported that the potassium (K) levels in maise-producing areas were above the K threshold values. This is because very little K is removed by grain annually due to low grain yields. However, there is inadequate information about the smallholder farming sector.
The smallholder farmers are based in the former homeland areas (Kirsten and Van Zyl, 1998). In the Limpopo Province, smallholder farming occupies approximately 30% of the provincial land surface area (Oni et al., 2003). Smallholder farmers utilise low-level production technology and mainly produce for subsistence (Whitbread et al., 2011; Oni et al., 2003). The low productivity of smallholder agriculture is attributed to poor access to production resources. Lack of money for soil analysis and recommendations results in incorrect fertiliser inputs and, consequently, low crop yields (Baiphethi & Jacobs, 2009). For instance, maise yields of less than 0.5 t ha-1 are common (FAO, 2019).
However, the Limpopo Department of Agriculture and Rural Development (LDARD) introduced advisory support services to develop and strengthen the capacity of smallholder farmers. The department offers subsidised soil analysis and smallholder farmer training (LDARD, 2017). They regularly train extension advisors on the appropriate soil fertility and management strategies that smallholder farmers could adopt to improve crop yields and enhance income. Through this project, hundreds of farmers have submitted their soil samples for nutrient analysis, resulting in a large database in the province. This article provides an overview assessment of the soil nutrient status of smallholder farms based on analysed soil samples from the Capricorn, Sekhukhune, and Waterberg districts of the Limpopo Province. A better understanding of soil nutrient status will help design correct fertiliser programmes. This article will also be foundational for further soil fertility studies in the province.
1.1. Study Approach and Assumptions
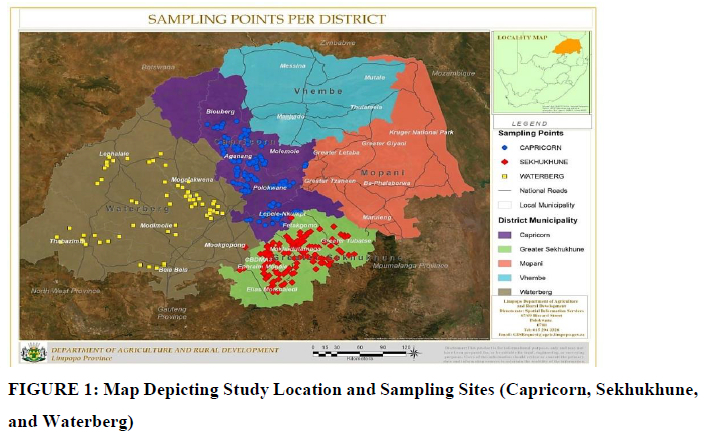
The study was based on soil samples analysed by the Tompi Seleka Agricultural College covering the districts of Capricorn, Sekhukhune, and Waterberg (Figure 1). In evaluating soil fertility, general guidelines for soil pH and nutrients in South Africa were followed (FERTASA, 2016). The assumption was that the submitted soil samples would represent the general soil fertility conditions from the three districts in the Limpopo Province. The soil samples were collected from the farm fields on request. The study also considered the data set of pH, K, Ca, Mg and P. Except for N and organic carbon, which were not determined in this study, these are the most critical soil properties influencing crop yield.
2. METHODOLOGY
2.1. General Description of the Study Area
The study was carried out in the years 2015, 2016, and 2017 in the Capricorn, Sekhukhune, and Waterberg districts of the Limpopo Province, located in the northern-most part of South Africa (Figure 1). The three districts occupy a total surface area of 80 146 km2 of 125 755 km2 or 64% of the Limpopo Province. Most of the population resides in the rural areas where maise crop is mainly cultivated, followed by sunflower, sorghum, millet, watermelon, cowpeas, and groundnut under dryland conditions. Some smallholder farmers cultivate vegetables such as beetroot, butternut, tomato, onion, spinach, and cabbage in addition to the field crops (Oni et al., 2003; Manicus, 2009; Rankoana, 2016). In 2016, there were nearly 232,000 smallholder farmers in the Limpopo Province (Statistics SA, 2016). The Capricorn District has 104 116, Sekhukhune has 86 046, and Waterberg has 41 810 (DRDLR, 2016a; DRDLR, 2016; DRDLR, 2016c).
Topography, soil, and climate are the major determinants of the area's agricultural potential. The underlying geology of the Capricorn District is medium-grained, yellowish, laminated sandstone. It is also characterised by granite, biotite granite-gneiss, pegmatite, lava, and pyroclasts. The soils are characterised by grey iron-containing lateritic soil types formed over the granite. These are sandy or gravel in texture and usually contain a hard -containing the hardpan's bottom layer. In certain areas, the region also has non-leached, black clay soil, while to the west, light brown sandy soil of the Waterberg Sandstone and Lime deposits occur. The escarpments are also characterised by the round granite mounds formed by the intrusion of younger granites. The Capricorn district lies in the summer rainfall region and has a warm climate. The district's mean maximum (36.5oC) and minimum (0.8oC) temperatures occur during December and June, respectively. The mean annual precipitation for the district ranges from 400 - 500 mm, where the most rain falls between October and March, and the peak period is in December/January. Rainfall between May and September is generally low, and the average precipitation rate for June to August is 4.6 mm (DRDLR, 2016a).
The geology of the Sekhukhune District consists of the Eastern Bushveld and Springbok flats region. The overall geology of the area is classified as Gabbro, Anorte band, Clinopyroxenite, and Arenite. The district has heavy metal soils derived from predominantly pyroxenite, norite, and anorthosite formations. The Sekhukhune District Municipality is typical of the Savanna Biome: warm, moist summers and cool, dry winters. The average maximum temperature in summer is 23°C, and the minimum is 18°C. In winter, the average temperature is 13.5°C, and the minimum is 7°C. The mean annual precipitation for the district ranges from 500 - 700 mm (DRDLR, 2016b).
The major geological formations in the Waterberg District include the arenite in the southern portion of the municipality, gneiss and sedimentary formations, which affect the rural area, and shale, which affects the eastern part of the district. Diverse soil types characterise the Waterberg region. These include weakly developed soils on mountainous catchments, uplands, and rocky areas, dystrophic, red and yellow, freely draining sandy soils, and plinthic upland duplex and para-duplex soils. Rainfall in the district averages between 400mm and 650mm per year, with most rainfall occurring mainly during mid-summer. The northern and western regions of the Waterberg District experience a hot and semi-arid climate. The southern and eastern regions are more humid and slightly cooler. The district's temperature varies from a maximum of 33oC in summer months to around 2oC in winter (DRDLR, 2016).
2.2. Soil Sampling and Analyses
Where soils were not homogeneous, random and judgmental samplings were used to collect soil samples to obtain a composite representative sample. A total of 115, 164, and 57 soil samples were collected from Capricorn, Sekhukhune, and Waterberg districts, respectively. Farmer's request for sample collection determined the sample size for each district. The soil samples were collected using a soil auger from the farms and homestead gardens of the three districts and were geo-referenced. The soil surface was cleared to remove debris or obstacles before collecting each sample. About eight subsamples per hectare were collected from 0-20 cm on each site. Subsamples from this depth were bulked to approximately 1.5 kg in a polyethylene laboratory sampling bag and taken to the Tompi Seleka Soil and Water Analytical Laboratory. The collected samples were air-dried at room temperature, disaggregated, and sieved through a 2-mm sieve. Physicochemical analyses included particle size distribution, soil pH (water and KCl), exchangeable cations (K+, Ca2+, Mg2+), and available P. The percentage fractions of sand, silt and clay in the soil samples were determined using hydrometer after dispersing with sodium hexametaphosphate (calgon) as described by Van Reeuwijk (2002).
Soil pH was measured in the supernatant suspension of a 1:2.5 (soil: liquid mixture) using a digital electronic pH meter (Multiple-Parameter pH/TDS/EC/Temp. Bench meter). Two portions of 10 g of dried soil (< 2 mm) were mixed with 25 ml deionised water for pH in water or pHw and potassium chloride solution for pH in KCL or pHKCl, each in a separate bottle and stirred for 5 seconds with a glass rod and allowed to stand for 50 minutes before stirring again and taking pH readings of the samples with a calibrated pH meter. Results were recorded as pHw and pHKCl. Available phosphorus (P) was determined by Bray 1 method (Bray & Kurtz, 1945). Potassium (K), Calcium (Ca), and Magnesium (Mg) were extracted in 1M ammonium acetate (NH4OAc) at pH 7, and the exchangeable cations were determined using the Atomic Absorption Spectrophotometer (AAS) (Agilent Technologies 200 Series AA). Descriptive statistics were analysed using MS Excel 2016 version.
3. RESULTS AND DISCUSSION
3.1. Soil Physical Properties
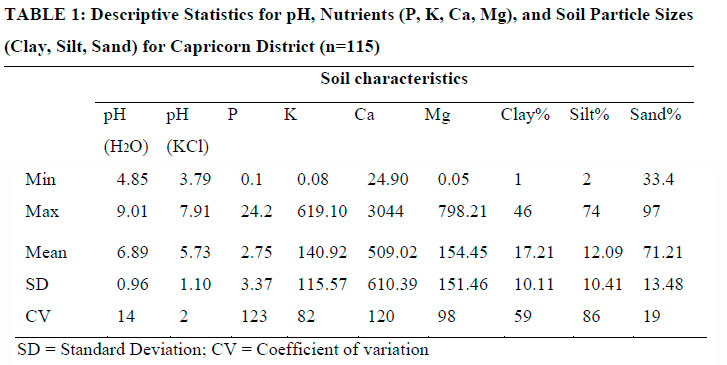
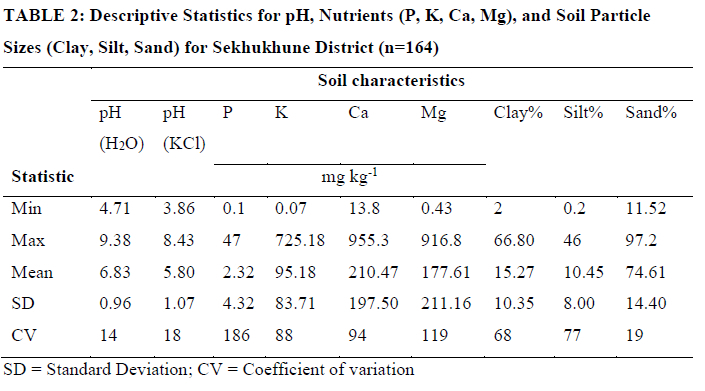
Tables 1, 2, and 3 show descriptive statistics and variation in measured soil properties across the Capricorn, Sekhukhune and Waterberg districts. All the soils had low average clay content (15% - 19%) and high sand content (71% - 75%). Means of silt content were also low and ranged from 7% to 12%. However, some variations in soil fractions were noted. Sand fraction had a low coefficient of variation (CV) (15% - 19%) across the three districts. In contrast, clay and silt fractions in the Capricorn and Sekhukhune districts had high values of CV (59% -86%). However, the Waterberg District had a low clay fraction (6%) (Table 1, 2, 3). Sand fraction had the highest standard deviation across all districts compared to clay and silt fractions. Therefore, on average, the studied soils were classified as sandy loam textures, confirming the dominance of acidic rock parent materials in the study area (Chinoda et al., 2009). Sandy textured soils tend to be excessively drained and low in nutrient content level (Snapp, 1998) due to their low base adsorption (Manicus, 2009). Organic manure and other organic amendments can be applied to improve the soil's physical properties and supplement plant nutrients (Nyamangara et al., 2000; Manicus, 2009).
3.2. Soil pH
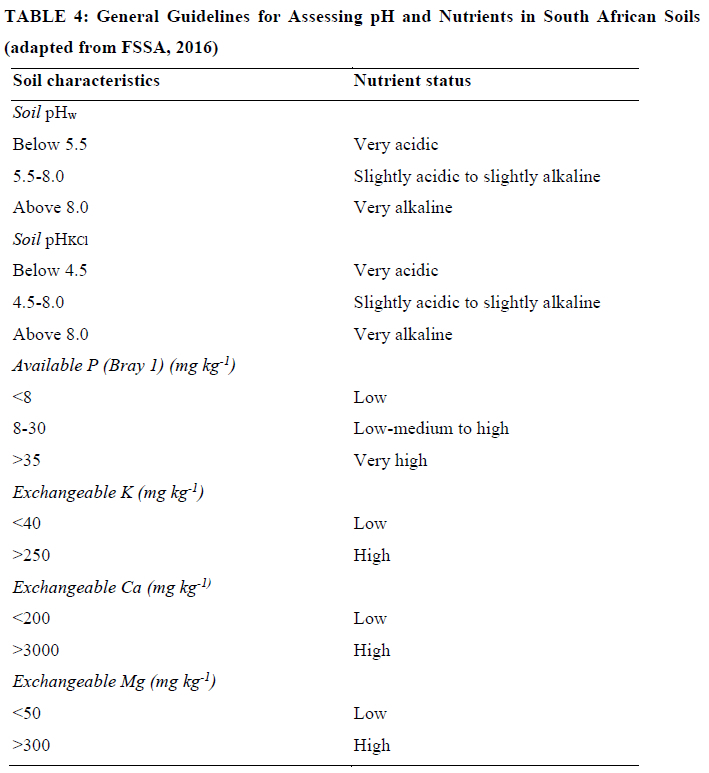
Table 4 shows the standard guidelines for assessing pH and nutrients in South African soils. The means soil pHw (6.33-6.89) and pHkcl (5.25-5.80) for all districts were in the slightly acidic to slightly alkaline range (FERTASA, 2016). In all cases, pH variation was low (CV<20%). Soil pH analyses revealed that most of the soil samples (>90%) from the Capricorn District were in the pH range of slightly acidic to slightly alkaline (Table 5). Few soil samples (>85%) in this pH range were recorded in Sekhukhune and Waterberg Districts (Table 5). This is the pH range suitable for most crops in South Africa (FERTASA, 2016). Between 5 and 10% of samples from Capricorn and Sekhukhune Districts were too acidic (pHw <5.5; pHkcl <4.5) and unsuitable for normal crop production (FERTASA, 2016). Meanwhile, soil samples in this pH range were slightly higher in the Waterberg District at nearly 15% (Table 5). Less than 5%, 10%, and 0% samples from Capricorn, Sekhukhune, and Waterberg Districts, respectively, were too alkaline (pH>8.0) and unsuitable for crop production.
The results suggest that soil pH had no major limitation to crop production in most arable soils of smallholder farms in the three districts. This could be attributed to low rainfall in the area and limited use of reduced nitrogen fertilisers. High rainfall and N fertiliser are two major causes of soil acidification (Banard & Du Preez, 2004). In KwaZulu-Natal Province, soil acidity was found to limit crop production in high rainfall community farming areas of Obonjaneni (mean pHkcl of 4.04) (Roberts et al., 2003) and at Cedara (pHkcl in 0-0.15 m layer of 4.49) (Farina et al., 1983). In Zimbabwe, Nyamangara et al. (2000) reported that 77% of analysed granitic soils from smallholder farmers were unsuitable for crop production due to acidity induced by N fertiliser use and the leaching of bases.
3.3. P Status
Available P was low in all three districts, with P means between 2.32 and 2.75 mg kg-1. The coefficient of variation of P was high for all districts (81% to 186%). Most soils (>90%) from the three districts were acutely deficient in P (<8 mg kg-1) (Table 5) and required P fertilisation to improve crop yields, and a few samples (3% to 5%) from the three districts had low-medium to high (8-30 mg kg-1). These results confirmed previous reports that P limits crop production among smallholder farmers in SSA (Snapp, 1998; Roberts et al., 2003; Kihara et al., 2016). Similar results were obtained in smallholder farms of Lusikisiki in the Eastern Cape Province, South Africa by Buhmann et al. (2006). Nyamangara et al. (2000) reported that 84% of the soil samples from smallholder farmers in Zimbabwe were deficient in resin extractable P (<15 mg kg-1 P2O5), and only 16% had adequate P levels.
3.4. K, Ca, and Mg Status
The coefficient of variation values for all exchangeable bases was high (85%-120%) except K in Waterberg, which had low variation (CV=10%). The high degree of variation could be attributed to differences in inherent soil properties and farmer management practices as observed elsewhere (Zingore et al., 2007). More than 80% of samples from the Capricorn District and three-quarters of samples from the Sekhukhune and Waterberg Districts had adequate K (>250 mg kg-1). This agrees with van Biljon (2010), who reported that K was adequate in most of the South African maise-producing soils, especially under low yields typical of smallholder farms where small amounts of K are removed from the soil. Moreover, the high availability of K could be a result of limited leaching due to low rainfall in the study area (Farina et al., 1983). More than two-thirds of the samples in Sekhukhune and Waterberg Districts were deficient in Ca (<200 mg kg-1) (FERTASA, 2016) compared to about one-third of the analysed samples from the Capricorn District. More than two-thirds of samples from the three districts had adequate exchangeable Mg (>300 mg kg-1) (FERTASA, 2016). However, a low proportion of about one-third of analysed samples from the districts was classified as having low Mg content (<50 mg kg-1). The proportion of samples with low Mg content was almost similar at 34% and 35% for Sekhukhune and Waterberg, respectively. However, that proportion was slightly less than 30% for Capricorn District.
The levels of Ca and Mg are related to soil pH under normal conditions, and their deficiency could be corrected by lime application (Banard & Du Preez, 2004). However, further studies are needed to develop correct recommendations to avoid nutrient imbalances (Van Biljon, 2010). In other studies, Buhmann et al. (2006) reported that 73% of the soils in the high rainfall area of Lusikisiki in the Eastern Cape had adequate Ca levels despite the leaching environment in the study area. This was attributed to the strong association between organic carbon and Ca that could have prevented Ca from leaching away.
4. CONCLUSION
The study evaluated soil fertility status in the Capricorn, Sekhukhune, and Waterberg Districts of the Limpopo Province of South Africa. The study analysed 336 soil samples from small-scale farmers in the three districts. Soil fertility indicators included soil pH (pHw and pHkci), available P, and exchangeable base cations (K, Ca and Mg). All soil properties except soil pH showed large variability across the three districts. This was attributed to individual farmers' diverse geology and soil management practices that could have contributed to a wide range of available nutrients. A large proportion (>80%) of the studied soils had pH suitable for most crops in South Africa. Less than 10% of samples from Capricorn and Sekhukhune Districts, and less than 15% from Waterberg District were too acidic [(pHw<5.5] and required liming to make them productive. When considering the pHKCl scale, less than 15% of samples from Capricorn and Sekhukhune, and about 20% from Waterberg Districts required liming (pHkci<4.5). Soils that were too alkaline [pHw>8.5 pH] to make crop production impossible were less than 10% in Capricorn and Sekhukhune Districts, while Waterberg District had none. Most soil analysed (>90%) was acutely deficient in P, confirming the results of previous studies. Between 4% and 5% of samples from the three districts had low-medium to high available P, meaning that normal P- fertilisation is needed in the studied soils. More than three-quarters of the analysed samples recorded high K levels (>250 mg kg-1). More than two-thirds of samples from Sekhukhune and Waterberg Districts were deficient in Ca, suggesting that the application of Ca was required to improve crop yields. In contrast, only one-third of samples from the Capricorn District were poor in Ca. Generally, more than two-thirds of the soils had adequate Mg contents, while less than a third were deficient in Mg from all three districts, suggesting that applying Mg could be beneficial. The causes of nutrient deficiency and their variability are numerous. To explain the observed trends, further studies are needed to investigate the role of field management, crop rotation, the position of the field in the landscape, lithology, and socioeconomic conditions of the farmer. Such studies may take the form of case studies and field surveys. Therefore, this study forms the foundation for future studies.
REFERENCES
BAIPHETHI, M.N. & JACOBS, P.T., 2009. The contribution of subsistence farming to food security in South Africa. Agrekon., 48(4): 458-482. [ Links ]
BANARD, R.O. & DU PREEZ, C.C., 2004. Soil fertility in South Africa: the last twenty-five years. S. Afr. J. Plant Soil., 21(5): 301-316. [ Links ]
BRAY, R.H. & KURTZ, L.T., 1945. Determination of total organic and available forms of phosphorous in soil. SoilSci., 59: 39-45. [ Links ]
BUHMANN, C., BEUKES, D.J. & TURNER, D.P., 2006. Plant nutrient status of soils of Lusisiki area, Eastern Cape. S. Afr. J. Plant Soil., 23(2): 93-98. [ Links ]
CHIKOWO, R., ZINGORE, S., SNAPP, S. & JOHNSON, A., 2014. Farm typologies, soil fertility variability and nutrient management in smallholder farming in sub-Saharan Africa. Nutr. Cycl. Agroecosyst., 100: 1-18. [ Links ]
CHINODA, G., MOYCE, W., MATURA, N. & OWEN, R., 2009. Baseline report on the Geology of the Limpopo Basin Area. Waternet working paper 7. Amsterdam, Netherlands: WaterNet. [ Links ]
DEPARTMENT OF RURAL DEVELOPMENT AND LAND REFORM (DRDLR)., 2016a. District Rural Development Plan. Capricorn District Municipality Limpopo Province. [ Links ]
DEPARTMENT OF RURAL DEVELOPMENT AND LAND REFORM (DRDLR)., 2016b. District Rural Development Plan. Sekhukhune District Municipality Limpopo Province. [ Links ]
DEPARTMENT OF RURAL DEVELOPMENT AND LAND REFORM (DRDLR)., 2016c. District Rural Development Plan. Waterberg District Municipality Limpopo Province. [ Links ]
DU PREEZ, C.C., VAN HYSSTEEN, C.W. & MNKENI, P.N.S., 2011. Land use and soil organic matter in South Africa 1: A review on spatial variability and the influence of rangeland stock production. S. Afr. J. Sci., 107(5/6): 1-8. [ Links ]
FARINA, M.P.W., CHANNNON, P. & PHIPSON, J.D., 1983. Genotypic differences in the potassium requirements of two maise cultivars. J. Crop Prod., 12: 84-86. [ Links ]
FERTILIZER ASSOCIATION OF SOUTHERN AFRICA (FERTASA)., 2016. Fertilizer Handbook. 7th ed. Lynnwood Ridge, Pretoria, South Africa. [ Links ]
FOOD AND AGRICULTURE ORGANISATION (FAO)., 2019. Drought impact mitigation in the Limpopo Basin. [Viewed 24 June 2019]. Available from www.fao.org/3/y57744e/y5744e0a.htm. [ Links ]
KIHARA, J., NZIGUHEBA, G., ZINGORE, S., COULIBALY, A., ESILABA, A., KABAMBE, V., NJOROGE, S., PALM, C. & HUISING, J., 2016. Understanding variability in crop response to fertiliser and amendments in sub-Saharan Africa. Agric. Ecosyst. Environ., 229: 1-12. [ Links ]
KIRSTEN, J.J. & VAN ZYL, J., 1998. Defining small-scale farmers in the South African context. Agrekon., 37(4): 551-562. [ Links ]
LIMPOPO DEPARTMENT OF AGRICULTURE AND RURAL DEVELOPMENT (LDARD)., 2017. Annual Performance Plan 2018 - 2019. [ Links ]
MANICUS, R.A.F., 2009. Evaluation of Soil Fertility in the Sekhukhune District, South Africa. J. Dev. Sus. Agr., 4: 141-148. [ Links ]
NEVES, D. & DU TOIT, A., 2013. Rural livelihoods in South Africa: Complexity, vulnerability and differentiation. J. Agrar. Chang., 13(1): 93-115. [ Links ]
NYAMANGARA, J., MUGWIRA, L.M. & MPOFU, S.E., 2000. Soil Fertility Status in the Communal Areas of Zimbabwe in relation to Sustainable Crop Production. J Sustain Agr., 16(2): 15-29. [ Links ]
ONI, S.A., NESAMVUNI, A.E., ODHIAMBO, J.J.O. & DAGADA, M.C., 2003. Executive summary of a study of agricultural industry of Limpopo Province. In A.E. Nesamvuni, S.A. Oni, J.J.O. Odhiambo & N.D. Nthakheni (eds.), Agriculture as the cornerstone of the economy of the Limpopo Province. Johanessburg South Africa: Livhu's Printing Enterprises. [ Links ]
RANKOANA, S.A., 2016. Perceptions of Climate Change and the Potential for Adaptation in a Rural Community in Limpopo Province, South Africa. Sustainability., 8: 672 - 682. doi:10.3390/su808067. [ Links ]
ROBERTS, V.G., ADEY, S. & MASON, A.D., 2003. An investigation into soil fertility in two resource-poor farming communities in KwaZulu-Natal (South Africa). S. Afr. J. Plant Soil., 20(3): 146-151. [ Links ]
SANCHEZ, P.A., SHEPHERD, K.D., SOULE, M.J., PLACE, F.M., BURESH, R.J., IZAC, A.N., MOKWUNYE, A.U., KWESIGA, F.R., NDIRITU, C.G. & WOOMER, P.L., 1997. Soil fertility replenishment in Africa: An investment in natural resource capital. In R.J. Buresh, P.A. Sanchez, & F. Calhoun (eds.), Replenishing soil fertility in Africa. Madison: SSSA Special Publications, 1-46. [ Links ]
SMALING, E.M.A., NANDWA, S.M. & JANSSEN B.H., 1997. Soil fertility in Africa is at stake. In R.J. Buresh, P.A. Sanchez, & F. Calhoun (eds.), Replenishing soil fertility in Africa. Madison: SSSA Special Publications. [ Links ]
SNAPP, S.S., 1998. Soil nutrient status of smallholder farms in Malawi. Commun Soil Sci Plan., 29(17&18): 2571-2588. [ Links ]
STATISTICS SOUTH AFRICA., 2016. Community Survey 2016 Agricultural households, Report No. 03-01-05. Pretoria: Statistics South Africa. [ Links ]
VAN BILJON, J.J., 2010. Maise fertiliser research over the last 25 years- a review. S. Afr. J. Plant Soil., 27(1): 32-36. [ Links ]
VAN NIEKERK, A.I., 1989. Opening address: Proceedings of the Phosphorus Symposium, 25 September, Department of Agriculture & FSSA, Pretoria, South Africa. [ Links ]
VAN REEUWIJK, L.P., 2002. Procedures for Soil Analysis. 6th ed. Wageningen, Netherlands: Technical Paper/International Soil Reference and Information Centre. [ Links ]
WHITBREAD, A.M., MACLEOD, N., MCDONALD, C.A., PENGELLY, B., AYISI, K. & MKHARI, J., 2011. Farming systems, emerging farmers and land reform in the Limpopo Province of South Africa. In P. Tow, I. Cooper, I. Partridge, & C. Birch (ed.), Rainfed farming systems, Dordrecht: Springer, 433 - 449. [ Links ]
WIGGINS, S., 2009. Can the smallholder model deliver poverty reduction and food security for a rapidly growing population in Africa? Paper for the Expert Meeting on How to Feed the World in 2050. Rome: FAO. [ Links ]
ZINGORE, S., MURWIRA, H.K., DELVE, R.J. & GILLER, K.E., 2007. Influence of soil management strategies on variability of soil fertility, crop yields and nutrients balances on smallholder farms in Zimbabwe. Agric. Ecosyst. Environ., 119: 112-126. [ Links ]
 Correspondence:
M.J. Mokgolo
Correspondence E-mail: matomej.iosphistos19@gmail.com

