


Services on Demand
Article
 English (pdf)
 Article in xml format
 Article references
Indicators

Related links
-
 Cited by Google
 -
 Similars in Google
Share

 Permalink
South African Journal of Agricultural Extension
On-line version ISSN 2413-3221
Print version ISSN 0301-603X
S Afr. Jnl. Agric. Ext. vol.48 n.1 Pretoria 2020
http://dx.doi.org/10.17159/2413-3221/2020/v48n1a532
ARTICLES
Preparing papers for the South African Journal of Agricultural Extension
Conradie B
Associate professor, University of Cape Town, PBagX3, Cape Town, 7703, Beatrice.conradie@uct.ac.za
ABSTRACT
Successful journal submissions follow a predictable format and vary in length of between 5000 and 6500 words, including references. Formulating well-defined, tight research questions that contribute to an open aspect of the extension literature is essentialfor success. A good question makes it easier to identify appropriate analytical techniques and provide a logical structure to the results section. The most frequently encountered problems with unsuccessful submissions to this journal are the absence of a clear question, flawed research design, papers that are too short and present only a superficial inadequate analysis of descriptive statistics and papers that are front-heavy with an underweight disappointing results section. These problems are easily corrected by closely adhering to academic writing conventions and good research design, which explains why experienced authors have a better chance of success than novices.
Keywords: Academic writing conventions, Improved acceptance rates, Preparing papers, Reasons for rejection, Extension
1. INTRODUCTION
The South African Journal of Agricultural Extension receives hundreds of potential contributions every year from which it selects the sixteen to twenty best efforts to publish. Most of the submissions are written by novice researchers who have little experience of academic writing beyond their masters' theses. Once a person has been accepted into a journal a few times, the chances of having other papers accepted goes up exponentially. For example, during the first decade of one's publication career you only publish one article every other year. People often only reach a paper a year by the second decade of their career, and only get into reputable international journals once their work appeared regularly in local journals. Success has everything to do with following a familiar formula, which can be taught/learnt.
In the period 2018 to 2020, this journal's rejection rate was 74%, which is lower than that of the South African Journal of Science or the African Journal of Agriculture and Resource Economics (90%) and double that of Agrekon (30-40%). Rejected papers represent a substantial wasted effort on behalf of those submitting. More importantly not getting these experiences and insights into print is a loss to the members of South African Society of Agricultural Extension who could benefit from the research results and experiences described.
This is an article on practice. Its purpose is to review the most common reasons for having articles rejected from this journal and to share some practical guidelines on how to improve one's chances of success when submitting here and to other journals like it. Section 2 identifies the main problems with rejected articles. Section 3 describes each of the key elements of an academic article and shares good and bad examples of each component. Section 4 contains some advice on how and where to begin. The approach is descriptive throughout.
2. THE MOST COMMON REASONS FOR REJECTION
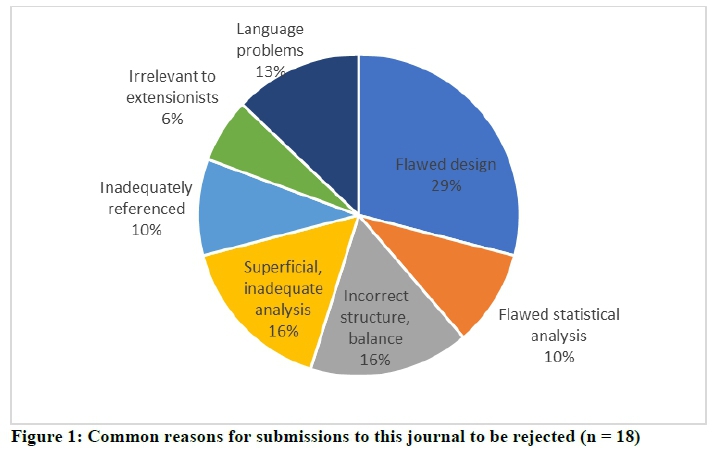
Over the past two years, I have reviewed many submissions to this journal of which the majority were so problematic that they could not be accepted for publication. The same mistakes appear repeatedly, and I made many of them myself when I was a novice writer. The main reasons why these articles were rejected is summarised in Figure 1.
Sometimes an insufficient command of English is the main problem (13%). This is not surprising as many South African authors write in their second or third language. Often the tone in which the paper is written, which linguists refer to as "register", is too ambitious or convoluted. Shorter sentences in everyday English communicate better. Academic writing is always plain so that the facts can speak for themselves. Avoid adjectives as a matter of principle, for example, do not write "extremely severe" when "severe" would do or "vast" when you mean "large" and use "important" rather than "crucial". Simple language is not the same as informal language, which should also be avoided. Examples of this include using contractions like "don't" instead of "do not" and to say a project is "great" when you mean "effective". Avoid acronyms and abbreviations.
The best way to improve one's language skills is to read material written by good writers and to practice a lot. I often completely restart an article halfway through, because for me writing is thinking, and my thinking usually evolves so much while I work on a paper that I often end up with a different argument than the one I set out to produce. In that case starting over is much easier than having to backtrack to correct everything. I have also learnt not to submit an article without having it language edited (or copy edited). A fresh pair of eyes can spot grammatical errors, incorrectly used homonyms (there vs. their) and sentences with missing words in a way that authors are not able to. These silly errors are best kept away from irritable editors.
Although we all struggle with language difficulties, it is not the main reason why papers are rejected from this journal. The most important reason for rejection is a flawed design (29%). A flawed research design covers a myriad of problems, including poorly formulated or vague research questions, a mismatch between the question and method used to answer it, or attempting to answer a valid question with a valid method for which data are not available. Another sure sign of a flawed design is when papers are too short (<4500 words). Other substantive issues include that an article reports on an inadequate analysis (16%) or that it presents with an unacceptable structure (16%). These three flaws are related. A good article begins with a solid analysis of acceptable complexity which is then described according to the accepted format of a journal article in your discipline. Articles that do not adhere to the correct structure are often front heavy and too short. Social scientists, including economists, sociologists and extensionists, have a little more flexibility than people working in the natural sciences who must write according to a very precise formula. The best advice is to get to know the rules in your field. Browse through recent copies of this journal to discover the rules for our field.
According to Trower (0212), between 30-50% of the articles submitted to the Elsevier Journal he edits fail at the first technical hurdle, due to not following the journal's prescriptions, potential plagiarism or writing in incomprehensible English. His second reason for rejecting papers is that they do not belong in the journal he edits, while reason 3 is that the paper does not do full justification to the field to which it contributes or the question at hand. This links to the problems of flawed design and inadequate referencing raised above. Reasons 4 and 5 links to the process of analysis, which is using a flawed methodology or drawing unjustified conclusions. Reason 6 is that the paper is not original / new. The seventh reason for being rejected is that a paper muddled and difficult to read and the final reason is that it is boring because it revisits well known results or overlaps too much with something previously or elsewhere. The important point to notice from this list is that the personal preference of the editor can play a role and that it therefore pays a prospective contributor to browse a few copies of the journal before he or she makes a submission. Contributions that clearly fit the style and contribute to the debate, are much more likely to be accepted than articles that want to start a new line of inquiry or open a new debate. Try to co-author your first few papers with an experienced author.
3. WHAT DOES A SUCCESSFUL CONTRIBUTION LOOK LIKE?
The typical article accepted to this journal consists of 5000-6500 words and follows a familiar sequence consisting of an introduction, methods, results, conclusions and references. Each of these elements is described in turn.
3.1 Titles and keywords that make an impression
Journal titles must be brief but helpful. The title "EVALUATION OF POLICIES PROMOTING SUSTAINABLE AGRICULTURE IN SOUTH AFRICA " conveys the subject, method and broad location of a study in nine words. Longer titles do not always carry more information. For example, "DETERMINATIONS OF PHYSICAL AND CHEMICAL PROPERTIES OF KWAZULU-NATAL'S HOUSEHOLD WHITE PEACH 'LANDRACE' IN RELATION TO EXTENSION SERVICES - A CASE STUDY OF IMPENDLE LOCAL MUNICIPALITY" leaves the reader confused.
The abstract reveals that this paper describes the correct physiological ripeness at which indigenous fruit must be picked for optimal post-harvest handling, and so a title like "OPTIMAL HARVESTING OF LAND RACE PEACHES IN KZN" would be adequate. It is often recommended that titles be kept to under 16 words. The examples in Table 1, which came up in a keyword search on "land reform" in this journal, are all on the long side. Most of them work well enough, except for the two papers on the Karoo. Two-part titles can be a useful device to group articles if the grouping phrase is short enough. In this case, the long grouping phrase will prevent most readers from reading beyond the colon, which could create the impression that these are the same article. It would help to shorten the grouping phrase to "Land reform in the Karoo".
Volume 45 of this journal (2017), presents 21 articles which according to Google Scholar have been cited a total of 60 times to date, in other words at an average rate of 2.86 citations per article over the last three years. The average word count in these titles is 18.2 words and 38% of the cases in this volume conform to the sixteen-word limit. Citations to date vary from zero to eight and citations and according to Pearson's pairwise correlation coefficient citations are negatively but not significantly correlated with the length of the title (r = -0.212, p < 0.356). This result means that brevity is not the only factor that determines if an article will appeal to readers, but that it can certainly help to get a paper noticed.
It is a good idea to avoid discourse-specific terms in titles for contributions to inter-disciplinary journals. Here is an example of a title that will not go down well with reviewers or a general readership: "PERSPECTIVAL IMPLICATIONS ON APPROACH FOR TECHNOLOGICAL SKILLS TRANSFER OF THE EMERGING FARMERS: PEDAGOGIC PRAXIS PRINCIPLE". The word "perspectival" is not in common use (some would argue that it does not even exist) and "pedagogic praxis principle" is a highly technical concept that will not be familiar most extensionists.
An appropriate catch-line can be an asset if it still conveys all the necessary information, for example in "THREE BUBBLES AND A PANIC: AN EXPLANATORY REVIEW OF RECENT FOOD COMMODITY PRICE EVENTS" or "COLD COMFORT" for a review essay on climate change. Be careful not to overdo this and make sure that your readership is familiar with the expression that you choose. The title "Three bubbles and a panic" created the impression that the food riots of 2008 were silly, an argument that the subsequent analysis develops in detail. The expression "Cold comfort" means that a situation offers little consolation. In the context of global warming, melting ice caps will result in a temporary drop in temperatures, which lowers the temperature AND offers scant consolation because it is temporary. This is a good pun which makes the essay memorable to those who are familiar with the expression, but to no-one else. Rather use a boring title if you are not sure.
3.2 Introductions that set the scene
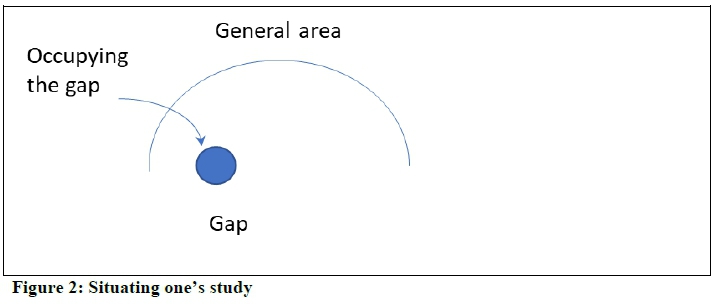
Successful articles usually open with an introduction of no more than one page of 300-400 words. An introduction must achieve three things: 1) Identify the general research area in which the contribution falls, 2) identify one aspect of the general area that the study will contribute to and 3) explain how the contribution will be made (this is in Figure 2). Begin with a broad perspective in paragraph one, review the literature briefly in paragraph 2 and state your paper's contribution in paragraph 3.
Applying this framework to the current paper, I would say that this piece falls under the general area of research reporting. The gap in this literature for this audience is the question of why so few papers are accepted. This gap is being occupied by reviewing the main reasons for rejection and providing a detailed guideline with examples of how to present research findings for this journal. [Compare to the third paragraph of section 1.]
A second example, which is currently undergoing the review process, and will complete final corrections shortly, is entitled "SOCIO-ECONOMIC CHARACTERISTICS INFLUENCING SMALL-SCALE FARMERS' KNOWLEDGE ABOUT CLIMATE-SMART AGRICULTURE IN MAHIKENG LOCAL MUNICIPALITY". This article contributes to knowledge about the adoption of climate smart agriculture, a literature that is still unclear on how to improve adoption levels, especially in smallholder communities. The author(s) occupy this gap by investigating the theory that knowledge determines adoption. An empirical model is presented whose dependent variable is a knowledge index which is explained by a combination of farm and farmer characteristics.
3.3 Data and methods that can be replicated
After the introduction, a methods section (or methods and data) of 500-1000 words is mandatory. The length of this section depends on the complexity and familiarity of the method presented. For example, a study of farmers' risk perceptions that rely on Likert scale data requires a recognised data summary technique like principal component (or factor) analysis (e.g. Wustro and Conradie, 2020). Despite its obvious relevance, a keyword search reveals that no-one has used this technique in this journal yet. In addition, principal component analysis is not standard fare in a Masters course in statistics. Therefore, should you wish to present a study that employs principal component analysis, it is important to describe the method in almost as much detail as a textbook would. If on the other hand, you are using an OLS model, which everyone knows, much less description is required although you must still say how the model was specified and what the expected signs are. Limited dependent variable models, like logit, are a bit of a grey area. One could argue that they are more like OLS than principal component analysis because most people have a sense of what logit models are, but the argument describing them more fully is that we have only had three examples of the technique in this journal (Ekepu et al., 2017; Conradie and Landman, 2015; Buyinza et al., 2008). Amongst univariate statistics, ANOVAs and t-tests are so familiar that they are even known by their acronyms, and so their mention in methods sections can be very brief, for example as in Conradie (2016):
"Three single variable analysis of variance (ANOVA) tests compared within-group variation in productivity to the variation in productivity across extension channels for each of the knowledge domains. Although this procedure does not imply causality, it allowed as a first step to see if a preference for private over public sources of information increased or decreased a farm's productivity performance."
Whether or not a technique was covered in your statistics course is a mere guideline and good reviewers will advise if you should expand or contract your methods section. Some might even make suggestions for good examples to follow. If your rejection letter states "inadequate description of methods", do a keyword search in the journal on the specific method, and follow that example.
All methods sections must include model specification. The estimating equation for the article on climate-smart agriculture mentioned above is:
Adoption = a0 + a1age + a2gender + a3married + a4education + a5experience + a6extension contact + a7offfarmincome + accredit + a9climateinfo + -+ e
Variable names must be as helpful as possible. In this example, the gender variable is unhelpful because the way it was coded is not immediately obvious from the variable name. In sociology, gender is often coded as female =1 and male = 2. The average gender level in the descriptive statics table then becomes 1.4 or 1.5, which is impossible to interpret. If the coding was 0 = male and 1 = female, an average of 0.2 on the gender variable is easily interpreted as a sample containing 20% females. Since the 0/1 coding could be applied the other way around, I prefer to replace the variable name "gender" with "D_male" if male = 1 or "Dfemale" if female = 1. My convention, which is widely applied in the same way in the literature, is that a capital D signifies a dummy variable.
When there are more than two categories, things get complicated. Years of schooling is a continuous variable. Therefore, if you assign a value of 1 to those with no education, and let 2 = persons with primary schooling, 3 = high school and 4 = university, the continuous metric sort of works well enough, but is technically not right. To see why not, imagine that you are coding the nine provinces alphabetically with 1 = Eastern Cape = 1 and 9 = Western Cape. There is no way in which the Western Cape is more nine times more valuable or further ahead than the Eastern Cape, and therefore introducing the province variable in a model could upset the results. In the same way, a university degree cannot be assumed to be four times more valuable than no education. Coding marital status is just as complicated. D_married usually indicates 1 = married and 0 = "never married", "widowed" or "divorced". If there is a difference between these three, more categories than just married/unmarried are needed. The correct way to code categorical variables can be looked up in a statistics textbook as it is beyond the scope of this paper.
It is important to state the hypothesised sign on each variable and to use the literature as justification for what you expect. This extract from Conradie (2019a) is insufficiently referenced although it makes the point that the expectations on some variables are better established (e.g. training) than the expectations on other variables (e.g. % woolled sheep). "The last three variables in equation 6b are of special interest to extension professionals. The dummy variable, D_ptime, takes a value of one for weekend farmers and a value of zero for full-time operators. One would expect that full-time operators would do better, as they are specialised in farming and not consumed by other concerns. If full-time farmers are indeed more productive than part-time operators, a way must be found to enable smallholders to be in farming full-time. However, if this is not the case, a multiple livelihoods strategy becomes viable.
While the industry believes that woolled sheep's second income stream gives an advantage over mutton sheep (Snyman and Herselman, 2005), this advantage was not statistically significant in the Karoo in 2012 (Conradie and Landman, 2015). The percentage of woolled sheep variable revisits this question.
The importance of training for the smallholder sector is well understood. D_Grootfontein, a dummy variable that takes a value of one if a farmer attended this [agricultural] college and zero if he attended another institution or only has matric, is there to establish if a vocational training programme has a beneficial effect compared to other forms of education, or a lack thereof. It is expected that a Grootfontein training will improve productivity."
The data and methods section should include a description of the data collection process. In science papers, the data section usually gives a brief description of the study area's location, climate and vegetation. This may or may not be relevant to an extension study, where community characteristics are usually of more interest. Referring to the community survey or population census to put your study area into perspective is a good strategy. It is also useful to know who conducted the survey, in what language, how long the typical interview took and what the response rate was. If data was collected by telephonic or email methods it lowers the response rate, and this must be stated too. If a woman beneficiary of a food security project is interviewed in the presence of a male extension officer who controls if she gets a fertiliser grant or not, she will not criticise the extension officer. If your data suffers from this kind of limitation it should be revealed in the methods section too as it might help to explain unexpected results. In my experience, it works best to be as honest as possible about one's data's shortcomings because it inspires confidence in one's results and gives colleagues the chance to improve on it. Other people working on the same topic increases the number of citations. Response rates are very important to report, even for secondary data. Descriptive statistics must be presented too and other papers in which the same dataset was used be quoted, if there are any. If you collected the data for your thesis, citing it in your article is an opportunity to get your citations going.
3.4 Presenting results well
An article that has a good introduction and good methods section usually has no problem presenting and discussing results clearly because the key question, argument and structure have already been established by the time one reaches the results section. It can help to organise the results section as a series of sub-questions. In Wustro and Conradie (2020), the very long and technical description of principal component factor analysis flows seamlessly into two results sections that ask "Does the structure of risk perceptions change when items are added?" and "Did farmers' priorities remain the same between 2012 and 2016?". These are the kinds of questions a reader might have.
Remember that the results section is the focal point of any paper. Authors should ensure that it contains 50 - 60% of the total word count, in the order of 3000 words or 6-8 pages for a normal-length journal article. If you find that your results section is too short relative to the rest of the paper, consider moving descriptive statistics from methods to results or spend more time comparing your results to the results from similar studies in the literature. Include more quotes from respondents if you are using qualitative methods or include an alternative model specification if you are presenting statistical results. Try to write more on the points you have already identified as important, by giving examples that illustrate the points you are making and expand the analysis if necessary. For example, in Conradie et al (2019) we calculated farm efficiency with a stochastic frontier model and then presented a qualitative interpretation of these figures by describing a series of specific cases of how the recent drought affected individual farmers in our study. The reviewers insisted that we also model efficiency with rainfall and temperature data. This increased the length of the results and discussion section of the paper by 13% which expanded the results section by more than a quarter.
It is useful to arrange the results section around one or two large tables or graphs (see below), which sometimes need to be landscaped to fit better. The advantage of one large illustration over several smaller items is that it draws the reader's eye to the paper's main result.
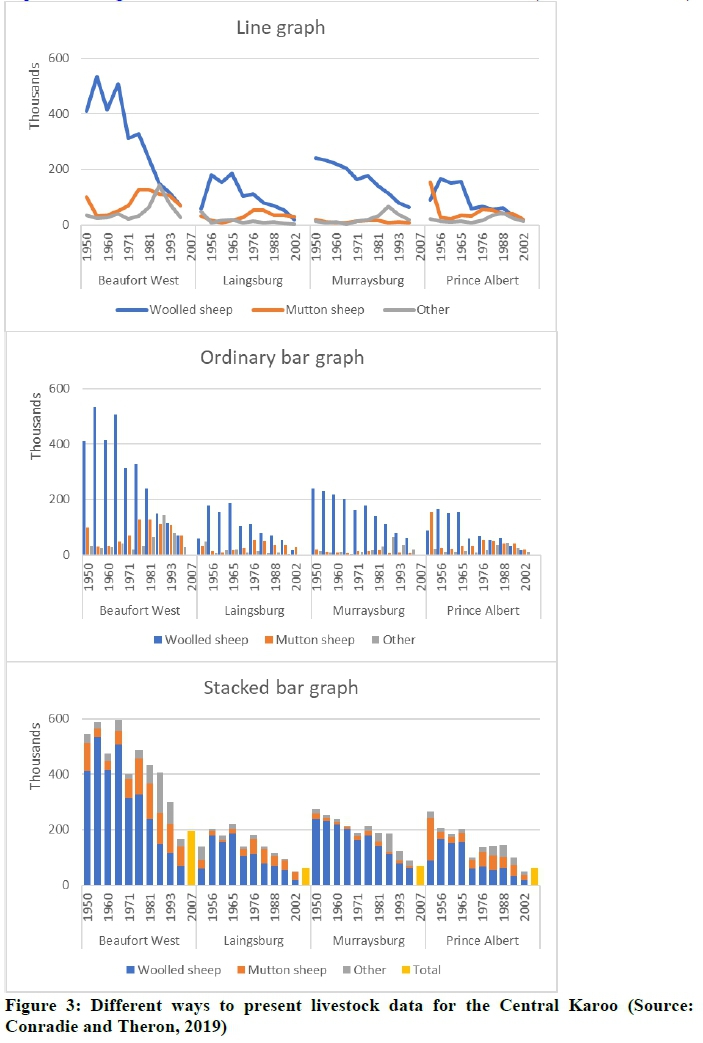
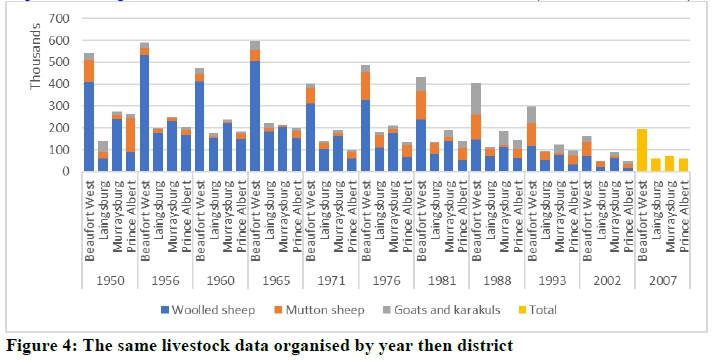
Remember to use captions and headings that allow your table or figure to make sense if it is taken out of the paper. The caption used Figure 3 is a good example, while Figure 4 's caption is an example of what not to do. As a reviewer I often begin my review by turning to the tables in the results section. If those are clearly presented and the results presented in them make sense, chances are that the rest of the paper will be in order. Make sure that your first impression is a good one.
A common mistake with the presentation of results is to use the wrong graph format. Most spreadsheet programs offer pie charts, bar charts suitable for raw numbers or percentages and line graphs. Doughnuts and area graphs, three-dimensional representations and other fancy forms are good for consulting reports but are best avoided in journal articles for the same reason that we prefer a plain register to a more florid journalistic register in academic writing. Box and whisker plots have merit only when the statistics demand them. Of the three options presented in Figure 3 the stacked bar graph on the bottom is the clearest and most informative. By sorting livestock numbers first by district and then by year, district differences over time can be shown. By stacking the three types of small stock, changes in the composition of the flock are also conveyed. This information is lost in the top and middle panels. Think carefully about how data is organised. For example, Figure 4 presents the same information as the bottom panel of Figure 3 in the same type of graph but is sorted differently (by year and then by district). The new presentation gives a clearer presentation of the differences at each point in time, but the information about the changes over time at each location is lost. Both are valid and the best formulation will depend on the question at hand. Experiment with different formulations and choose the one that you find the most straightforward to explain.
A problem that novice researchers often fall prey to, is to present descriptive statistics one after another in separate small sections. This creates the impression of superficiality which can be avoided by grouping together several variables in one paragraph. A paragraph on for example farmer characteristics can cover the farmer's age, experience and education together with household size and marital status and household income. A second paragraph on farm characteristics can then cover farm size, tenure arrangements, crop mix and type of livestock kept. A third paragraph can go more deeply into specific technical aspects of interest like rainfall, percentage irrigated land, crop yield and fertiliser application rates. Some papers even present all descriptive statistics in a single paragraph, which can be too long for the rest of the paragraphs in the results section. Graphs of descriptive statistics should be avoided at all cost and a paper must report more than just descriptive statistics. Even if you only present univariate analyses, testing for gender differences or differences in the characteristics of adopters and non-adopters or beneficiaries and the general public can be useful. Conduct t-tests to establish category differences in continuous variables and chi-squared tests to check for differences in categorical variables. Single-factor analysis of variance tests can establish if continuous variables differ by year over three years or more or across wet, normal and dry years.
Certain types of articles use extracts from other texts or quotations from respondents as their main source of data. Examples include a review of how the literature defines climate-smart agriculture or what land reform beneficiaries think of their relationships with project mentors. In this article, the data presented in section 3.1 are the titles of other papers. When extracts from other texts are presented, it is important to emphasise these quotes by putting them in bold or italics and putting long quotes of more than 50 words in separate indented paragraphs. Section 3.3 has an example.
3.5 Succinct conclusions
Conclusions is where one reminds the reader of the importance of the research question or argument of the paper, present the two or three main results and explain how these results take the debate forward. Conclusions should be short, should not include references and not be too didactic. Let the reader make up his or her own mind about the value of your contribution.
If the paper addresses a single simple question and the result is straightforward, the conclusion can be very short, about the same size as an abstract. If the analysis is more complicated or produced surprising results, it will take longer to explain the implications of the analysis.
Between results and discussion, and conclusions, some papers include small sections labelled "limitations" and/or "recommendations". These two sections should be no longer than 500 words each. These sections are not always needed, but "limitations" are a good idea for exploratory analyses or problematic datasets while "recommendations" can help to distil a take-home message from highly technical analyses for a general reader. For the latter, just be sure that recommendations are attributable to the analysis and not list just good ideas in general. Reviewers are asked to reflect on the quality of the conclusions drawn and recommendations made, and to confirm that these are justified by the analysis. If not, authors are instructed to remove general recommendations and conclusions.
3.6 Correct and complete references
Journal articles end with a reference list which lists references to other studies on which that article draws, either by duplicating the same methods, generating comparative results or by quoting from. There is a difference between a reference lists which contain only cited articles and a bibliography which includes all materials relevant to the topic, and for this journal, we want reference lists. There are no firm rules about the ideal length of a reference list, except that a literature review's reference list will be longer than that of an article which applies a statistical model. In this article, the reference list takes up 660 words, which is about 10% of the total. When dissertations are converted into journal articles reference lists tend to be too long. Apart from seminal papers, the literature reviewed in a journal article should be from the most recent decade. Reference lists can be too short as well. A good rule of thumb is to refer to at least five similar journal articles and to ensure that there are more journal articles cited than items from the grey literature.
Sometimes researchers working in remote areas have limited access to academic libraries and must rely on the internet for references. This is a dangerous strategy because the internet is full of grey literature which is not subject to rigours peer review and therefore not admissible as evidence in academic analysis. There are two main types of grey literature, unreviewed consulting reports, working papers, government reports and opinion pieces as well as articles from predatory journals whose peer review processes are not sufficiently rigorous. It is dangerous to label a journal as predatory as one can be accused of libel, but it is easy to spot an article from a predator journal because they tend to be short, simplistic and occasionally apply methods incorrectly. Also, beware of journals that have more than twelve volumes per year and have appeared recently. You should be safe if you limit your research to this journal, Journal of Agricultural Education and Extension, World Development, Development Southern Africa, South African Journal of Science, South African Journal of Economics and Management Studies, Agrekon and the African Journal of Agriculture and Resource Economics.
Some materials that technically belong to the grey literature are completely safe to reference because they originate from reputable organisations. Good examples include statistical reports from the Food and Agricultural Organisation or Statistics South Africa, unpublished and PhD dissertations and working papers from university websites.
I would also trust weather data from the South African Weather Services and wage data from the Department of Labour, but not labour data from the Weather Service or weather data from the Department of Labour. Wikipedia is not one of these, and to reiterate, always try to cite more reputable journals than grey sources on any reference list.
Referencing conventions for this journal can be requested from the editorial office (articles@sasae.co.za). Follow these prescriptions to the letter. It is also important to check the completeness of the reference list as the last step in editing. If you diligently built up your reference list by listing each source as it was cited, your list ought to be complete or have too many references, some of which may have fallen by the wayside during editing. My strategy for finding these extra references is to go to the reference list and search systematically from Aliber to Zwane on the surname of the principal author. Provided that each surname is spelt consistently everywhere, a single hit should identify references that can be deleted but be extra careful if you are referring to multiple papers by the same principal author.
3.7 Abstract always last
This journal requires an abstract of no more than 200 words on every submission. A good abstract states the problem, method, selected results and the nature of the contribution and can be as short as 50 words. This short paragraph is best written right at the end when the article's title and keywords are being reviewed. The word count on this paper's abstract is 135 words.
4. WHERE TO START AND HOW TO PROCEED?
This section provides practical advice on selecting an open question, some input on survey design and data capturing and gives suggestions on how to approach writing.
4.1 Finding open questions
The first step in a new research project is to formulate a question. If you can identify an open question, your likelihood of contributing increases. Let us return to the land reform literature described in section 3.1. Sub-areas under the land reform umbrella include in no particular order:
• Land acquisition and the cost of land reform
• Identifying beneficiaries and meeting targets
• Planning and designing projects, planning extension interventions
• Evaluating performance, including baseline surveys
• Policy analysis
The two articles by Jordaan and Grobler (2011 a,b) fit under bullet 4. This type of research has only been done for the Karoo. Everywhere else baseline surveys are an open question. The Terblanché (2011) paper on mentorship, his subsequent collaboration in 2014 on strategic partnerships and the paper by Maka and Aliber (2019) cover aspects of bullet 3. Even in this relatively well-researched area, there are open questions on beneficiaries' experience with mentors and strategic partners that could be researched. Hadebe's (2016) article on land acquisition together with Aliber (2019) and Conradie (2019b) investigate bullet 1.
This area is still open for most of the Northern and Western Cape, Northwest, Limpopo, Mpumalanga and KZN and local findings must corroborate Aliber's (2019) national analysis. Loki et al (2019) touch on extension planning, which needs more attention. So far bullets 2 and 5 are entirely open, and yet many aspiring researchers could easily contribute to this topic because they work with land reform projects every day.
4.2 Survey design
When a research question has been identified one can proceed to survey design. A detailed discussion of this important topic is beyond the scope of this paper, but since flawed research designs account for 29% of all rejections in this journal, it must be dealt with briefly. Perhaps the most important aspect of survey design is to consider suitable control groups. For example, it is impossible to measure the financial impact of a food security project on households or to investigate the benefit of extension visits on farm productivity if you only have data on beneficiary households. Before and after analyses can be a solution, but these are not suitable if your main data collection strategy is the use of recall questions that refer several years back. Consult a statistician or senior colleague for more advice for advice on how to design your study.
Be sure to submit your proposal to your organisation's internal ethics clearance process for approval before you go into the field. The nature of these processes varies from one organisation to another. Common elements include that you must present a survey instrument (questionnaire), short research proposal that includes a model and some statement about how the identity of your respondents will be kept anonymous. Have this conversation with your line manager, academic supervisor or your company's research division.
4.3 Improved questionnaire design and data work
Questionnaire design is a critical research step which very often is not given sufficient attention early enough in the process. Too often we collect variables that are easy to collect (age, education, gender, marital status, household size) rather than variables that are useful in the analysis. Consider for a moment what determines the difference between success and failure in the Southern Cape. Explanations in the literature often include farm size and experience, but on these farms, the difference is explained by how successfully and when farmers adopt the principles of conservation agriculture and how lucky they have been with rainfall. Experience, farm size and the composition of farm income give results, but these are only indirectly related by the real explanations which are rainfall, adoption dates and dummy variables for the adoption of specific machinery and practices.
A second common error is to ask for the variables we need in our analysis rather than to ask questions that farmers can answer. For example, a model might need maize yield to explain profitability. Farmers will usually record or remember total output, but few will take the trouble to calculate yield. When confronted with a question about yield, they might guess their yield or report what they had hoped to make, instead of what they really made. It is better for data quality to collect area planted and total output so that you can calculate yield yourself rather than to end up with farmers' guesswork. It is easy to see that asking respondents to recall detailed information, like the kilograms of fertiliser or millimetres of water applied to a specific crop in 2017, is to ask for trouble too. It is not very wise either to ask people in 2020 how serious the 2016 drought was or how they experienced the predation pressure in that year.
It is best to avoid money questions which farmers find objectionable (Conradie et al., 2013). Also, beware of asking questions that cannot be answered/do not have answers. In my work on wildlife management in the Karoo, predation rates were very important (Conradie and Nattrass, 2017; Nattrass and Conradie, 2018). I soon discovered that it is impossible to ask about the number of newborn lambs caught by jackals because nobody can tell if a jackal fed on a lamb that died due exposure or birth defects or caught a live lamb. If a key variable cannot be measured, the research question must be adjusted. Another example of this problem is in the estimation of the demand for irrigation water. Demand is the inverse relationship between price and quantity that can only be calculated if there is a change in both variables. The price of water is an administered price, which usually does not vary within a given period. The best way to overcome this problem is to provide for price variation by expanding the survey to different jurisdictions or to include multiple years.
I prefer the old-fashioned method of capturing survey data on paper to the use of electronic devices because my mind is already subconsciously analysing the patterns while I capture the data. I usually begin the analysis by running the model that I specified in the methods section, which is not a good habit because the distribution of the dependent variable can be different from that model that I thought I was going to fit. It is better to first explore relationships between important variables with scatter plots and univariate statistics. Keep a record of different results.
4.4 Writing, editing and peer review
I write papers form the top, beginning with the title, my name, abstract and keywords. The abstract is always rewritten at the end but drafting it as a first step provides a roadmap for the paper which keeps my writing focussed. It is useful to peg out section headings up for the same reason. The introduction brings me in touch with the literature and getting down data and methods, which is straight forward to write, ensures that the word count accumulates quickly. Writing the results section is much harder, and this is usually where I start over with a fresh file. The work that is abandoned is not wasted, because writing is thinking.
When everything is done, set aside your complete draft for ten days before submitting because it is much easier to see one's own mistakes after you have been away from the text for a while. Do not leave it too long because it is easy to forget where you saved the data file and what exactly you did to produce a specific result. In this period make use of every opportunity to present seminars or give feedback to respondents, as talking about your results can clarify your thoughts. Circulate the paper to friends and colleagues for peer review and invite colleagues to become co-authors if they make a substantial input to your paper. Also cite other people generously as this will increase the likelihood of them citing your work. More citations improve the visibility and standing of our journal, a fact from which everyone can benefit. While on the topic of collaboration, it is a really good idea for novice researchers to do their first few papers with experienced co-authors who know what it takes to get published. Many of us have learnt our craft this way and are prepared to reciprocate to younger colleagues who ask for help. As the person asking for help, remember to offer in return your services as field researcher or translator and do your share of the reading. Share your contacts and share the credit generously and people will also share with you.
I think it is good practice to have all papers copy edited, in other words, checked for language and grammar, before they are submitted to a journal. Some reviewers will point out grammatical errors and the like, but it is not their main function and therefore you cannot rely on the journal's review process to catch all your mistakes. You also cannot do your own copy editing, because it is almost impossible to spot one's language errors. A fresh pair of eyes is needed to spot grammatical errors, the incorrect use of homonyms and missing or incorrect words in sentences. Consult the Writing Centre if you are still affiliated with a university or pay a professional person. All my articles are professionally copyedited before submission, and I have learnt that it is money well spent because it creates the best possible impression with a reviewer.
5. SUMMARY
The purpose of this article was to present the elements of an acceptable journal article to serve as a guideline to novice researchers. The analysis began with a brief description of common reasons for rejection from this journal and proceeded to a detailed discussion of the key elements of a journal article. I also presented practical advice on how and where to begin the process and what the main pitfalls are.
REFERENCES
ALIBER, M., 2019. How can we promote a range of livelihood opportunities through land redistribution? PLAAS working paper 75. Available from: http://repository.uwc.ac.za/xmlui/handle/10566/4654?show=full [ Links ]
BUYINZA, M., BANANA, A.Y., NABANOGA, G. & NTAKIMYE, A., 2008. Socioeconomic determinants of farmers' adoption of rotational woodlot technology in Kgorobya Sub-County, Hoima District, Uganda. SAfr. Jnl. Agric. Ext., 37(1), pp.1-16. [ Links ]
CONRADIE, B., PIESSE, J. & STEPHENS, J., 2019. The changing environment: Efficiency, vulnerability and changes in land use in the South African Karoo, 2012-2014. Env. Dev., 32, p.100453. [ Links ]
CONRADIE B., THERON, S. 2019. Grazing indices for the Karoo. Working paper 442 of the CSSR, University of Cape Town. [ Links ]
CONRADIE, B., 2019a. Designing successful land reform for the extensive grazing sector. S Afr. Jnl. Agric. Ext., 47(2), pp.1-12. [ Links ]
CONRADIE, B., 2019b. Land use and redistribution in the arid west: the case of Laingsburg Magisterial district. Agrekon, 58(3), pp.281-291. [ Links ]
CONRADIE, B. & NATTRASS, N., 2017. The robustness of self-report data on predation: A comparison of two Karoo surveys. Afr. Jnl. of Agric. Res. Econ., 12(3), pp.217-29. [ Links ]
CONRADIE, B.I., 2016. The implications of a weak public extension service for the productivity performance of Karoo agriculture. S Afr. Jnl. Agric. Ext, 44(2), pp.99-109. [ Links ]
CONRADIE, B. & LANDMAN, A., 2015. Wool versus mutton in extensive grazing areas. S Afr. Jnl. Agric. Ext, 43(1), pp.22-31. [ Links ]
CONRADIE, B., TREURNICHT, M., ESLER, K. & GAERTNER, M., 2013. Conservation begins after breakfast: The relative importance of opportunity cost and identity in shaping private landholder participation in conservation. Biol. Cons., 158, pp.334-341. [ Links ]
EKEPU, D., TIRIVANHU, P. & NAMPALA, P., 2017. Assessing farmer involvement in collective action for enhancing the sorghum value chain in Soroti, Uganda. S Afr. Jnl. Agric. Ext., 45(1), pp.118-130. [ Links ]
HADEBE, G. P. 2016. Developing alternative models to acquire land sustainably in the Free State Province. SAfr. Jnl. Agric. Ext., 44(1), pp.1-12. [ Links ]
JORDAAN, J. W. & GROBLER, H. J. F. 2011. Farmer support and extension to land reform farms in the Central Karoo - part 1: a baseline survey of farm potential, farmer profiles and farm management knowledge and practices. SAfr. Jnl. Agric. Ext., 39(1), pp.35-44. [ Links ]
JORDAAN, J. W. & GROBLER, H. J. F. 2011. Farmer support and extension to land reform farms in the Central Karoo - part 2: a baseline assessment of farm-level economic viability. SAfr. Jnl. Agric. Ext., 39(1), pp.45-54. [ Links ]
KHWIDZHILI, R.H. & WORTH, S.H., 2017. Evaluation of policies promoting sustainable agriculture in South Africa. SAfr. Jnl. Agric. Ext., 45(2), pp.73-85. [ Links ]
LOKI, O. 2019. Factors Influencing Land Reform Beneficiaries' Willingness-To-Pay for Extension Services in Eastern Cape and Kwazulu-Natal, South Africa. S Afr. Jnl. Agric. Ext., 47(4), pp.29-45. [ Links ]
MAKA, L. & ALIBER, M. A. 2019. The Role of Mentors in Land Reform Projects Supported Through the Recapitalisation and Development Programme: Findings from Buffalo City Metropolitan Municipality, South Africa. SAfr. Jnl. Agric. Ext., 47(2), pp. 37-45. [ Links ]
MAZO, J., 2010. Cold comfort. Survival, 52(6), pp.151-160. [ Links ]
MKHATHINI, K.M., MAGWAZA, L.S., WORKNEH, T.S. & MWITHIGA, G., 2017. Determinations of physical and chemical properties of KwaZulu-Natal's household white peach 'landrace'in relation to extension services-a case study of Impendle Local Municipality. SAfr. Jnl. Agric. Ext., 45(2), pp.95-109. [ Links ]
NATTRASS, N. & CONRADIE, B., 2018. Predators, livestock losses and poison in the South African Karoo. Jnl. Cleaner Prod., 194, pp.777-785. [ Links ]
PIESSE, J. & THIRTLE, C., 2009. Three bubbles and a panic: An explanatory review of recent food commodity price events. Food Pol., 34(2), pp.119-129. [ Links ]
SNYMAN, M.A. & HERSELMAN, M.J., 2005. Comparison of productive and reproductive efficiency of Afrino, Dorper and Merino sheep in the False Upper Karoo. S Afr. Jnl. Anim. Sci., 35(2), pp.98-108. [ Links ]
TERBLANCHÉ, S. E., STEVENS, J. B. & SEKGOTA, M. G. 2014. A comparative analysis of two land reform models: The Mashishimale Farm Management Model and the Nkumbuleni Strategic Partnership Model, South Africa. S Afr. Jnl. Agric. Ext., 42(2), p.81-102. [ Links ]
TERBLANCHÉ, S. E. 2011. Mentorship a key success factor in sustainable land reform projects in South Africa. S Afr. Jnl. Agric. Ext., 39(1), pp.55-74. [ Links ]
TROWER, P. 2012. Eight reasons I rejected your article. Elsevier. Available from: https://www.elsevier.com/connect/8-reasons-i-rejected-your-article [ Links ]
WUSTRO, I. & CONRADIE, B., 2020. How stable are farmers' risk perceptions? A follow-up study of one community in the Karoo. Agrekon, 59(1), pp.30-45. [ Links ]
 Correspondence:
B. Conradie
Email:Beatrice.conradie@uct.ac.za

