


Servicios Personalizados
Articulo
 Inglés (pdf)
 Articulo en XML
 Referencias del artículo
Indicadores

Links relacionados
-
 Citado por Google
 -
 Similares en Google
Compartir

 Permalink
South African Journal of Agricultural Extension
versión On-line ISSN 2413-3221
versión impresa ISSN 0301-603X
S Afr. Jnl. Agric. Ext. vol.48 no.1 Pretoria 2020
http://dx.doi.org/10.17159/2413-3221/2020/v48n1a523
ARTICLES
Incorporating extension measures into farm productivity models with practical guidelines for extension staff
Conradie B
Associate Professor, University of Cape Town, Cape Town, South Africa.
ABSTRACT
This study formulates a conceptual model of the knowledge transfer process to evaluate the treatment of extension in a sample of 30 totalfactor productivity models. Three studies did not include a training or extension proxy, 15 studies used singular proxies, and 13 studies employed multiple proxies for visits in the broad sense. Aspects of adoption were considered in 12 studies. Contact with the extension service is best captured with simple dummy variables for visits, training or extension club membership, although there are several good examples of studies that successfully incorporated the quality of the service provided. Quality seems to be more effectively captured with a series of adoption indices, some of which can be quite simple, such as the presence of a disease outbreak, but detailed enterprise-specific technical information is needed to do this well. The advice for an extension service that wishes to embark on this type of monitoring is that it should begin by programming the technical information to be transferred and to use the development of activity charts to build technical skills amongst extension agents. Each activity should include an observable measure of adoption. Delivery should be planned around activity charts and ought to include at least 30% of visits aimed specifically at observing adoption and should devote at least one in 10 meetings to leading a farmer through a process of self-reflection, which includes reflection on the farm's financial performance.
Keywords: Adoption, Best practice, Efficiency outcomes, Impacts, Knowledge transfer, Quality extension
1. INTRODUCTION
Quality extension is recognised as an important enabler of technical progress and efficiency gains in agriculture (Dinar, Karagiannis & Tzouvelekas, 2007; Hoag, 2005). Many conceptual models of the extension process exist, but good empirical models are few and far between (Aker, 2011; Mutimba, 2014), or too simplistic to reveal how service quality affects outcomes (Theriault & Serra, 2014).
Research continues to develop more sophisticated models of how productivity growth is enhanced by extension, however progress has been limited thus far. For example, Dinar et al. (2007) have interacted the number of visits from public and private extension agents with inputs and inefficiency variables to measure how visits affect performance but does not control for the quality of visits or for self-selection into accessing private or public extension services. Theriault and Serra (2014) explicitly controlled for perceived quality of the public sector extension, yet it did not explain the variation in farm performance. Conradie (2016) investigated how perceived quality correlates with efficiency but did not establish from extension input to efficiency performance.
This study develops a conceptual model of the information transfer process that lies at the heart of extension and conducts a systematic literature review to document how previous studies handled extension in the study of farm productivity. The purpose is to find the proxy for extension input that is most effective at explaining observed differences in farm efficiency. In response to Mutimba's (2014) criticism that African extension services fail to document their own impact, the paper concludes with practical advice on how a service wishing to measure its own impact should structure data collection from baseline onwards. The literature review methodology is presented in the next section. Section 3 (Results) presents a conceptual model of the extension process to serve as an analytical lens for the literature review which is also presented there. Section 4 discusses the practical implications of the results and the paper ends with brief conclusions.
2. LITERATURE REVIEW METHOD
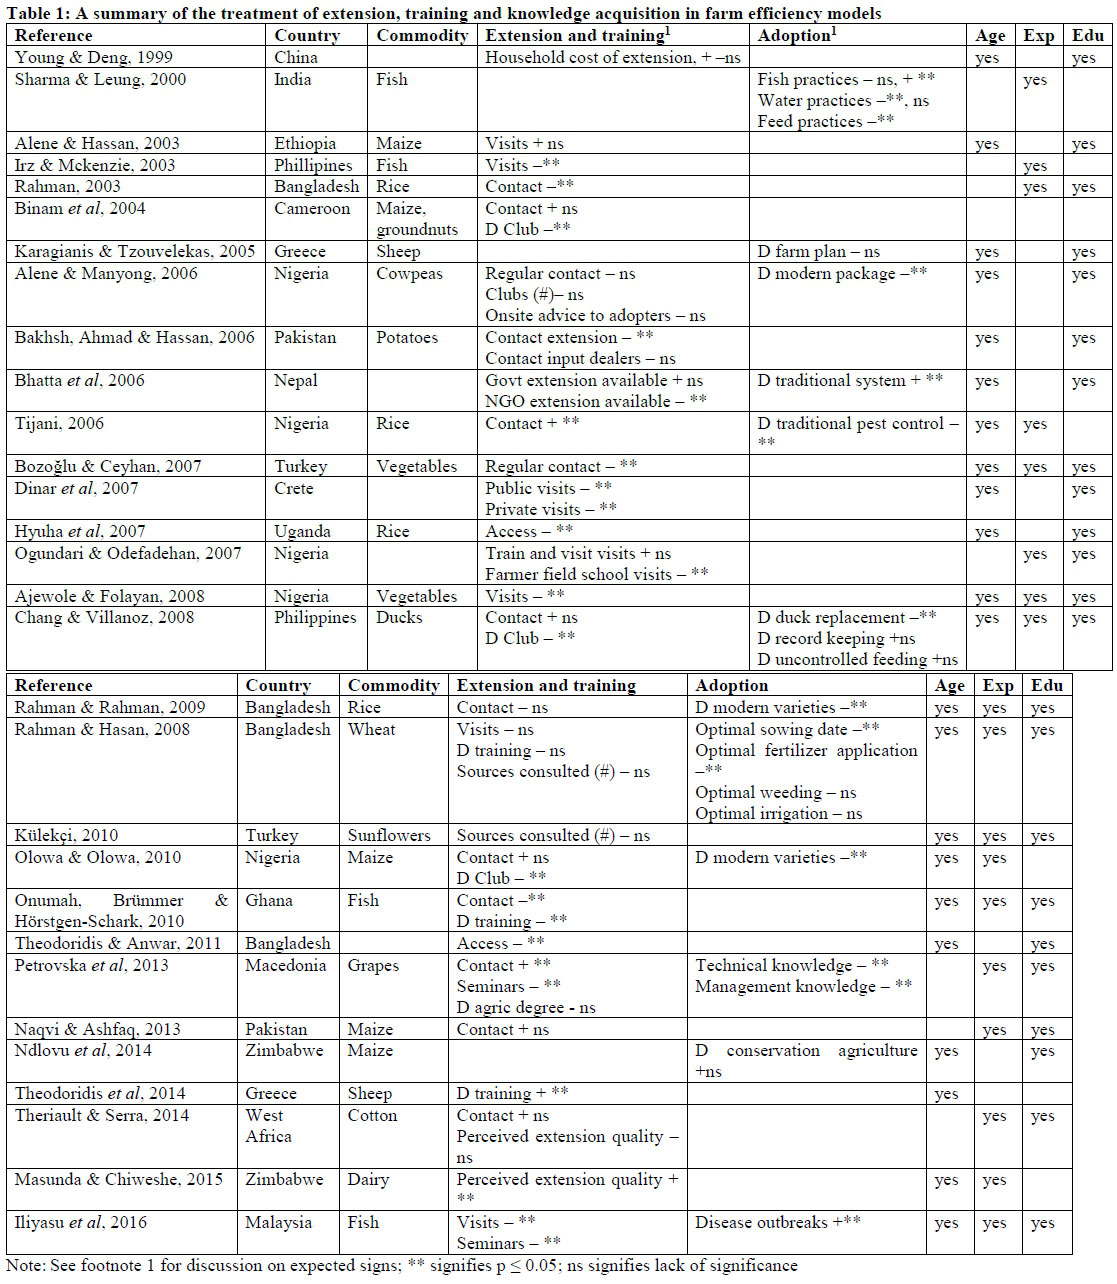
A conceptual model of the extension process was developed to serve as organising principle for a literature review that examined the effects of extension delivery on farm performance. In this study, farm performance is measured as technical efficiency relative to a best-practice frontier. Since technical efficiency effects models that apply Battese and Coelli's (1995) framework, which often includes a measure of extension to explain individual farm performance, the literature of 6745 articles citing the original Battese and Coelli (1995) study indexed in Google Scholar was used as a starting point for the search. This population was narrowed down by co-searching on "extension" and "farm" to extract papers that included extension as an explanation of observed efficiency differences. This yielded 1330 results from which a sample of 50 articles were scanned for suitability. Dissertations and articles that focussed on methodological issues or failed to specify empirical models were discarded. It left 26 articles that were combined with a convenience sample of five previously identified studies that meet these criteria. The specification of the extension variable and its significance level in the empirical model were noted for every study, as well as whether the model controls for the farmer's age, experience and education. Two types of extension inputs were considered, namely private visits and group training. The latter includes technology transfer programmes, clubs and social capital networks. Where proxies for adoption of specific improved practices were considered in the model, their specification and significance levels were recorded too, along with the country and commodity context of each study. Once summarised, papers were classified according to their proxy for extension input and the sign1 and significance of the extension variables. The survey results are presented in chronological order in Table 1.
3. RESULTS
3.1 What happens during an extension visit?
The two dominant extension philosophies are the "technology transfer" and "human development approaches" (Terblanché, 2008; Worth, 2006). The main difference in these approaches lies in the balance of power between farmer, extension agent and researcher. In the technology transfer paradigm, information is generated in the research space from where it flows unidirectionally onto farms via the extension service that serve as passive conduit. The extension agent plays a more active facilitation role in the human development paradigm (Binam et al, 2004). Communication flows in both directions and extension agents need the ability to simplify and appeal to farmers (Terblanché, 2008). The danger with the latter is that extension staff can become so engrossed in their capacity building and facilitation functions that they forget to plan structure interventions and measure outcomes (Mutimba, 2014), which compromises their potential impact on farm performance (Binam et al, 2004). The current paper reflects on how one could measure one's own extension impact.
Extension is laid out as a four-step process in Figure 1. In Stage 1, the extension agent arrives on a farm, hopefully armed with clarity about the information that needs to be transferred. During the visit, he or she engages the farmer, who hopefully listens politely and with an open mind. Visit is used here as a generic term to describe individual or group contact. During Stage 2, the information transfer process, the extension agent must step back to allow the farmer to mull things over and consult other sources of information so that his or her mind can be made up. If too much pressure is applied too early farmers might reject the message which could set the programme back many months (Terblanché, 2008). Stage 3 begins when adoption becomes reflected in farmers' actions. At that point, the extension agent should quietly note down changes in methods, varieties and quantities of inputs and timing of applications (Aker, 2011). At the end of the season, it might be a good idea to probe for farmers' perceptions of the effect of the changes he or she made. Terblanché (2008) advises gentle encouragement rather than forceful queries at this stage. The refinements that will be forthcoming are the crux of Stage 4, from where the next extension cycle will be initiated.
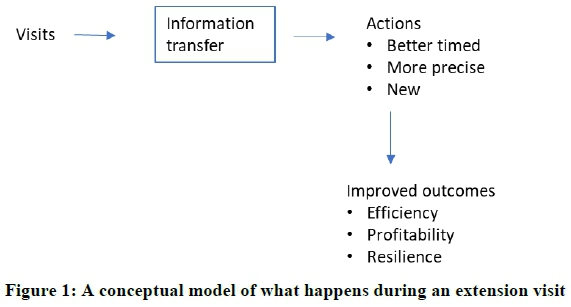
If the purpose of extension is to improve farming outcomes, extension performance should be measured against farmers' efficiency, profitability or resilience. Resilience is not the most suitable measure of success because it describes performance under adverse conditions which might not always apply uniformly. Profitability is more widely applicable and more widely used (Bhatta et al, 2006; Hyuha et al, 2007; Irz & Mckenzie, 2003), but the difficulty with profitability as an outcome is that farmers are usually price takers and so are at the mercy of the market. Over the last 30 years, efficiency benchmarking has emerged as the best way to evaluate a farm's degree of success independently of external circumstances. These models usually account for extension input by including some measure of it as part of the second module in which observed farm efficiencies are explained with farm and farmer characteristics. In principle, extension input can be measured at any stage of the information transfer process, except Stage 2, which is unobservable. Measuring input at Stage 1 amounts to counting visits (type, quality) while measuring effectiveness at Stage 3 could involve counting adoption (of techniques, practices, varieties, application rates, timings, etc.). To link visits to adoption, the model might control for both, although this strategy is still rare in the empirical literature. The next section reviews a sample of the farm efficiency literature to establish the most popular and effective modelling strategies.
3.2 How do researchers model what happens during an extension visit?
The 30 studies that were evaluated are listed chronologically in Table 1. Each study is identified by its in-text reference, country and commodity. The sample covers 11 African and 11 international countries. Livestock rearing includes sheep, cattle, duck and fish farming. Crops include the three main cereals, six other annual crops (cotton, cowpeas, groundnuts, potatoes, sunflowers, and leafy vegetables), and two tree crops (cocoa and grapes). All studies explicitly consider aspects of knowledge transfer; 29 include at least one variable that captures the extension or training process while 12 measure adoption. More than 78% of author affiliations indicate universities with the majority originating from Agricultural, Resource Economics or pure Economics departments, although the contribution from other departments was higher than expected. Government and international institutions accounted for 10% and 11% of author affiliations respectively, and the private sector for 2%.
The typical paper measures extension impact at Stage 1 (visits) or Stage 3 (adoption). Each entry records the definition, sign and significance level of two extension variables and whether the model controls for farmer age, experience and education (formal schooling). Three studies did not include a training or extension proxy, 15 studies used singular proxies, and 13 studies employed multiple proxies for visits in the broad sense.
The most popular single measures of extension input were a dummy variable indicating that a given farmer had access to extension services in a given period (13% of simple measures), a dummy variable for contact or regular contact (30% of cases), and the number of visits paid to a given farmer in a given period (27% of cases). The remaining 27% of the simple measures were made up of four studies that formulated the impact as the farmers' expenditure on extension (Young & Deng, 1999), the number of information sources consulted (Külekçi, 2010), a dummy variable indicated that a farmer had undergone training over the past five years (Theodoridis et al, 2014), and a dummy variable for the perceived quality of the extension service (Masunda & Chiweshe, 2015).
The expenditure variable functions in the same way as visits, while the quality and training variables presuppose a degree of familiarity, and hence contact, but it is not obvious how extension input can be inferred from the number of information sources consulted. It is therefore unsurprising that the number of sources consulted was not significant in a study conducted by Rahman and Hasan (2008). The access dummy variable worked in both cases, the contact dummy variable worked in 60% of cases and the number of visits in 43% of cases. Only two perverse results, where a variable produced a significant but counterintuitive sign, were encountered. Both were exotic formulations of the contact dummy variable D training in Theodoridis et al (2014) and the quality dummy variable used in Masunda and Chiweshe (2015).
Therefore, if a single measure of visits is deemed sufficient to explain the observed variation in farm efficiency, there is a choice between a dummy variable for access or contact and a count of the number of visits made, and it seems as if dummy variables work slightly better than a count of visits. The nature of the data collection process will determine which is most practical. If it is possible to survey treatment and control farmers, the dummy variable approach is advisable, and if not, the researcher might have to make do with a count of visits combined with some other indication of quality. There were three studies that counted access, contact and visits by type. Dinar et al (2007) counted visits made by public and private extension agents separately, Bakhsh et al (2006) made a distinction between advice provided by extension staff and input suppliers, and Bhatta et al (2006) measured the effects of contact by public extension staff separately from that provided by NGO extension staff. Findings were broadly in line with expectations. Better resourced NGO advisors had a greater impact than public extension staff who were more effective than input suppliers, although in the Dinar et al (2007) case, both visits by private and public sector experts were beneficial.
In the remaining 14 cases that made use of multiple "visits" proxies, a dummy variable for contact appears most frequently, often in combination with a dummy variable for extension club membership. In these instances, the membership variable was usually more effective than the contact variable. Other proxies combined with contact, or contact and clubs, include a dummy variable for demonstration plots (Alene & Manyong, 2006), dummy variables for seminar attendance and a tertiary qualification in agriculture (Manevska-Tasevska, 2013), and a dummy variable for the perceived quality of the extension service (Theriault & Serra, 2014). Rahman and Hasan (2008) as well as Iliyasu et al (2016) combined the number of visits received with a training dummy variable and Rahman and Hasan (2008) also added the number of sources consulted by a farmer. In two of the three cases where more than two visit proxies were introduced at the same time, none of them were significant, which indicates over specification. Rahman and Hasan (2008) attempted to fit 36 parameters with 293 observations, but only managed to get six of the 14 inefficiency coefficients to be significant. Alene and Manyong (2006) attempted to fit 28 parameters with a sample of 257 observations and only obtained 12 significant coefficients, including less than one third of the coefficients in the inefficiency module. Petrovska et al (2013) achieved a much higher success rate since she had a sample of 900 observations.
Twelve of the 30 studies included some proxy for Stage 3 of the technology transfer process. The adoption (or rejection) of modern varieties or a package of modern inputs was the most popular proxy for this state of the technology transfer process. It worked in four of the six cases where this configuration was used. The exceptions were Ndlovu et al (2014) who failed to show that conservation agriculture was a better way to grow maize in Zimbabwe, and Tijani (2006) who found that the traditional pest control regime worked better than modern pesticides in rice growing in Nigeria. Despite a generous sample size of 1410 observations, the Ndlovu et al (2014) translog stochastic frontier model does not inspire confidence as only one of the five basic inputs (labour) is significant with the anticipated sign while one has the wrong sign (land). In the case of Tijani (2006), the 18-parameter stochastic frontier model was too complex for the sample of 50 observations which resulted in only a third of the inefficiency variables working correctly.
Four studies modelled Stage 3 of the technology transfer process by constructing dummy variables or indices for the adoption of critical growing practices. Rahman and Hasan (2008), who defined correct practices in terms of optimal timing, got two of the four timing variables to work correctly, although the way they constructed their timing indices was awkward. For example, the optimal sowing date variable was constricted with 1 = if sown during the optimal time, 2 = if sown slightly late and so on up to a maximum index of four. It means that if the index increases, inefficiency is expected to rise, which is a counterintuitive way of thinking about adoption. The sign reported in Table 1 was reversed to be consistent with the normal specification of inefficiency effects.
Chang and Villanoz (2008) examined the marginal contributions of three critical practices, namely a predetermined retirement and replacement of breeding stock, the use of scientific feeding principles, and recordkeeping. Recordkeeping had no effect on efficiency, which is no surprise as the mere keeping of records does not presuppose that they are used effectively. The decision by Karagianis and Tzouvelekas (2005) of a dummy variable to indicate the existence of farm improvement plan did not work either. The feeding variable in Chang and Villanoz (2008) was awkwardly defined as the use of unrestricted access to feed without clearly stating if this was a good or bad practice. In dairy, allowing cows to choose when they would like to be milked and fed improves efficiency, but if the quantity of feed available is also unrestricted, efficiency will decrease because of the decreasing marginal value product of feed. The only adoption variable to work in the Chang and Villanoz (2008) model was the ambiguous adoption of scientific stock replacement principles.
Sharma and Leung (2000) specified a highly successful critical practices model for fish farming in India. Their sample consisted of 732 intensive and 85 extensive carp farms. They constructed three indices of good practice for fish, water and feed management from data that is easily observable and does not require asking the farmer directly. The fish index combined six items, the water index 11 items, and the feeding practices index seven items. Results show that the importance of the subset of practices vary with intensity of production, which provides useful feedback on how to differentiate the extension offerings to these two subgroups of producers. Iliyasu et al (2016) who also studied fish farming, this time in Malaysia, simply monitored disease outbreaks, the lack of which they argued was a useful shorthand for farmer competency. Finally, Manevska-Tasevska (2013) went the other way to establish competence. In this instance, a technical competence dummy variable was constructed by asking a farmer to explain why he or she applies certain fertilisers or pesticides.
The specific questions were not listed, and the answer derived from the extension agent's impression of a farmer's competence rather than their answers to a set list of questions. A dummy variable for management competence focused on knowledge of bookkeeping and price formation in the industry.
The lesson here is that it is worth experimenting with adoption variables only if the researcher has an intimate knowledge of the production system being studied. In such cases, it is best to formulate questions to capture revealed preference, in other words, by observation rather than by asking farmers about their use of particular methods. Here the danger with interviews, especially ones that involve a long recall period, is that a farmer may consider a specific practice to be highly beneficial and yet have good reason not to apply it in his business, or that he or she may have the intension to act in a timely fashion and then never get around to it. Only regular visits by extension officers will catch these subtleties which are likely to make all the difference to productivity outcomes. Since it is difficult to know ahead of time which aspects of production are the most critical and since these could vary depending on enterprise type as it did for Sharma and Leung (2000), one should initially monitor too many rather than too few aspects of production and continue to monitor extension impact over several years.
4. DISCUSSION
4.1 Practical implications for improving the impact of public sector extension agents
These results entail several useful guidelines for extension staff who wish to monitor their own impact. For those just embarking on the journey, it is important to recognise that the cycle of planning, execution and evaluation is iterative and so can be refined over time. The extension officer should begin by planning out the activities that constitute production of a specific crop or livestock enterprise and should end the season by reflecting on his or her impact. In between, there will be different visits made to farmers. Individual visits are more suitable for planning, problem-solving and evaluation, whereas group visits are better for transferring technical information and for farmer-to-farmer extension. It is a good idea to let farmers choose where to go and what to see on some of these visits, but it is up to the extension agent to ensure that every contact session contributes to the overall extension plan.
Terblanché (2008) advises that the extension agent should adhere to adult education principles, show respect for human dignity and develop a sensitivity for individual farmers' constraints and opportunities. He also says that developing trust is essential, and that communities and individuals will not always know ahead of time what they need or that they need something.
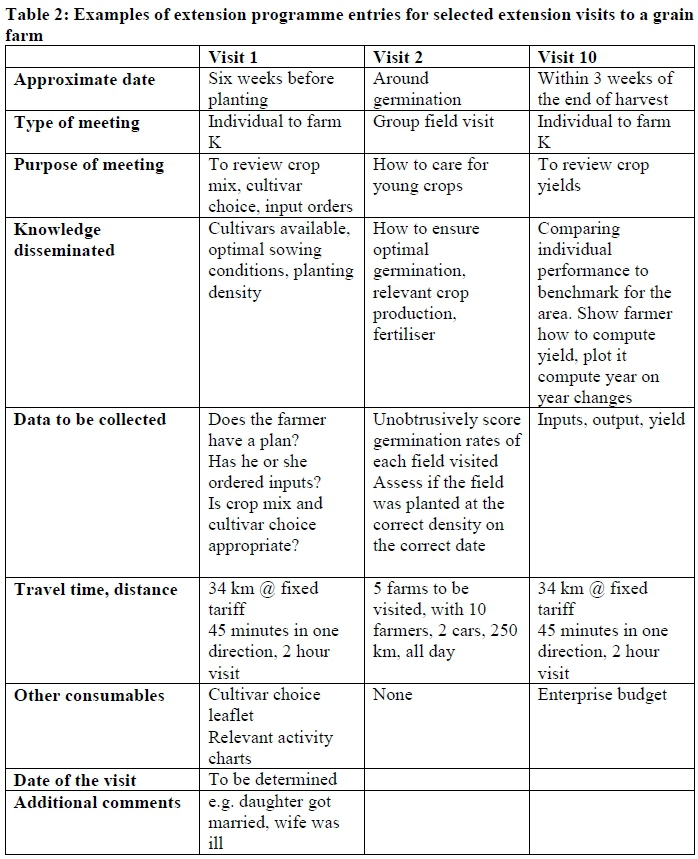
An extension agent new to this way of working could begin by compiling everything known about a specific production process in an activity chart which links optimal dates and quantities to all critical production activities (Aker, 2011). It is important to include detail, for example "sow wheat mid-April at 200 kg/ha" and reasonable benchmarks like "top third yield for wheat for the area is 3.5 tons per hectare". The opportunity to discuss one's draft activity chart with a technical expert or fellow field officers can be a useful way to build technical skills and confidence in inexperienced agents. After finalising the activity chart, the seasonal pattern on it should be converted to an extension programme. See Table 2 for examples. Although burdensome initially, the benefits of planning out workloads in detail are that it ensures purpose, equitable delivery, a reasonable workload and adequate material resourcing for the extension agent, and allows the line manager to be explicit about key performance indicators.
It also becomes a valuable source of data on the amount and quality of the extension input made during a given year on a given farmer, rich with contact and adoption proxies for use in a farm efficiency model whose results can help to refine the next cycle of extension offerings, as explained above.
The best place to keep track of the amount and quality of extension contact that clients receive is to open a folder for each farmer in which visits can be recorded using the structure in Table 2. This will produce a record of extension input and a farm history that will be invaluable to subsequent extension staff. There are a few other practicalities to note. The three examples of visit plans provided are all fairly knowledge intensive, which should not create the impression that there is no room for what anthropologists refer to as "deep hanging out"; a meeting designed to foster a friendly and trusting relationship. However, deep hanging out cannot be the purpose of all visits and together visits must ensure that all important aspects of the activity chart is covered in every cycle. Data collection and analysis should be a planned part of the extension agent's work programme and should be closely supervised by the line manager as part of his or her human resources development strategy.
Secondly, preparing to enter a community is as important as preparing the information to be communicated. Since few extension agents will have the luxury of entering "virgin" communities, this is an opportunity to understand what farmers are doing at the moment, and why, rather than a call for a formal needs assessment (Worth, 2006). Thirdly, other service providers should be handled sensitively as an under-resourced public extension service needs all the private sector partners that it can get (Klerkx & Leeuwis, 2008). Where possible, public extension agents should attend meetings and field days held by private extension providers and should ask questions to set an example to farmers, without trying to take over the meeting. Private extension experts should be invited as speakers or guests to government field days. Finally, farmers are often squeamish about sharing financial records (Conradie & Landman, 2015; Winter, Prozesky & Esler, 2007), and although it makes good sense to begin by discussing these in private, such conversations are an important step towards getting farmers involved in research that will enable them to honestly reflect on their own performance. Efficiency analysis is a relatively impersonal way to achieve this aim.
5. CONCLUSION
Extension is such an important element of agricultural productivity growth that any productivity model which ignores it is incomplete. Extension officers must be encouraged to evaluate their own performance using these models. In the process, they will generate valuable data that could improve the quality of the research. There is no reason why extension staff cannot be trained to run their own productivity studies, but initially it will be a partnership with the resident economist.
Based on the literature review presented here, it is recommended that extension visits are programmed and that easily observed outcomes are stipulated as part of the programme. Data ought to be collected on the number and duration of visits and which programme items were covered on each occasion. Regular observation visits and occasional reflection sessions with the farmer should add up to a third of visits. Where possible, the same observation and reflection sessions should be conducted on non-participating farms or the farms of new clients, but if not, before and after performance is usually an acceptable way to measure impact. This data combined with farm financial records will be sufficient to quantify the impact of extension on farm productivity, a task that could easily be done by a general extension agent with some specialist input from an (agricultural) economist.
REFERENCES
AJEWOLE, O.C. & FOLAYAN, J.A., 2008. Stochastic frontier analysis of technical efficiency in dry season leaf vegetable production among smallholders in Ekiti State. Agric. J., 3(4):252-257. [ Links ]
AKER, J.C., 2011. Dial "A" for agriculture: A review of information and communication technologies for agricultural extension in developing countries. Agric. Econ., 42(6):631-647. [ Links ]
ALENE, A.D. & HASSAN, R.M., 2003. The determinants of farm-level technical efficiency among adopters of improved maize production technology in western Ethiopia. Agrekon, 42(1):1-14. [ Links ]
ALENE, A.D. & MANYONG, V.M., 2006. Farmer-to-farmer technology diffusion and yield variation among adopters: The case of improved cowpea in northern Nigeria. Afric. Econ., 35(2):203-211. [ Links ]
BAKHSH, K., AHMAD, B. & HASSAN, S., 2006. Food security through increasing technical efficiency. Asian J. Plant Sci., 5(6):970-976. [ Links ]
BATTESE, G.E. & COELLI, T.J., 1995. A model for technical inefficiency effects in a stochastic frontier production function for panel data. Empir. Econ., 20(2):325-332. [ Links ]
BHATTA, K.P., ISHIDA, A., TANIGUCHI, K. & SHARMA, R., 2006. Technical efficiency of rural Nepalese farmers as affected by farm family education and extension services J. Rural Econ. Special Issue:316-323. [ Links ]
BINAM, J.N., TONYE, J., NYAMBI, G. & AKOA, M., 2004. Factors affecting the technical efficiency among smallholder farmers in the slash and burn agriculture zone of Cameroon. Food Policy, 29(5):531-545. [ Links ]
BOZOGLU, M. & CEYHAN, V., 2007. Measuring the technical efficiency and exploring the inefficiency determinants of vegetable farms in Samsun province, Turkey. Agric. Sys., 94(3):649-656. [ Links ]
CHANG, H.S.C. & VILLANOZ, R., 2008. Production in the Philippines: A productivity analysis. Int. J. Poult. Sci., 7(10):940-948. [ Links ]
COELLI, T.J., 1996. A guide to FRONTIER version 4.1: A computer program for stochastic frontier production and cost function estimation. CEPA Working Paper 96/07. University of New England, Australia. [ Links ]
CONRADIE, B.I., 2016. The implications of a weak public extension service for the productivity performance of Karoo agriculture. S. Afr. J. Agric. Ext., 44(2):99-109. [ Links ]
CONRADIE, B.I., 2017. A review of stochastic production functions with inefficiency models for extensive livestock with an application to the Karoo. CSSR Working Paper 406. University of Cape Town, South Africa. [ Links ]
CONRADIE B.I., 2018. Comparing efficiency estimates from familiar stochastic frontier models. CSSR Working Paper 420. University of Cape Town, South Africa. [ Links ]
CONRADIE, B.I. & LANDMAN, A.M., 2015. Wool versus mutton in extensive grazing areas. S. Afr. J. Agric. Ext., 43(1):22-31. [ Links ]
DINAR, A., KARAGIANNIS, G. & TZOUVELEKAS, V., 2007. Evaluating the impact of agricultural extension on farms' performance in Crete: A nonneutral stochastic frontier approach. Agric. Econ., 36(2):135-146. [ Links ]
HOAG, D.L., 2005. WAEA presidiential address: Economic principles for saving the Cooperative Extension Service. J. Agr. Resour. Econ., 30(3):397-410. [ Links ]
HYUHA, T.S., BASHAASHA, B., NKONYA, E. & KRAYBILL, D., 2007. Analysis of profit inefficiency in rice production in Eastern and Northern Uganda. Afr. Crop Sci. J., 15(4):243-253. [ Links ]
ILIYASU, A., MOHAMED, Z.A., ISMAIL, M.M., AMIN, A.M. & MAZUKI, H., 2016. Technical efficiency of cage fish farming in Peninsular Malaysia: A stochastic frontier production approach. Aquac. Res., 47(1):101-113. [ Links ]
IRZ, X. & MCKENZIE, V., 2003. Profitability and technical efficiency of aquaculture Systems in Pampaanga, Philippines. Aquac. Econ. Manag., 7(3-4):195-211. [ Links ]
KARAGIANNIS, G. & TZOUVELEKAS, V., 2005. Explaining output growth with a heteroscedastic non-neutral production frontier: The case of sheep farms in Greece. Eur. Rev. Agric. Econ., 32(1):51-74. [ Links ]
KLERKX, L. & LEEUWIS, C., 2008. Matching demand and supply in the agricultural knowledge infrastructure: Experience with innovation intermediaries. Food Policy, 33(3):260-276. [ Links ]
KÜLEKÇI, M., 2010. Technical efficiency analysis for oilseed sunflower farms: A case study in Erzurum, Turkey. J. Sci. Food Agric., 90(9):1508-1512. [ Links ]
MANEVSKA-TASEVSKA, G., 2013. Farmers' knowledge attributes contribute to attaining higher farm technical efficiency: a transition economy case. The Journal of Agricultural Education and Extension, 19(1), pp.7-19. [ Links ]
MASUNDA, S. & CHIWESHE, A.R., 2015. A stochastic frontier analysis on farm level technical efficiency in Zimbabwe: A case of Marirangwe smallholder dairy farmers. J. Dev. Agric. Econ., 7(6):237-242. [ Links ]
MUTIMBA, J.K., 2014. Reflections on agricultural extension and extension policy in Africa. S. Afr. J. Agric. Ext., 42(1):15-26. [ Links ]
NAQVI, S.A.A. & ASHFaQ, M., 2013. Technical efficiency analysis of hybrid maize production using translog model case study in District Chiniot, Punjab (Pakistan). Agric. Sci., 4(10):536. [ Links ]
NDLOVU, P.V., MAZVIMAVI, K., AN, H. & MURENDO, C., 2014. Productivity and efficiency analysis of maize under conservation agriculture in Zimbabwe. Agric. Sys., 124:21-31. [ Links ]
OGUNDARI, K. & ODEFADEHAN, O., 2007. Comparative analysis of resource-productivity and technical efficiency of cocoa producers: A study of farmers under training and visit and farmer field school extension systems in Nigeria. Q. J. Int. Agric., 46(3):205-220. [ Links ]
OLOWA, O.W. & OLOWA, O.A., 2010. Maize Farmers in Osun State of Nigeria. Res. J. Appl. Sci., 5(2):115-122. [ Links ]
ONUMAH, E.E., BRÜMMER, B. & HÖRSTGEN-SCHWARK, G., 2010. Elements which delimitate technical efficiency of fish farms in Ghana. J. World Aquac. Soc., 41(4):506-518. [ Links ]
PETROVSKA, M., MANEVSKA-TASEVSKA, G. & MARTINOVSKA-STOJCHESKA, A., 2013. Pig farms in Macedonia: Assessment of the technical efficiency. Paper presented to The DAES Conference. Krsko, Slovenia. [ Links ]
RAHMAN, S., 2003. Profit efficiency among Bangladeshi rice farmers. Food Policy, 28(5-6):487-503. [ Links ]
RAHMAN, S. & HASAN, M.K., 2008. Impact of environmental production conditions on productivity and efficiency: A case study of wheat farmers in Bangladesh. J. Environ. Manage., 88(4):1495-1504. [ Links ]
RAHMAN, S. & RAHMAN, M., 2009. Impact of land fragmentation and resource ownership on productivity and efficiency: The case of rice producers in Bangladesh. Land Use Policy, 26(1):95-103. [ Links ]
SHARMA, K.R. & LEUNG, P., 2000. Technical efficiency of carp production in India: A stochastic frontier production function analysis. Aquac. Res., 31(12):937-947. [ Links ]
TERBLANCHÉ, S.E., 2008. Towards an improved agricultural extension service as key role player in the settlement of new farmers in South Africa. S. Afr. J. Agric. Ext., 37(1):58-84. [ Links ]
THEODORIDIS, A., RAGKOS, A., ROUSTEMIS, D., ARSENOS, G., ABAS, Z. & SINAPIS, E., 2014. Technical indicators of economic performance in dairy sheep farming. Animal, 8(1):133-140. [ Links ]
THEODORIDIS, A.M. & ANWAR, M.M., 2011. A comparison of DEA and SFA methods: A case study of farm households in Bangladesh. J. Dev. Areas, 45(1):95-110. [ Links ]
THERIAULT, V. & SERRA, R., 2014. Institutional environment and technical efficiency: A stochastic frontier analysis of cotton producers in West Africa. J. Agric. Econ., 65(2):383-405. [ Links ]
TIJANI, A.A., 2006. Analysis of the technical efficiency of rice farms in Ijesha Land of Osun State, Nigeria. Agrekon, 45(2):126-135. [ Links ]
WINTER, S.J., PROZESKY, H. & ESLER, K.J.E., 2007. A case study of landholder attitudes and behaviour towards the conservation of renosterveld, a critically endangered vegetation type in the Cape Floral Kingdom, South Africa. Environ. Manag., 40(1):46-61. [ Links ]
WORTH, S.H., 2006. Agriflection: A learning model for agricultural extension in South Africa. J. Agric. Educ. Ext., 12(3):179-193. [ Links ]
YOUNG, D. & DENG, H., 1999. The effects of education in early-stage agriculture: Some evidence from China. Appl. Econ., 31(11):1315-1323. [ Links ]
 Correspondence:
B. Conradie
Email:Beatrice.conradie@uct.ac.za
1 The Battese and Coelli (1995) efficiency model jointly estimates a best practice frontier and explains deviations from it (inefficiency module). In the frontier module, the dependent variable is the output and the independent variables are a small number of inputs that are assumed to have a constant elasticity of substitution if the functional form is Cobb Douglas. If the functional form is translog, different pairs of inputs can have different degrees of supplementarity or complementarity. In the original paper, the dependent variable in the inefficiency module was -uit, the level of inefficiency. In this specification, a negative sign implies an improvement in farm performance while a positive sign signals an increase in inefficiency. Battese and Coelli (1995) warned that due to the complex, non-linear error structure, the magnitude of coefficients should not be interpreted as a constant marginal effect. In another branch of the literature, two separate models are run, with the first estimating and the second explaining efficiency (Ajewole & Folayan, 2008; Petrovska, Manevska-Tasevska & Martinovska-Stojcheska, 2013), in which case all the signs revese. The reporting in Table 1 is for the Battese and Coelli (1995) specification. For more technical information consult Coelli (1996), Conradie (2017) or Conradie (2018), as well as Dinar et al (2007).

