


Services on Demand
Article
 English (pdf)
 Article in xml format
 Article references
Indicators

Related links
-
 Cited by Google
 -
 Similars in Google
Share

 Permalink
South African Journal of Agricultural Extension
On-line version ISSN 2413-3221
Print version ISSN 0301-603X
S Afr. Jnl. Agric. Ext. vol.47 n.4 Pretoria 2019
http://dx.doi.org/10.17159/2413-3221/2019/v47n4a525
ARTICLES
Agricultural Production Inputs Support Programme As A Socioeconomic Development Strategy
Mkhonto L. P.I; Musundire A.II
IManager Extension Advisor: Horticultural Crops, Limpopo Department of Agriculture and Rural Development, Polokwane, South Africa, Email: mkhontolp@agric.limpopo.gov.za
IILecturer/Researcher, Regenesys Business School, Sandton, South Africa, Email: amusundire@gmail.com
ABSTRACT
This paper presents the impact of the Agricultural Production Inputs Support Programme on crop yield, and reflects challenges and opportunities for improving agricultural production to ensure socio-economic development and sustainability. Policy-makers assume that farmers who receive subsidised agricultural inputs produce high yields, generate income to sustain production, and reduce poverty. A structured interview schedule was used to collect data from horticultural crop farmers who received agricultural production inputs from the provincial agricultural department during the 2014/15 season in Mopani District. Findings indicate no significant linear relationship between agricultural production inputs received and crop yield. In addition, there was no significant linear relationship between agricultural production practices and horticultural crop yield. However, the study observed that production practices such as soil testing for nutrient content, fertilisation, irrigation scheduling, use of hybrid seeds, and nursery propagated seedlings are critical for farmers to experience high crop yield. This highlights the importance and need to strengthen extension services to improve production practices. It is therefore concluded that provision of production inputs is a necessary strategy to ensure improved agricultural production. This study thus recommends a careful selection of recipients with skills to farm, sound farming experience, improved level of education, and capacity building of the farmers.
Keywords: Agricultural production inputs support programme, Crop yield, Production practices, Small-scale farmers
1. INTRODUCTION
This study focuses on the South African Government's Agricultural Production Inputs Support Programme (APSP) to small-scale and emerging commercial farmers. Policy-makers often assume that farmers who receive subsidised agricultural inputs produce high yields, generate income enough to sustain production, and reduce poverty (Ricker-Gilbert, Jayne & Thomas, 2011). This study aims to investigate the impact of the APSP on crop yield. The findings are important for policy development on farmer support to enhance the socio-economic development of farming communities.
The APSA is a strategy by developing countries. Governments across the globe assist small-scale farmers to acquire agricultural inputs at reduced prices or free. The programme has the potential to support national economic growth strategies by stimulating small-scale farmers' agricultural productivity and elevating food insecurity (Xu et al, 2009), creating of job opportunities, lowering food prices, and stimulating non-agricultural supply and demand (Dorward et al, 2013).
These programmes tend to be costly, and may markedly boost agricultural output. For this reason, it justifies close analysis and understanding of its impact as a socio-economic development strategy (Shively & Ricker-Gilbert, 2013:1). Furthermore, the Department of Agriculture, Forestry and Fisheries (DAFF) spends billions of Rands to assist small-scale producers to improve crop production, and enable the rural household to generate income and food insecurity. The Government Communication and Information System (GCIS) indicates that the agriculture sector contributes about 2.5% to the country's gross domestic product (GDP) and represents about 7% of formal employment (GCIS, 2015). The DAFF plans to spend over R7.9 billion to support farmers with infrastructure, production inputs and capacity-building, improved extension services, good agricultural practice farm certification, revitalisation of agriculture colleges, and disasters relief (GCIS, 2015).
2. LITERATURE REVIEW
2.1 Impact of Agricultural Production Input Support Programme
Agriculture is central to economic development, and fertilisers and agrochemicals are critical for increasing production and productivity. However, higher costs of agricultural inputs limit crop production for small-scale and emerging commercial farmers. Karamba and Winters (2015) found that both male and female farmers increased agricultural production by participation in the farmer support programme, but did not set apart female farmers to overcome gender differences.
A study conducted by Pederson, Chung and Nel (2014) to determine the microeconomic effects of a state-funded loan participation programme on farm productivity and investment supports the argument that subsidies are good for small-scale farmers. The authors found that a 1% increase in credit received by credit constrained farmers under the state loan farmer support programme increased their gross income. Furthermore, Lunduka, Ricker-Gilbert and Fisher (2013), in their evaluation of Malawi's Agricultural Production Inputs Support Programme, found a modest increase in maize production at the farm level, although there has been a large increase in the efficiency of maize production at the national level. This is attributed to the increase in the number of participants. Contrary to this finding, there was a continued relative increase in maize prices and importation of maize into the country. Jayne and Rashid (2013) considered 10 African countries' agricultural production support programmes since the mid-2000s amounting to 28.6% of the government public expenditure to agriculture, and established that the costs of production inputs support to farmers outweighed their benefits.
Mason, Jayne and Mofya-Mukuka (2013) report that in Zambia, 55% of subsidised fertilizers go to farmers with more than 2 ha of production units and ends up subsidising the wealthier households than the intended beneficiaries. Although the programme promotes the intensive production of maize, the report indicates that only 1.88 kg of maize per kg of an additional subsidised fertiliser is achieved. Ramaila, Mahlangu and Du Toit (2011) reported that Poonyth et al (2001) contests that return on investment in agriculture is far less than in the non-agriculture sector, while Ricker-Gilbert et al (2013) argue further that the inputs support programme in both Malawi and Zambia had minimal effect on the retail price of maize.
According to Dorward and Chirwa (2009), maize production in the 90th and 10th percentile of total crop output per kg of subsidised fertiliser indicates an increase of 2.61 kg and 0.75 kg of maize respectively. The researchers argued that the significance of the programme markedly boosts maize production and reduces poverty. However, Ricker-Gilbert et al (2011) report that the impact of the production inputs supports programme on Malawian well-being beyond the year of receipt applies only to crop production output, not to overall household income.
Challenges with regards to accessibility by target groups were discussed by Karamba and Winters (2015). Other challenges were discussed in various areas including farmer participation (Liverpool-Tasie, 2014), labour supply and wages (Ricker-Gilbert, 2014), retail maize prices (Ricker-Gilbert et al, 2013), farm productivity and investment (Jayne & Rashid, 2013; Lunduka et al, 2013; Pederson et al, 2014), participants livelihood (Ricker-Gilbert et al, 2011), and commercial purchases of fertilizers (Ricker-Gilbert, Jayne & Shively, 2013). Nevertheless, Labadarios et al (2011) raise concern that despite the reduction in the level of food insecurity, the proportion of people at risk of experiencing food insecurity remained practically unchanged. The rural provinces including the Eastern Cape, Limpopo, Northern Cape and North West show a higher level of food insecurity.
Although return on investment in the agricultural sector is less than in the non-agricultural sector, it remains critical since growth in agricultural productivity is important for rural development and stability and other dependent sectors such as the agro-processing industry. The review above casts doubt on this strategy to enhance small-scale and emerging commercial farmers' crop yield, income and reduce food insecurity. This research's objective is to investigate the influence of the Agricultural Production Inputs Support Programme on small-scale and emerging commercial farmers' crop yield in the Mopani District so as to outline strategies to enhance the impact of the programme.
3. METHODOLOGY
A cross-sectional time horizon survey was conducted amongst small-scale and emerging commercial farmers of horticultural crop in the Mopani District of the Limpopo Province. Saunders, Lewis and Thornhill (2016) define a research survey as a strategy for data collection. Surveys and interviews are mainly to determine the incidence, frequency and distribution of certain characteristics of a population.
3.1 Research instrument
A survey was used to collect data from the target population, through interviews using a structured interview schedule.
3.2 Research population
Saunders et al (2016) defines a population as the research subjects that the researcher wants to study; it contains all the variables of interest of the study. Data was collected from horticultural crop farmers in Mopani District of the Limpopo Province who were provided with agricultural production inputs during the 2014/15 financial year.
3.3 Sample size
The sample size was confirmed using the central limit theorem which suggests a sample size of 30 or more usually results in a sampling distribution for the mean that is very close to a normal distribution (Saunders et al, 2016).
3.4 Data analysis
Descriptive statistics and inferential statistics were used to analyse the collected data using the statistical software programme, Statistical Package for the Social Sciences (SPSS, version 25).
3.4.1 Hypothesis testing
Significant testing is used in testing the probability of a pattern or hypothesis such as the relationship between variables occurring by chance. It consists of a test statistic, degree of freedom (df), and the probability value (p-value) of the test result or more extreme occurring by chance alone. If the probability of the test statistics or more extreme having occurred by chance alone are very low or less than 0.05 (i.e. p < 0.05), then it is considered there is a statistically significant relationship between the variables. This requires the researcher to reject the null hypothesis or accept the alternate hypothesis. If the p-value is higher than 0.05 (i.e. p > 0.05), the relationship is not statistically significant. This requires the researcher to fail to reject the null hypothesis (Saunders et al, 2016).
3.4.2 Assessing the strength of relationships between two variables
To assess the strength of the relationship between two variables, the correlation coefficient is used to quantify the strength of the linear relationship between two ranked or numeric variables. A +7 value represents a perfect positive correlation while a -1 value represents a perfect negative correlation. This means that if the variables are related, if the value of one increases, the value of the other increases too and vice versa respectively. Correlation coefficient values between +7 and -7 represent weaker positive and negative correlations respectively while a value of 0 indicates a perfect independence (Saunders et al, 2016).
3.4.3 Assessing the strength of numerical dependent and independent variables
To assess the strength of a numerical dependent variable and a numerical independent variable (cause-effect relationship), the coefficient of determination is used. The coefficient of determination (r2) takes the value of 0 and +1. They measure the proportion of variation in a dependent variable that can be statistically explained by the independent variable. If all the variations can be explained, r2= 1; if 50 % can be explained, r2= 0.5; and if none can be explained, r2 = 0. The process of calculating the coefficient of determination and regression equation using one or more independent variable is known a regression analysis or multiple regression analysis respectively (Saunders et al, 2016).
4. RESULTS AND DISCUSSION
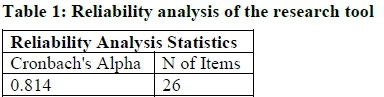
The Cronbach's alpha is used to measure the consistency of responses across a set of questions designed together to measure a particular concept. It consists of an alpha coefficient with a value between 0 and 1. Values of 0.7 or above suggest that the questions in the scale/ concept are measuring the same thing (Saunders et al, 2016).
In the study, the reliability analysis results revealed a Cronbach's alpha of 0.814 (Table 1) implying that the research tool is very reliable.
4.1. Demographic information
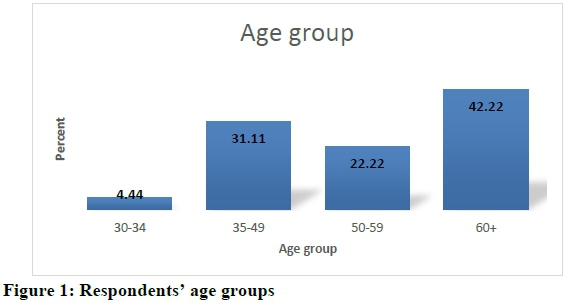
The study shows that all participants (100%) received agricultural production inputs from the Limpopo Department of Agriculture and Rural Development (LDARD) farmer support programme. Furthermore, 76% of the participants were male and 24% were female. The age group of above 60 years of age constitutes 42% of the sample, while the remaining groups made up the rest of the sample as follow: 50-59 years (22%), 35-49 years (31%), and 30-34 years (4.5%). There were no respondents in the age group of 29 years and lower (Figure 1).
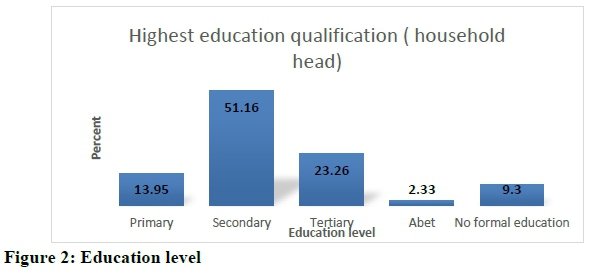
Furthermore, the data indicates that 88.9% of the respondents are married, 8.9% not married and 2.2% are windowed. The most spoken languages are Sotho (53.3%), Tsonga (42.2%), English (2.2%), and the combination of Tsonga and Sotho (2.2%). The highest educational qualification is secondary schooling at 51.16%, tertiary education (23.26%), primary schooling (13.95%), without formal schooling (9.3%), and 2.33% with Adult Basic Education and Training (ABET) as indicated in (Figure 2).
The majority of the respondents (83.7%) make their living through full-time farming. Overall farming experience ranged between four and 30 years.
Farming experience (Figure 3) peaks at the 6-10 years category and is followed by those with less than 5 years of farming experience.
4.2 Inferential statistical analysis
This section deals with the impact of the APSP on horticultural crop yield.
Hypothesis Statement: H1o: The agricultural inputs support programme has no impact on horticultural crop yield.
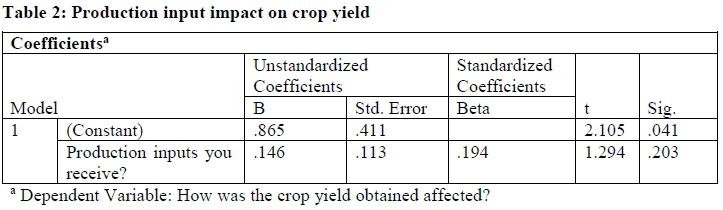
A regression analysis approach was used to test for the impact of the agricultural inputs support programme on horticultural crop yield. This is useful to determine the strength of a cause and effect relationship between dependent and independent variables (Saunders et al, 2016).
There was no significant linear relationship (p=0.203, >0.05) between agricultural inputs received from the support programme and crop yield. The R-square value for the model is only 3.7%, which is negligible. This indicates a lack of evidence for a cause-effect relationship between the agricultural inputs received and changes in the crop yield.
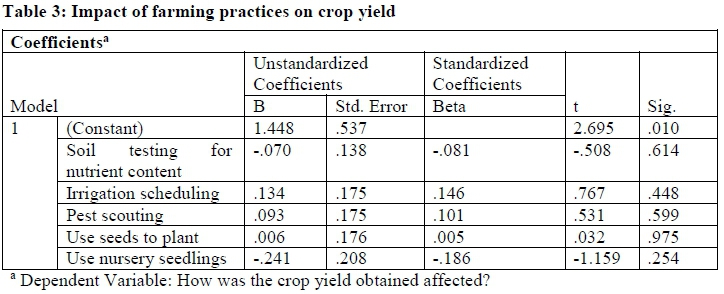
Regression analysis was further used to test for the impact of the agricultural production practices used by the farmers and horticultural crop yield.
There was no significant linear relationship (p=0.655, >0.05) between agricultural production practices used by the farmers and their horticultural crop yield. The R-square value for the model is only 8%, which is negligible. The p-values for all the agricultural practices used by the farmers are greater than 0.05, indicating that there is no cause-effect relationship between the agricultural practices used by the farmers and changes in the crop yield.
4.3 Testing and describing the association between variables: Farming practices
In this section, a cross-tabulation was used together with clustered bar charts. Cross-tabulation is a statistical tool that is used to analyse categorical data. The clustered bar charts provide a pictorial view of the association between variables and this helps in checking for interdependence or an association between variables of interest. Variables of interest for this study include crop yield and farming practices (i.e. soil testing, irrigation scheduling, pest scouting, use of hybrid seeds, and use of nursery propagated seedlings).
The majority of small-scale farmers who practice soil testing for nutrient content experienced an increase in the volume of their crops (Figure 4).
Figure 5 indicates that the majority of small-scale farmers (over 70%) who practice fertiliser application experience an increase in the volume of their crops.

Figure 6 shows that small-scale farmers who practice irrigation scheduling experienced an increase in the volume of their crops.

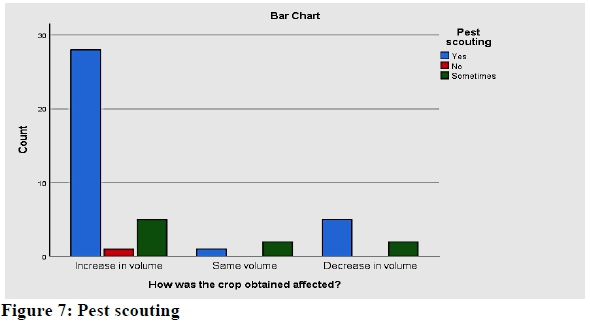
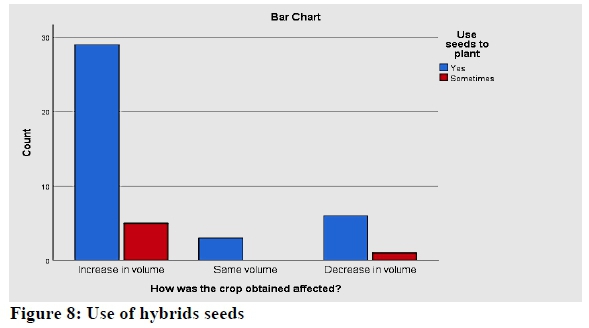
Figure 7 shows that the majority of small-scale farmers who practice pest scouting experienced an increase in the volume of their crops. In addition, Figure 8 shows that the majority of small-scale farmers who practice the use of hybrid seeds to plant experienced an increase in the volume of their crops.
Figure 9 indicates that the majority of small-scale farmers (over 65%) who practice the use of nursery seedlings to plant experienced an increase in the volume of their crops.

5. CONCLUSION AND RECOMMENDATIONS
This study compares the impact of the APSP on crop yield. There was no significant linear relationship between agricultural production inputs received and crop yield. This indicates a lack of evidence for a cause-effect relationship between the production inputs received and changes in the crop yield. There was also no significant linear relationship between agricultural production practices used by the farmers and their horticultural crop yield. This indicates that there is no cause-effect relationship between the agricultural practices used by the farmers and changes in the crop yield. Taking into account the null hypothesis, the Agricultural Production Inputs Support Programme has no impact on horticultural crop yield.
The researcher therefore fails to reject the null hypothesis. This is in line with the findings that argues the significance of the programme to markedly boost crop production and reduce poverty since maize production in the 90th and 10th percentile of total crop output per kg of subsidised fertiliser indicates a marginal increase of maize yield. This trend of fertiliser use and low crop output raises the question of the ability of the small-scale farmers to effectively use agro-chemicals. Therefore, the role of extension services by all stakeholders is brought into disrepute.
However, it was observed that soil testing for nutrient content, fertiliser application, irrigation scheduling, use of hybrid seeds, and the use of seedling to plant is important for small-scale farmers to experience an increase in the volume of their crops. The contradictory findings in this study may however be related to the integrity of the respondents to the questionnaire. The study has revealed a gender disparity in the provision of agro-chemicals to small-scale farmers as implemented through the production input support programme. The current generation of farmers is above the age of 50 years with less the 11 years of schooling. The low level of education may result in the inability to take their farming businesses to commercialisation which is needed for the improved socio-economic status of society.
Small-scale farmers rely on government sponsored extension services and/ or own farming experience. The current results indicate that the majority of farmers have an adequate number of years' farming experience and these farmers attend crop production study groups and have access to extension services. However, the lack of a causal relationship between the support provided (production inputs and extension services) and crop yields is worrisome. This could perhaps be due to the mismatch of the calibre of farmers and programme expectation.
As such, more emphasis should be placed on the selection of beneficiaries to promote gender equity, focus and attract graduates and experienced candidates in farming. Development of selection criteria and classification systems of recipients is suggested. It is advisable to support small-scale farmers, however, a reporting mechanism to identify progressive farmers is a necessity. An incubator programme in partnership with the private sector is thus suggested.
Furthermore, production practices are found to be instrumental in increasing crop yield by the farmers. Good agricultural practices demand adherence to these production practices at all times. The delivery of advisory support and farming to meet the national objectives is highly dependent on human resource capacity and finance. Therefore, there is a need to continuously improve human resource capacity in terms of competence, skills and qualifications to render high quality services to farmers. Thus, comprehensive farmer training, monitoring and accountability are suggested. Moreover, training programmes provide valuable information, skills and knowledge for the farmer, and study groups help farmers to resolve farming issues together, which indicates that farmer experience is critical for farm productivity. Although farming experience is sufficient for the participants, the low level of education might be a hindrance for planning and organisation for efficient production at a farm level. It is plausible that the entrepreneurial spirit of the farmer is the one factor overlooked in many previous studies.
Programmes such as the APSP requires stronger extension services. The low level of farming skills and the indication that the majority of government extension and advisory service officers have a diploma or lower qualification may be contributory to low levels of success. According to the National Development Plan for South Africa, there is a need for the training of a new cadre of agricultural extension advisors that will respond effectively to the needs of smallholder farmers. An effective and efficient extension and advisory service is essential for successful rural development in South Africa. Knowledge sharing is critical to support social, economic and environmental development, and extension is a vital knowledge-sharing institution.
REFERENCES
DORWARD, A., CHIRWA, E., MATITA, M., MHANGO, W., MVULA, P., TAYLOR, E. & THORNE, K., 2013. Evaluation of the 2012/13 farm input subsidy programme, Malawi. Available from: http://eprints.soas.ac.uk/17822/ [ Links ]
DORWARD, A. & CHIRWA, E., 2009. The agricultural input subsidy programme 2005 to 2008: Achievements and challenges. Available from: https://core.ac.uk/download/pdf/2791290 [ Links ]
GOVERNMENT COMMUNICATION AND INFORMATION SYSTEM (GCIS), 2015. South African Yearbook, Agriculture, Forestry and Fisheries. Available from: https://www.gcis.gov.za/content/resourcecentre/sa-info/yearbook2015-16 [ Links ]
JAYNE, T.S. & RASHID, S., 2013. Input subsidy programs in sub-Saharan Africa: A synthesis of recent evidence. Agric. Econ., 44(6):547-562. [ Links ]
KARAMBA, R.W. & WINTERS, P.C., 2015. Gender and agricultural productivity: Implications of the farm input subsidy program in Malawi. Agric. Econ., 46(3):357-374. [ Links ]
LABADARIOS, D., MCHIZA, Z.J.R., STEYN, N.P., GERICKE, G., MAUNDER, E.M.W., DAVIDS, Y.D. & PARKER, W., 2011. Food security in South Africa: A review of national surveys. Available from: http://www.who.int/bulletin/volumes/89/12/11-089243/en/ [ Links ]
LIVERPOOL-TASIE, L.S.O., 2014. Fertilizer subsidies and private market participation: The case of Kano State, Nigeria. Agric. Econ., 45(6):663-678. [ Links ]
LUNDUKA, R., RICKER-GILBERT, J. & FISHER, M., 2013. What are the farm-level impacts of Malawi's farm input subsidy program? A critical review. Agric. Econ., 44(6):63-579. [ Links ]
MASON, N.M., JAYNE, T.S. & MOFYA-MUKUKA, R., 2013. Zambia's input subsidy programs. Agric. Econ., 44(6):613-628. [ Links ]
PEDERSON, G., CHUNG, W. & NEL, R., 2014. Microeconomic impacts of a state-funded farmer loan program. Agr. Finance Rev., 72(1):5-21. [ Links ]
POONYTH, D., HASSAN, R., KIRSTEN, J.F. & CALCATERRA, M., 2001. Is agricultural sector growth a precondition for economic growth? The case of South Africa. Agrekon, 40(2):269-279. [ Links ]
RAMAILA, M., MAHLANGU, S. & DU TOIT, D., 2011. Agricultural productivity in South Africa: Literature review. DAFF Report. Pretoria, South Africa. [ Links ]
RICKER-GILBERT, J., 2014. Wage and employment effects of Malawi's fertilizer subsidy program. Agric. Econ., 45(3):337-353. [ Links ]
RICKER-GILBERT, J., JAYNE, T. & SHIVELY, G., 2013. Addressing the "wicked problem" of input subsidy programs in Africa. Appl. Econ. Perspect. Policy, 35(2):322-340. [ Links ]
RICKER-GILBERT, J., JAYNE, J. & THOMAS, S., 2011. What are the enduring effects of fertilizer subsidy programs on recipient farm households? Evidence from Malawi. Available from: http://ageconsearch.umn.edu/ [ Links ]
RICKER-GILBERT, J., MASON, N.M., DARKO, FA. & TEMBO, S.T., 2013. What are the effects of input subsidy programs on maize prices? Evidence from Malawi and Zambia. Agric. Econ., 44(6):671-686. [ Links ]
SAUNDERS, M., LEWIS, P. & THORNHILL, A., 2016. Research methods for business students. 7th ed. Italy: Pearson Education Limited. [ Links ]
SHIVELY, G.E. & RICKER-GILBERT, J., 2013. Measuring the impacts of agricultural input subsidies in Sub-Saharan Africa: Evidence from Malawi's farm input subsidy program. GPRIPolicy Briefs, 1(1):1-8. [ Links ]
XU, Z., BURKE, W.J., JAYNE, T.S. & GOVEREH, J., 2009. Do input subsidy programs "crowd in" or "crowd out" commercial market development? Modelling fertilizer demand in a two-channel marketing system. Agric. Econ., 40(1):79-94. [ Links ]
 Correspondence:
L. P. Mkhonto
Email: mkhontolp@agric.Hmpopo.gov.za

