


Serviços Personalizados
Artigo
 Inglês (pdf)
 Artigo em XML
 Referências do artigo
Indicadores

Links relacionados
-
 Citado por Google
 -
 Similares em Google
Compartilhar

 Permalink
South African Journal of Agricultural Extension
versão On-line ISSN 2413-3221
versão impressa ISSN 0301-603X
S Afr. Jnl. Agric. Ext. vol.47 no.2 Pretoria 2019
http://dx.doi.org/10.17159/2413-3221/2019/v47n2a507
ARTICLES
Socio-economic Factors Influencing Adoption Of Conservation Agriculture In Moroto District, Uganda
Esabu A.I; Ngwenya H.II
ICenter for Sustainable Agriculture, Rural Development & Extension, University of the Free State, P.O. Box 339 Bloemfontein, South Africa. Email: aesabu@gmail.com
IICenter for Sustainable Agriculture, Rural Development & Extension, University of the Free State, P.O. Box 339 Bloemfontein, South Africa. Email: hngwenya22@gmail.com
ABSTRACT
This research was conducted to assess socio-economic factors influencing adoption of conservation agriculture in Moroto District of Uganda. The socio-economic factors, the level of conservation agriculture, and the constraints faced by the farmers were assessed. A cross-sectional research design was utilised to collect data from 80 farmers (adopters and non-adopters of conservation agriculture). Purposive random sampling was applied to select seven key informants in the two sub-counties of Katikekile and Nadunget, and four villages of Nakodet, Nakwanga, Napudes and Komare. Data were collected through personal observation, interviews, focus group discussions, and structured questionnaires. The Statistical Package for Social Sciences (SPSS) was used to generate descriptive and inferential statistics for quantitative data analysis. The binary probit model was used to determine the socio-economic factors influencing adoption of conservation agriculture. The findings indicate that there was a significant influence for gender (p<0.01), but a statistically significant influence for credit and extension services (p<0.05). Finally, the adoption rate of conservation agriculture is still low given the size of land dedicated to it by most farmers. Therefore, this study recommends that government and other institutions should strengthen the agricultural extension system, provide financial support and incentives, and sensitize farmers on conservation agriculture.
Keywords: Adoption, Conservation agriculture, Moroto District, Socio-economic factors, Uganda
1. INTRODUCTION
Agriculture is the backbone of economic growth for many sub-Saharan African countries (Adolwa et al, 2012). It employs about 60% of the region's labour force and accounts for 25% or more of the gross domestic product (United Nations Department of Public Information (UNDPI), 2014). The world population of 7.3 billion in 2015 is projected to rise to 9.7 billion by 2050 (United Nations Department of Economic and Social Affairs (UNDESA), 2015). Global agricultural production is expected to increase by 60% in 2050, given both the food consumption and population growth (Food and Agriculture Organisation (FAO), 2012). Sub-Saharan Africa would experience this challenge more severely (Van Ittersum et al, 2016), with its population projected to approach 2.48 billion by 2050 from the current 1.23 billion (Worldometers, 2017). Agricultural production in sub-Saharan Africa is particularly vulnerable to the effects of climate change, with rain fed agriculture accounting for approximately 96% of the overall crop production (World Bank, 2015). This is coupled with accelerated land degradation and soil fertility deterioration (Derpsch, 2008).
In order for agriculture to respond optimally to the future challenges, new innovations will not only need to increase on effectiveness with which inputs are turned into outputs, but also to preserve scarce resources and decrease waste (Troell et al, 2014). This can be achieved through the promotion of sustainable policies and the provision of support to institutions that can provide farmers with incentives and the services required to adopt conservation agriculture (CA) practices and improve them over a given period of time (Kassam et al, 2009). In practice, CA involves the simultaneous application of minimal soil disturbance, retention of crop residues as mulch on the soil surface, and the use of crop rotations and/ or associations (Corbeels et al, 2014; FAO, 2016). In Uganda, although the benefits derived from CA has been promoted by government agencies and non-government organisations, its adoption is still low (Osiru, 2013). For example, Birungi and Hassan (2007) reported that 27.9% of farmers sampled throughout Uganda use traditional methods of enhancing soil fertility. Studies have been conducted in Uganda on the determinants of farmers' preferences for attributes of CA. However, to date, little or no study has been conducted on the socio-economic factors influencing adoption of CA in Uganda. Thus, this study is intended to determine the factors that enhance or hinder the adoption of CA in the Moroto District of Uganda.
2. METHODOLOGY
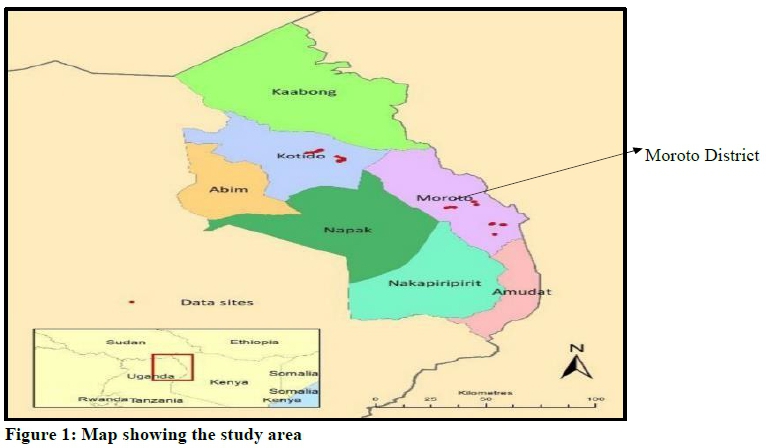
2.1 Description of the study area
Moroto District is located in the north-eastern region of Uganda. The district is made up of Matheniko County and Moroto Municipality. It is composed of six sub-counties which include Katikekile, Nadunget, Rupa, Tapac, North and South Division (Uganda Bureau of Statistics (UBOS), 2013). The district forms part of Karamoja sub-region and covers an area of 3538 km2.
It borders Kaabong District in the North, Kotido District in the North-West, Napak District in the West, Nakapiripirit District in the South-West, Amudat District in the South, and the entire eastern borderline is shared with the Republic of Kenya (UBOS, 2013). The coordinates of the district are 020 32'N, 34040'E.
The district experiences a semi-arid type of climate with sporadic uni-modal rainfall patterns occurring between May and August and an intensely hot, dry season occurring from November to March (BakamaNume, 2010). Rainfall in the area ranges from 350 to 1000 mm per annum and is available in time and space (Nalule, 2010). The total annual rainfall allows the district to be characterised as a sub-humid system. The temperatures in the district are high, ranging from a maximum of 28 to 32.5 °C, with an average minimum of between 15 and 18 °C (Mubiru, 2010). The vegetation is dominated by indigenous tropical grasses and the Acacia species (Egeru et al, 2014).
The majority of the population relies on livestock rearing and in years of adequate rainfall, people grow groundnuts, sorghum, millet and cassava (UBOS, 2009). According to the 2014 National Population and Housing Census, the district has a total population of 104 539 (UBOS, 2014).
2.2 Sampling and sample size determination
A multi-stage sampling technique was used to select the target areas as well as the respondents. Sub-counties and villages in the district were stratified based on the estimated population of famers practicing CA. Hence, two sub-counties (Nadunget and Katikekile) and four villages (Nakodet, Nakwanga, Napudes and Komare) were selected. For the selection of respondents to be included in the cross sectional survey, the choice-based sampling scheme was used which involves stratifying the population based on the dependent variable; in this case, CA practice (Donkers, Franses & Verhoef, 2003). Choice based sampling is particularly useful when the outcome to be explained is rare (Cram, Karan & Stuart, 2009). The households within the selected sub-counties were grouped into two categories, namely those practicing CA (adopters) and those not practicing CA (non-adopters).
To determine the number of non-adopters to be interviewed within the second category, a probability formula was adopted from Saxena et al (2010). That is n=z2×p×q╱e2n=z2p×q╱e2 where n is the required sample size, z is 1.96 at 95% level of confidence, P is 0.95 (which is approximately 95% and accommodates the margin of households not practicing CA in Moroto District) and q = 1 - p, i.e. 0.5, and e = 0.05 (which is the margin error at 5%). Therefore, a total of 80 households were sampled of which 40 practiced CA and 40 did not.
Primary data were collected through the use of questionnaires, interviews, physical observation, checklists, and focus group discussions. Secondary data were obtained from the district production office, sub-county agricultural office and from The Deutsche Gesellschaft für Internationale Zusammenarbeit (GIZ) on the status of CA in the four selected villages of study.
2.3 Data processing and analysis
All the collected data from the respondents were first entered into Microsoft Excel to enhance proper coding of the data and then exported to the software programme, Statistical Package for Social Sciences (SPSS) for analysis using descriptive statistics (frequency distribution, means and percentages) as well as inferential statistics.
The study analysed the socio-economic factors influencing adoption of CA using a binary choice model, namely the probit regression model. This model was chosen since the dependent variable is binary in nature and takes a value of 0 or 1. Furthermore, the probit model is suitable for estimating parameters of interest when the dependent variable is not fully observed. The probit model constrains the probability to a 0, 1 interval and assumes that an event will occur is non-linear and that the random error terms follow a normal distribution.
The model is based on the probability of success of an event which in this case is the decision to adopt CA. The probability that an individual will choose to adopt CA depends on an underlying response variable that the expected utility from adoption of CA is greater than the utility of non-adoption. The random utility function (y*) for a farmer in Moroto District facing a decision to adopt CA can be specified in equation 1.

Where Y is a dummy variable capturing households ownership of CA (1 = if household has adopted CA, 0 = otherwise), β = (β0, β1, β2…… ) is a vector of unknown parameters, i is the choice of the practice, xi is a vector of covariates (explanatory variables), that is socio-economic and demographic characteristics of the individual, and ε is the error term.
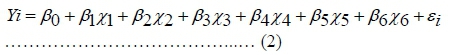
The empirical model that determines factors influencing the farmer's decision to adopt CA is specified in equation 2. A household (i) makes a decision to adopt CA (Yi) if the expected utility from CA adoption is positive. Household adoption of CA is associated with socio-economic and institutional characteristics that can be described as follows:
Where:
Y = If the farmer had adopted CA or not
 = Constant
 = Coefficient of independent variable
 = Age (year)
 = Gender (1 if male or 0 if otherwise)
 = Education level (number of years spent in school)
 = Credit (1 if respondent has access to credit, 0 if otherwise)
 = Farming experience (years)
 = Extension services (1 if yes, 0 if otherwise)
 = Random error term
3. RESULTS AND DISCUSSION
3.1 Demographic and socio-economic characteristics of the respondents
3.1.1 Age of the respondents
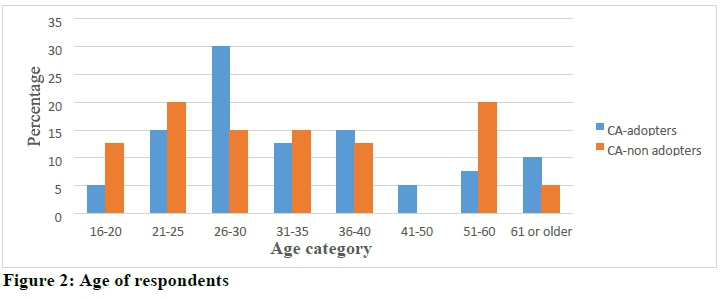
Farmers were divided into age groups, ranging from 16 to over 60 years of age. The largest proportion (30%) of adopters of CA fell within the age group of 26 to 30 years. Furthermore, 15% of the adopters fell within the 21-25 age group as well as the 36-40 age group. There were no non-adopters falling in the age group of 41-50 years. Among those who were in the 61 and above age category, 10% had adopted CA, while 5% had not (Figure 2). It is clear from the results that both young and older people had adopted CA. The reason could be that young people have more ability to acquire information about new technologies while older people might have accumulated a lot of experience concerning the profitability of the farming system to adopt. Similar results were reported by Giller et al (2009).
3.1.2 Educational level of the respondents
The findings show that the majority of adopters (65%) and non-adopters (77.5%) had not attained any formal education. Only a small proportion (12.5%) of adopters and non-adopters (15%) had reached primary level. The adopters who had acquired secondary education comprised of 22.5% of the sample (Table 1). It can be seen that highly educated farmers have not adopted CA and the reason for this could be due to the fact that higher education is associated with increased specialisation of technical skills that makes CA less attractive to them. Moreover, the adoption rate for those who had not attained any education level was high because of increased adult literacy education and participatory methods in the area which improves on their knowledge to implement CA. This finding is consistent with Matata et al (2010), who observed that if a large number of farmers can read and write, they would be able to follow technical recommendations.
3.1.3 Gender of the respondents
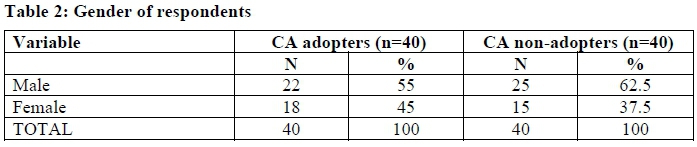
Table 2 shows that 55% of the CA adopters were male and 62.5% of the non-adopters were also male. Females were less well represented with 45% of adopters and 37.5% of non-adopters. In general, the findings indicate that more males had adopted CA as compared to their female counterparts. This could be attributed to women in the Moroto District having less access to resources and labour as compared to males, which would limit their adoption for CA. This finding is consistent with Giller et al (2009), who reported that the female-headed households were less likely to adopt CA due to labour constraints. The results are also consistent with that of Jera and Ajayi (2008) who argued that because traditional power structures and controls over household productive resources is less favourable towards women, they may respond less positively to new technology than male-headed households.
3.1.4 Awareness of the famers about conservation agriculture
Table 3 indicates farmers' awareness of CA. When farmers were asked about whether they have heard about CA, all of the adopters and three quarters of the non-adopters said that they were aware of CA. Only 25% of the non-adopters had not heard about CA. The high percentage of CA awareness is due to the presence of government and NGO's in the district which provides CA advisory services to the farmers. These findings agree with Langyintuo and Mungoma (2008) who also stated that the presence of NGO's increased farmers' awareness of CA practices such as crop rotation in Zimbabwe.
3.1.5 Perception of the farmers about conservation agriculture
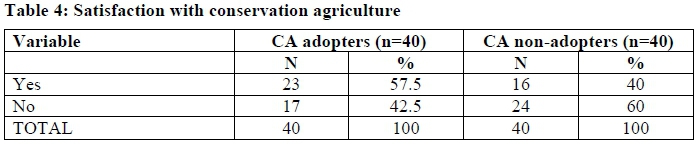
Even though some farmers had not adopted CA, the majority of participants (57.5%) were satisfied with CA (Table 4). Participants' reasons for satisfaction was because CA reduces soil erosion and improves agricultural productivity. These reasons are in line with results reported by Mazvimavi et al (2010).
3.2 Level of conservation agriculture adoption
3.2.1 Conservation agriculture principles being practiced by the farmers
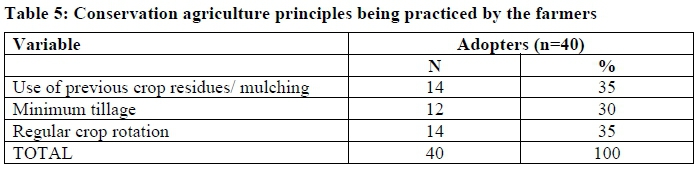
The results show that 35% of the farmers were practicing crop rotation and retention of crop residues. A further 30% of the farmers were practicing minimum tillage (Table 5). Even though the majority of the farmers were practicing crop rotation and retention of crop residues, it implies that CA adoption rate is still low and most of the farmers are still practicing conventional agriculture. This is because famers have not yet fully attained the necessary knowledge and skills for CA. Furthermore, farmers do not often adopt all three CA principles initially, hence adoption becomes a stepwise process. These results are in agreement with Jat, Wani and Sahrawat (2012) who reported that crop residues and no tillage became widely used in South Asia after a period of 10 to 15 years of testing that led to a partial increase in farmers' knowledge and availability of adequate implements.
3.2.2 Total size of land dedicated to conservation agriculture
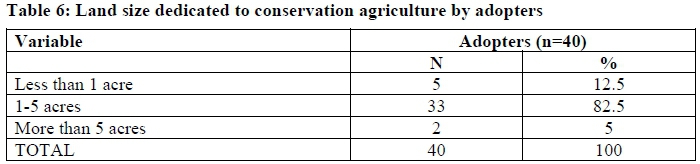
When the adopters were interviewed on the size of land they had dedicated to CA, the majority (82.5%) had allocated 1-5 acres of land for CA (Table 6). CA was first introduced and promoted in the area by government and local NGO's in 2008. The acreages allocated to CA is increasing as the number of years of practicing CA increases and more knowledge and experience is accumulated on CA. Therefore, the possibility of expanding land for CA increases as farmers realise high crop yields, reduced labour, and soil quality improvement. The results are consistent with Meijer et al (2015) who reported on the role of information, knowledge and attitude on adoption of agricultural and forestry innovations in sub-Saharan Africa.
3.3 Constraints to using conservation agriculture
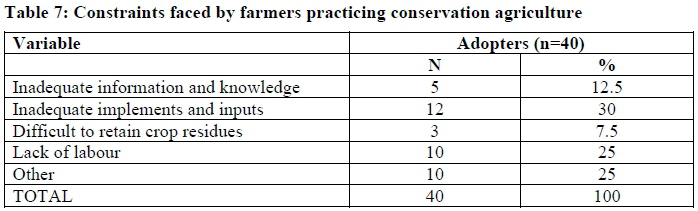
The results in Table 7 indicate that limited information and knowledge was mentioned by CA adopters (12.5%) as a challenge during implementation of CA. According to Liniger et al (2011), a lack of information and knowledge is considered a major factor which hinders the adoption of CA.
A lack of implements and inputs was recorded as a major challenge facing CA farmers by the largest proportion of CA adopters (30%). This finding implies that most farmers are relying on the use of a hand hoe and do not have sufficient farm power and machinery such as ripper planters, sub-soilers, and farm inputs such as herbicides which affects adoption of CA. This finding is consistent with Shetto and Owenya (2007) who reported that inadequate machinery and farm power hinders the adoption of CA in Tanzania.
Out of the 40 adopter farmers who were interviewed, 7.5% mentioned difficulty in retaining crop residues to their fields after harvest. The reason is simply because the major of economic activity in the Moroto District is livestock rearing and therefore crop residue is used for feeding livestock, especially in the dry season when pastures are scarce. The results are in line with that of Rufino et al (2011) who reported that crop residues were difficult to retain for CA amongst the smallholder farmers in the tropics since it is needed to provide livestock feed during the dry season.
Only 25% of CA adopters mentioned a lack of sufficient labour as one of the challenges they face. Since CA is a labour-intensive technology, this hinders the adoption of CA. This finding is consistent with Chiputwa, Langyintuo and Wall (2011) who found that labour intensity reduces adoption of some CA practices.
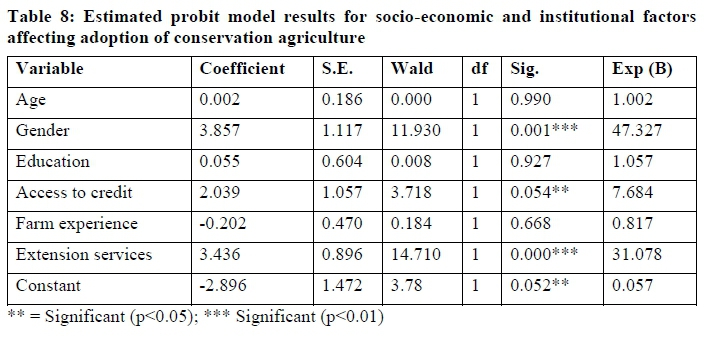
3.4 Socio-economic and institutional factors affecting adoption of conservation agriculture
The probit regression model was used to analyse the socio-economic and institutional factors affecting adoption of CA. The dependent variables were whether the famers had or had not adopted CA, while the independent variables were age, gender, education level, access to credit, farming experience, and extension services.
The results revealed that factors which significantly affect adoption of CA were gender of the farmer (p<0.05), access to credit (p<0.01), and extension services (p<0.01), while other factors were not significant.
3.4.1 Gender
As hypothesised, gender of the farmers had a positive impact on adoption of CA and it is statistically significant at the 1% level. As previously mentioned, 55% and 62.5% of the adopters and non-adopters were male respectively. CA requires a significant input in labour for maintenance which results in the male-headed households having better access to capital and labour, making them more likely to adopt CA. These results agree with previous studies where researchers showed that male farmers are resource endowed by virtue of their cultural settings and are more likely to adopt a new technology (Baffoe-Asare, Danquah & Annor-Frempong, 2013).
3.4.2 Access to credit
Access to credit was found to be significant (p<0.05), implying that farmers who have access to credit are more likely to adopt CA than those who do not. Credit is required for hiring of labour and the purchase of agricultural inputs. The current results are consistent with Humphreys et al (2008) who stated that access to credit by farmers enhances their purchasing power and this in turn may increase purchases of improved seeds and inorganic fertilizers with consequent adoption.
3.4.3 Extension services
Extension services shows a positive correlation with adoption of CA and was significant at the 5% level. This is due to the fact that famers get exposed to new information, which decreases information irregularities that is associated with the new technology, and hence the majority of the farmers are aware of the technology and are willing to take risks which are associated with it. This finding is consistent with Kassie et al (2009) who reported that access to information on new technologies is crucial to creating awareness and positive attitudes towards technology adoption.
4. CONCLUSION
Current research findings revealed that access to extension services and credit, as well as the gender of farmers influences their decision to adopt or not to adopt CA. Other socio-economic factors such as age and education did not significantly influence the adoption of CA.
The level of CA adoption is still low as only a few farmers are practicing crop rotation, retention of crop cover, and use of minimum tillage. Furthermore, they are farming on less than 5 acres of land. Finally, inadequate implements and inputs was highlighted by participating farmers as the main challenge faced by CA famers.
5. RECOMMENDATIONS
The following recommendations are highlighted by the authors:
1. Increased awareness of the social, economic, and environmental benefits which are derived from the use of CA amongst the farmers.
2. Provide training to the new and existing agricultural extension officers in relevant departments.
3. Mainstreaming of CA in relevant government ministries and other departments which are supported through the provision of human, material, and financial resources in order to ensure that famers receive timely and effective support from well-motivated and trained agricultural extension officers.
4. The enhancement of adaptive research to modify CA principles to the local conditions.
5. Gender mainstreaming in agricultural extension whereby women are included in extension advisory services and have access to farm resources.
6. Provision of seeds and other farm inputs, especially chemicals and fertilizers, at a subsidised cost and reduction of tariffs on imported CA implements to encourage and promote their availability.
REFERENCES
ADOLWA, I.S., OKOTH, P.F., MULWA, R.M., ESILABA, A.O., MAIRURA, F.S. & NAMBIRO, E., 2012. Analysis of communication and dissemination channels influencing the adoption of integrated soil fertility management in Western Kenya. J. Agric. Edu. Ext., 18(1):71-86. [ Links ]
BAFFOE-ASARE, R., DANQUAH, J.A. & ANNOR-FREMPONG, F., 2013. Socioeconomic factors influencing adoption of CODAPEC and cocoa high-tech technologies among small holder farmers in Central Region of Ghana. Am. J. Exp. Agric., 3(2):277-292. [ Links ]
BAKAMANUME, B.B., 2010. A contemporary geography of Uganda. Dar es Salaam: Mkukina Nyota Publishers. [ Links ]
BIRUNGI, P.B. & HASSAN, R.M., 2007. Impact of alternative land management options on soil fertility and erosion in Uganda. Agrekon, 46(3):410-424. [ Links ]
CHIPUTWA, B., LANGYINTUO, A.S. & WALL, P., 2011. Adoption of conservation agriculture technologies by smallholder farmers in the Shamva district of Zimbabwe: A tobit application. Paper presented to the 2011 meeting of the Southern Agricultural Economics Association (SAEA). Texas: United States of America. [ Links ]
CORBEELS, M., SAKYI, R.K., KŰHNE, R.F. & WHITBREAD, A.M., 2014. Meta-analysis of crop responses to conservation agriculture in sub-Saharan Africa. CCAFS Report. Copenhagen: Denmark. [ Links ]
CRAM, D.P., KARAN, V. & STUART, I., 2009. Three threats to validity of choice-based and matched sample studies in accounting research. Contemp. Account. Res., 26(2):477-516. [ Links ]
DERPSCH, R., 2008. No-tillage and conservation agriculture: A progress report. In: No-till farming systems: Special publication (pp.7-39). Bangkok: World Association of Soil and Water Conservation. [ Links ]
DONKERS, B., FRANSES, P.H. & VERHOEF, P.C., 2003. Selective sampling for binary choice models. J. Mark. Res., 40(4):492-497. [ Links ]
EGERU, A., WASONGA, O., KYAGULANYI, J., MAJALIWA, G.M., MACOPIYO, L. & MBURU. J., 2014. Spatio-temporal dynamics of forage and land cover changes in Karamoja sub-region, Uganda. Pastoralism, 4(1):1-21. [ Links ]
FOOD AND AGRICULTURAL ORGANISATION (FAO), 2012. The State of Food Insecurity in the World (SOFI). Rome: Italy. [ Links ]
FOOD AND AGRICULTURAL ORGANISATION (FAO), 2016. What is conservation agriculture? Available from: http://www.fao.org/ag/ca/1a.html [ Links ]
GILLER, K.E., WITTER, E., CORBEELS, M. & TITTONELL, P., 2009. Conservation agriculture & small holder farming in Africa: The heretics' view. Field Crops Res., 114(1):23-24. [ Links ]
HUMPHREYS, E., TUONG, T.P., GOMEZ-MACPHERSON, H., TABO, R., AWULACHEW, S.B. & BEDIAKO, J., 2008. Increasing the productivity and sustainability of rainfed cropping systems of poor, smallholder farmers: Overview of recent findings from the challenge program on water and food. International Workshop on Rainfed Cropping Systems. Tamale: Ghana. [ Links ]
JAT, R.A., WANI, S.P. & SAHRAWAT, K.L., 2012. Conservation agriculture in the semi-arid tropics: Prospects and problems. Adv. Agron., 117:191-273. [ Links ]
JERA, R. & AJAYI, O.C., 2008. Logistic modelling of smallholder livestock farmers' adoption of tree-based fodder technology in Zimbabwe. Agrekon, 47(3):379-392. [ Links ]
KASSAM, A., FRIEDRICH, T., SHAXSON, F. & PRETTY, J., 2009. The spread of conservation agriculture: Justification, sustainability and uptake. Int. J. Agric. Sustain., 7(4):292-320. [ Links ]
KASSIE, M., ZIKHALI, P., MANJUR, K. & EDWARDS, S., 2009. Adoption of organic farming technologies: Evidence from semi-arid regions of Ethiopia. Working paper in Economics 335. University of Gothenburg, Sweden. [ Links ]
LANGYINTUO, A.S. & MUNGOMA, C., 2008. The effect of household wealth on the adoption of improved maize varieties in Zambia. Food Policy, 33(6):550-559. [ Links ]
LINIGER, H., STUDER, R.M., HAUERT, C. & GURTNER, M., 2011. Sustainable land management in practice: Guidelines and best practices for Sub-Saharan Africa. FAO. Rome, Italy. [ Links ]
MATATA, P.Z., AJAYIL, O.C., ODUOL, P.A. & AGUMYA, A., 2010. Socio-economic factors influencing adoption of improved fallow practices among smallholder farmers in western Tanzania. Afr. J. Agric. Res., 5(9):818-823. [ Links ]
MAZVIMAVI, K., NDLOVU, P.V., NYATHI, P. & MINDE, J.I., 2010. Conservation agriculture practices and adoption by smallholder farmers in Zimbabwe. Poster presented to the Joint 3rd African Association of Agricultural Economists (AAAE) and 48th Agricultural Economists Association of South Africa (AEASA) Conference. Cape Town, South Africa. [ Links ]
MEIJER, S.S., CATACUTAN, D., AJAYI, O.C., SILESHI, G.W. & NIEUWENHUIS, M., 2015. The role of knowledge, attitudes and perceptions in the uptake of agricultural and agroforestry innovations among smallholder farmers in sub-Saharan Africa. Int. J. Agric. Sustain., 13(1):40-54. [ Links ]
MUBIRU, D., 2010. Climate change and adaptation options in Karamoja. FAO. Rome, Italy. [ Links ]
NALULE, S., 2010. Social management of rangelands and settlement in Karamoja. Available from: http://www.un.org/africarenewal/sites/ [ Links ]
OSIRU, D.S.O., 2013. Conservation agriculture: Facilitators guide for Farmer Field School (FFS). FAO. Rome, Italy. [ Links ]
RUFINO, M.C., DURY, J., TITTONELL, P., VAN WIJK, M.T., HERRERO, M., ZINGORE, S., MAPFUMO, P. & GILLER, K.E., 2011. Competing use of organic resources, village-level interactions between farm types and climate variability in a communal area of NE Zimbabwe. Agric. Syst., 104(2):175-190. [ Links ]
SAXENA, P.S., SALHAN, B., CHATOPADHYAY, M.P.S., KOHLI, D., NANDAN, D. & ADHISH, S.V., 2010. Obstetrics and perinatal outcome of teenage and older primigravidas - A retrospective analysis. Health Popul. Perspect. Issues, 33(1):16-22. [ Links ]
SHETTO, R. & OWENYA, M., 2007. Conservation agriculture as practiced in Tanzania: Three case studies: Arumero district, Karatu district, Mbeya district. Rome: Food and Agriculture Organisation. [ Links ]
TROELL, M., NAYLOR, R.L., METIAN, M., BEVERIDGE, M., TYEDMERS, P.H., FOLKE, C., ARROW, K.J., BARRETT, S., CRÉPIN, A.S., EHRLICH, P.R., GREN, A., KAUTSKY, N., LEVIN, S.A., NYBORG, K., ÖSTERBLOM, H., POLASKY, S., SCHEFFER, M., WALKER, B.H., XEPAPADEAS, T. & DE ZEEUW, A., 2014. Does aquaculture add resilience to the global food system? Proc. Natl. Acad. Sci. U.S.A., 111(37):13257-13263. [ Links ]
UGANDA BUREAU OF STATISTICS (UBOS), 2009. Uganda national household survey: Socioeconomic report. Kampala, Uganda. [ Links ]
UGANDA BUREAU OF STATISTICS (UBOS), 2013. Statistical abstract. Kampala, Uganda. [ Links ]
UGANDA BUREAU OF STATISTICS (UBOS), 2014. National population and housing census. Kampala, Uganda. [ Links ]
UNITED NATIONS DEPARTMENT OF ECONOMIC AND SOCIAL AFFAIRS (UNDESA), 2015. World population prospects: The 2015 revision. New York, United States of America. [ Links ]
UNITED NATIONS DEPARTMENT OF PUBLIC INFORMATION (UNDPI), 2014. Special edition on agriculture. New York, United States of America. [ Links ]
VAN ITTERSUM, M.K., VAN BUSSEL, L.G., WOLF, J., GRASSINI, P., VAN WART, J., GUILPART, N., CLAESSENS, L., DE GROOT, H., WIEBE, K., MASON-D'CROZ, D. & YANG, H., 2016. Can sub-Saharan Africa feed itself? Proc. Natl. Acad. Sci. U.S.A., 113(52):14964-14969. [ Links ]
WORLDOMETERS, 2017. Population. Available from: http://www.worldometers.info/population/ [ Links ]
 Correspondence:
A. Esabu
Mail: aesabu@gmail.com

