


Serviços Personalizados
Artigo
 Inglês (pdf)
 Artigo em XML
 Referências do artigo
Indicadores

Links relacionados
-
 Citado por Google
 -
 Similares em Google
Compartilhar

 Permalink
South African Journal of Agricultural Extension
versão On-line ISSN 2413-3221
versão impressa ISSN 0301-603X
S Afr. Jnl. Agric. Ext. vol.47 no.2 Pretoria 2019
http://dx.doi.org/10.17159/2413-3221/2019/v47n2a498
ARTICLES
Designing Successful Land Reform For The Extensive Grazing Sector
Conradie B
University of Cape Town, South Africa, email: Beatrice.conradie@uct.ac.za
ABSTRACT
The purpose of this paper is to identify the determinants of success in commercial sheep farming in the Karoo so that these characteristics can be designed into smallholder commercialisation programmes there and in the former homelands of the Eastern Cape Province of South Africa. Benchmarking applied to production data from commercial operations revealed that every fifth commercial farmer is less than 50% efficient, and therefore is as much in need of extension as any smallholder might be. Experience is an important determinant of performance and could be developed in the smallholder sector through vocational training at the point of commercialisation. Sheep farming is amenable to smallholder production because it can be done successfully on a part-time basis. Woolled sheep are important. Being able to respond flexibly to rainfall variability is essential, but there are several ways to achieve this cost effectively in the smallholder sector.
Keywords: Benchmarks, Extension plans, Extensive grazing areas, Sheep farming
1. INTRODUCTION
Results obtained under experiment station conditions take years to be fully adopted by farmers. The weaker the extension system, the longer it takes, and it is especially challenging if the transfer has to take place from a modern, commercial sector to smallholders (Aliber & Hall, 2012; Düvel, 2001; Düvel, 2004). The main contribution of this study is to show how knowledge about success in the commercial sector can be applied to design support programmes for commercialisation of the smallholder sector. Productivity gains are the foundation of commercialisation (Irz et al, 2001) and, through benchmarking, one can discover how to make it happen under field conditions. While good work is being done amongst smallholder sheep farmers in Ciskei and Transkei (De Beer & Terblanche, 2015), the region's livestock production is not yet fully commercialised (Kepe, 2000). If it was, smallholders could slaughter as many as a million more sheep and goats per year and add ten thousand tons to the annual wool clip1.
From the mid-2000s onwards, there was rapid growth in the international literature on farm productivity. Studies on small stock rearing concentrated on the arid parts of Europe (Greece, Southern Italy, and Spain), North Africa and the Middle East, contexts that are comparable to the Karoo and the Eastern Cape Province. Many analyses were preoccupied with the effect of subsidies and their link with farm financial performance (Dinar, Karagiannis & Tzouvelekas, 2007; Galanopoulos et al, 2011; Hadley, 2006; Iraizoz, Bardaji & Rapun, 2005). Others investigated the impact of market access (Shomo et al, 2010), extension (Dinar et al, 2007) and the contribution of farmers' associations (Suresh, Gupta & Mann, 2008). With a few exceptions (Conradie & Piesse, 2015; D'Haese et al, 2001), productivity analysis is not yet widely adopted in South African agriculture.
The main aims of this study are to investigate the factors associated with high productivity on commercial sheep farms in the Central Karoo and to interpret these for smallholder producers operating in the Karoo as well as in the former homelands of the Eastern Cape Province. The benchmarking method is a four-input Cobb-Douglas stochastic production frontier with inefficiency effects (Battese & Coelli, 1995), which is quite technical. Mercifully, the model's technical details are well-rehearsed by the original authors and in most of the studies cited above, so this analysis can be kept intuitive.
2. BENCHMARKING METHODS
While benchmarking as a practice is well established, the software that implements stochastic frontier models only became accessible twenty years ago (Coelli, 1996). Benchmarking relies on identifying from within a sample of farms those that are most technically efficient, in other words, are best at converting inputs into outputs. Once a benchmark is set, other members of the group can be ranked relative to the best performance. This ranking is usually done according to total factor productivity (TFP) analysis. The TFP analysis simultaneously considers all inputs and outputs and, therefore, incorporates familiar partial productivity measures, such as tons per hectare and rand per worker. Figure 1 provides an illustration of this.
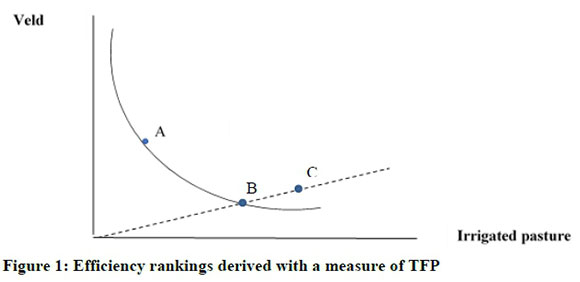
For example, along the Great Fish River there are two modes of sheep production, one that is veld orientated (option A) and one that is paddock-based (option B). Let the curve (isoquant) in Figure 1 represent the minimum amount of grazing needed to support one large stock unit (LSU) in this area, and let the two dots, A and B, represent the alternative efficient production strategies. In this example, farm A is predominantly veld orientated with some pasture used for finishing slaughter lambs, while farm B is more pasture orientated with a lesser use of veld. Both use a minimum of veld and irrigated pasture to achieve the same level of output (one LSU). In comparison, farm C is inefficient because it uses 25% more of each input to produce the same output. Relative to farm B on the frontier, farm C is, therefore, 75% efficient. Each farm to the right of the frontier can be scored in this way. If data are available for multiple years, as in this case, then all scores are relative to the best performance in the best year.
It is well known that having access to enough breeding ewes and/ or land is the foundation of farming success in extensive grazing areas. However, it is also true that poor grazing conditions can be offset with supplementary feeding, good genetics and sensible animal health routines. These are inputs that could be lumped under the heading "land enhancing inputs". Land alone is not enough either; some labour is needed, and its efficiency can be improved by putting workers on horseback or quad bikes. Therefore, transport costs consisting of fuel, machine repairs and maintenance can be thought of as a "labour enhancing input". In this model, the inclusive land enhancing input was labelled "feed". The labour enhancing input was called "transport". The number of stock sheep and goats on the farm was preferred to the amount of land farmed, since some farms lie fallow. The labour input was measured as the wages paid to hired labour. Together these four inputs explained livestock revenue, comprising mutton and fibre income. All financial values were suitably inflated to constant 2015 prices using the indices published in the Abstract of Agricultural Statistics (Department of Agriculture, Forestry and Fisheries (DAFF), 2017). Each observation is at the level of the farming business. In other words, it includes all the properties on which a given operator farms, even rented land. Crop production was excluded from overhead costs, such as transport and labour and, where farm records were lacking, overhead costs were apportioned according to each enterprise's share of turnover. The functional form is Cobb-Douglas, which means that all inputs and the output must be logged to fit an ordinary least square (OLS) model (equation 1)2.

Production frontiers are estimated using a statistical model that partitions the normal independently and identically distributed error term in equation 1 into white noise (v) and an inefficiency term (-u) associated with specific farming conditions or management skills (Battese & Coelli, 1995; Conradie, 2017). It changes equation 1 to:

The FRONT 4.1 maximum likelihood routine used to fit equation 2 produces a parameter γ that captures the proportion of variance attributable to the u-component of the error term. Battese and Corra's (1977) parameterisation is used to compute γ.

The inefficiency parameter, -u, is usually assumed to follow a truncated normal distribution with mean μ and variance  . Farm level efficiency scores are predicted using the following formula:

The existence of the inefficiency term, and hence of the frontier, is a matter of statistical circumstances, which must be tested for using a generalised likelihood ratio (LR) test. The LR test statistic is computed as equation 5:

LLHOLS is the log likelihood statistic produced for the OLS model in equation 1, and LLHfrontier is the corresponding statistic produced when equation 2 is fitted. This test statistic has a mixed χ2 distribution with degrees of freedom equal to the number of restrictions between the two models (Kodde & Palm, 1986). The restrictions are additional parameters in the frontier model and are not part of the OLS model, including μ, γ and η in an error components model and μ, γ and the number of inefficiency variables in the technical efficiency effects model (Coelli, 1996). The first two parameters, μ and γ, are defined above and η is a time trend that keeps track of individual farms in the panel dataset. The critical value for three restrictions and a probability of p ≤ 0.05 on this one-tailed χ2 test is 7.045.
To examine the impact of contextual factors on farm efficiency, a set of farm and farmer attributes is introduced into equation 23.

Experience, measured as the operator's years in farm management, is expected to improve productivity. Many studies proxy experience with age, but in this case, actual experience in farm management is available.
Size, measured in hectares, including that of rented land, will improve productivity if the production system exhibits increasing returns to scale or if a larger property allows the farmer to avoid the worst effects of patchy rainfall by moving livestock around. To be suitable for smallholder production, the system should ideally exhibit decreasing returns to scale and/ or for spatial variation to be not as important.
For a Cobb-Douglas production function, the returns to scale is found by adding up the α-coefficients on significant inputs which carry positive signs. The other variables in equation 6b that address spatial variability in primary plant productivity are a relative grazing index and the dummy variable, D trek. The relative grazing index is based on Du Toit's (2010) method for calculating grazing potential from a moving average of annual rainfall. Du Toit adjusts the size of monthly rainfall figures by their distance from the present, using weights that increase by one-twelfth for each passing month. As such, 20 mm of rain that fell a month ago gives an index value = 11/12*20 = 18.3, while 20 mm six months ago is worth 10 index points to reflect the falling nutritional values as the veld dries out. Du Toit's monthly index values were averaged per calendar year and compared to the annual average to a long term expected value for the period 1973-2017 to calculate the percentage shortage or surplus in grazing at one of five sites in the study area. There are other approaches, for example, to include total annual rainfall in millimetres or as a percentage of the long term expected rainfall at a site, but neither of these capture rainfall distribution as well as the grazing index. The larger the current surplus over expected conditions, the higher productivity is expected to be.
D trek is a dummy variable that indicates that a farmer has access to non-adjacent properties, and thus the ability to move stock around to avoid the worst effects of a drought. Those who can still move livestock around in response to adverse local grazing conditions are expected to be more productive than those who must stay put.
The last three variables in equation 6b are of special interest to extension professionals. The dummy variable, D ptime, takes a value of one for weekend farmers and a value of zero for full-time operators. One would expect that full-time operators would do better, as they are specialised in farming and not consumed by other concerns. If full-time farmers are indeed more productive than part-time operators, a way must be found to enable smallholders to be in farming full-time. However, if this is not the case, a multiple livelihoods strategy becomes viable.
While the industry believes that woolled sheep's second income stream gives an advantage over mutton sheep (Snyman & Herselman, 2005), this advantage was not statistically significant in the Karoo in 2012 (Conradie & Landman, 2015). The percentage of woolled sheep variable revisits this question.
The importance of training for the smallholder sector is well understood. D Grootfontein, a dummy variable that takes a value of one if a farmer attended this college and zero if he attended another institution or only has matric, is there to establish if a vocational training programme has a beneficial effect compared to other forms of education, or a lack thereof. It is expected that a Grootfontein training will improve productivity.
Equation 6 was fitted to the Central Karoo farm panel dataset, which collected 200 observations from 75 farms between 2012 and 2014. The data represents the region north of the Swartberg between Sutherland and the Meiringspoort road up to the Great Escarpment, an area of 1.6 million hectares that supports 193 farms (Statistics South Africa, 2006). The 102 farmers approached by the study represents a 53% convenience sample of farming in the area. The response rate for 2012 was 70.6%. The sample suffered 2% attrition in 2013 and 12.7% in 2014, which leaves 56% of it intact after three years. The remaining farmers' land covers 66% of the sampled area and accounts for 72% of its stock sheep and goats (Statistics South Africa, 2011).
3. RESULTS
3.1 Descriptive statistics
The average farm in the study generates an income of R614 000 per year on 9629 hectares with a flock of 898 stock sheep and goats. As previously explained, all values quoted are in constant 2015 Rand. Half of the farm consists of at least two land parcels. At 70% of total holdings, Dorper sheep dominate, followed by 29% woolled sheep, such as Merinos and Dohne Merinos. Since less than 5% of the total holdings are made up of goats, the discussion that follows excludes them. A total of R69 000 per year is spent on feed, animal remedies and ram purchases. Wages cost R64 000 and fuel, machine repairs and maintenance a further R83 000 per farm per year. The group is quite experienced, as 29% underwent practical training and most are full time.

Grazing conditions varied within and between years but were normal on average. For example, 2012 was a poor season for the Laingsburg area (-29% of the expected grazing index value). The next season was slightly worse than expected (-14%) and 2014 slightly better than expected in this area (+11%). In the Koup, conditions were normal in 2012 (-1%), slightly above average in 2013 (+11%) and slightly below average in 2014 (-8%). Prince Albert had a bad year in 2012 (-18%), followed by a normal year (+2%) in 2013 and a very good year (+41%) in 2014. Beaufort West experienced three good years in a row (+47%, +17%, +24%).
3.2 The Cobb-Douglas stochastic production frontier
Table 2 presents the estimated Cobb-Douglas stochastic frontier and the results of two specification tests. The first test confirmed the existence of a frontier in the model without inefficiency effects (equation 6a); its test value of 157.45 rejects the null hypothesis with a probability of p ≤ 0.0001. This confirms that γ is non-zero and that management deficiencies are detectable. The second test checks if the seven contextual values can jointly explain the observed inefficiencies. Since its test statistic of 261.11 is larger than the critical value of 16.274 for nine restrictions, the null hypothesis that an ordinary least squares Cobb-Douglas function is adequate, is rejected.
Land, as proxied by the number of stock sheep on the farm, is the most important factor of production on sheep farms in the Karoo. The output elasticity was 0.598, and the coefficient was statistically significant. The magnitude of the coefficient means that a 1% increase in the size of the breeding flock is predicted to raise farm income by approximately 0.6%. It suggests decreasing returns to scale, confirmed by the four Cobb-Douglas coefficients adding up to 0.914. Labour is the second most important input with a coefficient of 0.224, which was also significant at p ≤ 0.01. The land and labour enhancing inputs, feed and transport, were of a similar size and quite small, suggesting that a low-cost production system is appropriate for the Karoo. The output elasticity of feed was 0.051, which indicates that doubling feed expenditure would increase farm income by just over 5%. With an elasticity of 0.041, the transport effect was even smaller, and while the feed elasticity was significant at p ≤ 0.05, the transport elasticity was only significant at p ≤ 0.10.
Compared to other Cobb-Douglas stochastic frontiers, this model produced a good fit with plausible elasticities. All four coefficients have positive signs and are statistically significant, which is sometimes difficult if sample sizes are small. For example, Suresh et al (2008) failed to produce positive signs on their three-input Cobb-Douglas frontier for sheep farming in Rajasthan. Iraizoz et al (2005) managed two positive signs out of six in their Cobb-Douglas stochastic production frontier for Spanish beef production. Pérez, Gil and Sierra (2007) excluded land and only explained Spanish mutton output with feed cost, labour and depreciation, which at least were all significant at p ≤ 0.05. Their output elasticities with respect to labour (0.29) and capital (0.02) were similar to the ones presented here, while their coefficient on feed cost was a bit higher than this model's coefficient on stock numbers. In a Cobb-Douglas stochastic production frontier representing beef cattle production in Kenya, Otieno, Hubbard and Ruto (2014) found stock numbers, feed, veterinary cost and an index of other costs all to be significantly different from zero. Hired labour is not a factor in Kenyan agriculture, however, the other elasticities are in line with those reported here. Moreover, herds were the most important factor of production (0.89), feed and veterinary costs much less so (0.12), and other inputs rather unimportant (0.02). The Melfou, Theocharopoulos and Papanagiotou (2009) attempt to model a translog stochastic production function for sheep production in Greece produced the closest match for these results. Flock size was the most important (0.55), followed by feed (0.38) and labour (0.23). Labour enhancing inputs were not considered.
3.3 Returns to scale and efficiency levels
Evidence of returns to scale in extensive livestock farming is mixed. Melfou et al (2009) reported increasing returns to scale (1.15), Otieno et al (2014) found close to constant returns to scale (1.03), and Pérez et al (2007) produced a result somewhere between the two (1.07). Barnes (2008) reported decreasing returns to scale (0.875) for sheep farming in Scotland, a close match to what this study found (0.914). Decreasing returns to scale means that a proportional increase in all inputs results in a less than proportional increase in output, which is an essential condition for a smallholder commercialisation strategy to work, as it implies that farms can be subdivided without compromising their productivity.
It is standard practice to report mean efficiency scores, which in this sample was 67 ± 20%. It is usually not possible to compare scores between studies, as mean scores are a function of within-group best practice. A group of mediocre farms can all end up in the vicinity of the frontier on a high mean score, which will fall when a more efficient farm sets a new benchmark. Therefore, sets of efficiency scores are at best compared in terms of their distributions, for example, by looking at their coefficients of variation (CV = standard deviation/mean). The coefficient of variation of 0.30 remained stable from one year to the next, but was double the variation, CV of 0.14, as reported by Hadley (2006) for sheep farming in the United Kingdom.
Similar numbers of farms determined the frontier in each year. There were two farms above an arbitrary level of 90% in 2012, five in 2013, and four in 2014 with a total of eight over the period. The high scores were 92%, 92% and 93%. Minimum scores were 22%, 1% and 0%, with the minimum in 2013 explained by a crop farmer who gave up his sheep enterprise in 2014, and a semi-subsistence operator who was living off savings in 2014. In addition, 12, 15 and 13 farms were assigned scores of less than 50% in the various years. The average efficiency of these 40 farms was 34%, which makes them highly financially vulnerable if not already beyond help. If they could be convinced to accept help and if that assistance could improve their performance by half, very few farms would remain in the non-performing zone.
The contextual factors that affect this performance are summarised in the bottom half of Table 2. All seven variables carry negative signs, which means that they all contribute to productivity to various degrees.
4. DETERMINANTS OF PRODUCTIVITY WITH LESSONS FOR THE SMALLHOLDER SECTOR
The benefits of experience (usually proxied by farmer's age) on farm productivity is well documented in developed as well as developing countries (Dinar et al, 2007; Hadley, 2006; Otieno et al, 2014; Shomo et al, 2010). Although Iraizoz et al (2005) found it to be insignificant in the case of extensive cattle farming in Spain, in the Karoo, experience is valuable. Regressing efficiency scores on experience and experience-squared showed that an additional year of experience raises productivity by 0.8 of a percentage point. One of the best ways to build experience quickly in new entrants is to provide vocational training, as has been provided at Grootfontein College in Middelburg, Eastern Cape, for many years. A Grootfontein diploma is associated with an efficiency level of 72%, while the absence of it (because the farmer went to another college, university or nowhere at all) was associated with a 64% average efficiency. A t-test of means produced a test value of t = -2.59, with a probability on the one-tailed test of p ≤ 0.01, which indicates a significant difference in these mean efficiency scores. The industry, therefore, has an interest in ensuring that this facility continues to be funded adequately, managed properly and is made accessible to smallholders too.
The farm size result should be read with the effects of the grazing index and the D trek dummy variable. The Karoo's rainfall is variable. Laingsburg village recorded a mean precipitation of 112 mm per year over the last century. With a standard deviation of 52 mm, this series has a coefficient of variation of CV= 0.466, which is one and a half times the size of the coefficient of variation for productivity. This means that farmers have found ways to respond to rainfall variability, including moving sheep around to avoid the worst droughts. The larger a farm, the more flexibility a farmer has, which explains why productivity is positively correlated with farm size. If different portions of the farm are non-adjacent, migration benefits are compounded, which explains why the D trek dummy variable came up significant when controlling for farm size. It is interesting that the grazing index did not contribute to the explanation of inefficiency in the joint model despite a significant Pearson's correlation coefficient of r = 0.1484 between the index and the efficiency scores (p ≤ 0.05). This implies that within "normal" bounds, the strategy of moving sheep around fully offsets rainfall variability.
In the past, it was standard to have a spare farm at a higher altitude or across the rainfall divide to which livestock migrated seasonally. Unfortunately, due to mounting financial pressure, many of these farms have been sold off, usually to weekend farmers who do not control predators. Without spare farms, the remaining land becomes more vulnerable to rainfall variability and the temptation to overgraze increases. It is possible that some of the documented smallholder success in communal areas (De Beer & Terblanche, 2015) is due to the ability to move livestock around in response to local rainfall variability, however, this theory needs further scrutiny.
The lesson for smallholder agriculture is that some degree of flexibility must be designed into the programme, either as generous individual land endowments, a spare-farm design where suitable land is rented by the government during droughts, or by means of dedicated stock removal schemes for smallholders. The cost implications of these different proposals need to be evaluated as part of the planning process for the commercialisation of the sector.
There is some debate in the literature over the relative merits of diversification and specialisation in agriculture. Hadley (2006) reported that farms specialised in livestock are more productive than mixed operations, while Dinar et al (2007) and Iraizoz et al (2005) insisted on the benefit of spreading agricultural risk over more than one enterprise. We also know that the size of a household's off-farm income is inversely correlated with the efficiency of its farming operation (Dinar et al, 2007), from which it could be deduced that full-time operators might be more effective than weekend farmers. A t-test of efficiency means by D part-time gives a value of t = 1.098, which for 198 degrees of freedom has a probability of p ≤ 0.2735 on the two-tailed test. The mean score of 67% for the 174 full-time observations is no different from the mean score of 62% that applies to the 26 part-time observations. However, when controlling for the six other farm characteristics, the inefficiency model says that weekend farmers do better than full-time operators. This could be because they have more funds to invest or because they have more contacts in the wider world. The beauty of this finding is that professional people who would like to upgrade their traditional livestock holdings to commercial operations can continue in their current employment without being at a disadvantage to full-time operators, which might generate capital to fund farm expansion, as it does in Kenya where farm credit markets are missing (Otieno et al, 2014). However, this will only work if the farm is considered an important enterprise and not just a status symbol or the product of an opportunistic land grab.
The percentage of the flock consisting of woolled sheep was included to work out what the best breed is to farm with in marginal areas, such as the Central Karoo. Snyman and Herselman (2005) established that Merinos perform best on stud farms in the Eastern Grassy Karoo, but Conradie and Landman (2015) failed to find a statistically significant difference between woolled and mutton sheep on non-stud farms in this area, arguing that the aridity of this part of the world is too much for woolled sheep. The result here is in accordance with Snyman and Herselman's (2005) finding, namely that woolled sheep do reward good managers, even under the most marginal conditions. This means that the wool industry is well positioned to lead a smaller commercialisation programme and that the Department of Agriculture should support a programme that makes woolled sheep available to smallholders.
5. CONCLUSION
This analysis aimed at benchmarking commercial sheep farming for the Karoo with the intention of transferring insights to a commercialisation design for the smallholder sector. A four-input Cobb-Douglas stochastic production frontier was estimated successfully. It identified substantial room for improvement amongst a fifth of the producers in the sample. The smallholder sector might be important, but the commercial sector needs ongoing support as well. Success is a function of experience and vocational training, and Grootfontein College is a strategic asset that could play a key role in this regard. All smallholders on the brink of commercialisation should be encouraged and enabled to attend.
The second important lesson was that commercial farmers seem to cope well with rainfall variability because they hold large and diversified land portfolios. While, in an ideal world, all smallholders would be upgraded to large-scale commercial status, neither the South African government nor the wool industry is in a position to make this a reality. However, the need for flexibility can be responded to creatively in more cost-effective ways, which should be studied further.
In addition, other encouraging findings were that sheep production exhibits decreasing returns to scale, which does not completely disqualify it as a smallholder enterprise. Moreover, this enterprise can be operated as successfully on a part-time as on a full-time basis. The latter is important because it could substantially lower the investment required to get a smallholder production programme off the ground.
ACKNOWLEDGEMENT
This work was funded in part by Red Meat Research and Development South Africa (RMRD SA) under the University of Cape Town grant number 1182704.
REFERENCES
ALIBER, M. & HALL, R., 2012. Support for smallholder farmers in South Africa: Challenges of scale and strategy. Dev. South Afr., 29(4):548-562. [ Links ]
BARNES, A., 2008. Technical efficiency estimates of Scottish agriculture: A note. J. Agric. Econ., 59(2):370-376. [ Links ]
BATTESE, G.E. & COELLI, T.J., 1995. A model for technical inefficiency effects in a stochastic frontier production function for panel data. Empir. Econ., 20(2):325-332. [ Links ]
BATTESE, G.E. & CORRA, G.S., 1977. Estimation of a production frontier model: With application to the pastoral zone of Eastern Australia. Aust. J. Agric. Resour. Econ., 21(3):169-179. [ Links ]
COELLI, T.J., 1996. A guide to FRONTIER version 4.1: A computer program for stochastic frontier production and cost functions. CEPA Working Paper 7/96. University of New South Wales, Australia. [ Links ]
CONRADIE, B., 2017. A review of stochastic production functions with inefficiency models for extensive livestock with an application to the Karoo. CSSR Working Paper 406. University of Cape Town, South Africa. [ Links ]
CONRADIE, B. & LANDMAN, A.M., 2015. Wool versus mutton in extensive grazing areas. S. Afr. J. Agric. Ext., 43(1)22-31. [ Links ]
CONRADIE, B. & PIESSE, J., 2015. Productivity benchmarking of free-range sheep operations: Technical efficiency, correlates of productivity and dominant technology variants for Laingsburg, South Africa. Agrekon, 54(2):1-17. [ Links ]
D'HAESE, M., CALUS, M., KIRSTEN, J.F., VAN HUYLENBROECK, G. & BOSTYN, F., 2001. Efficiency analysis of small-scale wool production in the former Transkei South Africa. Agrekon, 40(4):641-655. [ Links ]
DE BEER, L. & TERBLANCHE, S.E., 2015. Improving the livelihoods of wool producers in a sustainable manner by optimizing the woolled sheep production systems within the communal farming area of the Eastern Cape. "A vision that is future directed". S. Afr. J. Agric. Ext., 43(2):105-122. [ Links ]
DEPARTMENT OF AGRICULTURE, FORESRY AND FISHERIES (DAFF), 2017. Abstract of agricultural statistics. Pretoria, South Africa. [ Links ]
DINAR, A., KARAGIANNIS, G. & TZOUVELEKAS, V., 2007. Evaluating the impact of agricultural extension on farms' performance in Crete: A nonneutral stochastic frontier approach. Agric. Econ., 36(2):135-146. [ Links ]
DU TOIT, J.C.O., 2010. An analysis of long-term daily rainfall data from Grootfontein, 1916 to 2008. Grootfontein Agric., 10(2):24-36. [ Links ]
DÜVEL, G.H., 2001. Some realities of extension management in South Africa. S. Afr. J. Agric. Ext., 30(1):40-51. [ Links ]
DÜVEL, G.H., 2004. Developing an appropriate extension approach for South Africa: Process and outcome. S. Afr. J. Agric. Ext., 33(1):1-10. [ Links ]
GALANOPOULOS, K., ABAS, Z., LAGA, V., HATZIMINAOGLOU, I. & BOYAZOGLU, J., 2011. The technical efficiency of transhumance sheep and goat farms and the effect of EU subsidies: Do small farms benefit more than large farms? Small Rumin. Res., 100(1):1-7. [ Links ]
HADLEY, D., 2006. Patterns in technical efficiency and technical change at the farm-level in England and Wales, 1982-2002. J. Agric. Econ., 57(1):81-100. [ Links ]
IRAIZOZ, B., BARDAJI, I. & RAPUN, M., 2005. The Spanish beef sector in the 1990s: Impact of the BSE crisis on efficiency and profitability. Appl. Econ., 37(4):473-484. [ Links ]
IRZ, X., LIN, L., THIRTLE, C. & WIGGENS, S., 2001. Agricultural productivity growth and poverty alleviation. Dev. Policy Rev., 19(4):449-466. [ Links ]
KEPE, T., 2002. Cattle ownership and production in the communal areas of the Eastern Cape, South Africa. PLAAS Research Report 10. University of the Western Cape, South Africa. [ Links ]
KODDE, D.A. & PALM, F.C., 1986. Wald criteria for jointly testing equality and inequality restrictions. Econometrica, 1:1243-1248. [ Links ]
MELFOU, K., THEOCHAROPOULOS, A. & PAPANAGIOTOU, E., 2009. Assessing productivity change with SFA in the sheep sector of Greece. Oper. Res., 9(3):281-292. [ Links ]
OTIENO, D.J., HUBBARD, L. & RUTO, E., 2014. Assessment of technical efficiency and its determinants in beef cattle production in Kenya. J. Dev. Agric. Econ., 6(6):267-278. [ Links ]
PÉREZ, J.P., GIL, J.M. & SIERRA, I., 2007. Technical efficiency of meat sheep production systems in Spain. Small Rumin. Res., 69(1):237-241. [ Links ]
SHOMO, F., AHMED, M., SHIDEED, K., AW-HASSAN, A. & ERKAN, O., 2010. Sources of technical efficiency of sheep production systems in dry areas in Syria. Small Rumin. Res., 91(2):160-169. [ Links ]
SNYMAN, M.A. & HERSELMAN, M.J., 2005. Comparison of productive and reproductive efficiency of Afrino, Dorper and Merino sheep in the False Upper Karoo. S. Afr. J. Anim. Sci., 35(2):98-108. [ Links ]
SURESH, A., GUPTA, D.C. & MANN, J.S., 2008. Returns and economic efficiency of sheep farming in semi-arid regions: A study in Rajasthan. Agric. Econ. Res. Rev., 21(2):227-237. [ Links ]
STATISTICS SOUTH AFRICA, 2006. Census of agriculture provincial statistics, 2002: Western Cape. Report No. 11-02-02 (2002). Pretoria, South Africa. [ Links ]
STATISTICS SOUTH AFRICA, 2011. Census of commercial agriculture, 2007: Western Cape. Report No. 11-02-02 (2007). Pretoria, South Africa [ Links ]
 Correspondence:
B. Conradie
Email: Beatrice.conradie@uct.ac.za
1 Official statistics indicate that 17% of the nation's sheep and 44% of its goats are in the Ciskei and Transkei. Assuming that production in these areas was largely outside of commercial supply chains in 1994, the official production data for that year was inflated by the current share of the flock to estimate the impact of full commercialisation of smallholder sheep and goat production in these former homelands.
2 To reduce clutter, subscripts of t for year and i for farm were suppressed in the derivation.
3 Technical note: Since equation 6b models -u, the inefficiency effect, the δs carry counterintuitive signs. For example, a negative sign on experience means that more experience reduces inefficiency, which is a convoluted (but correct) way of saying that it increases productivity. Due to the non-normal distribution of u, the magnitudes of the δs are not easily interpreted. Only their signs and significance levels matter.

