


Services on Demand
Article
 English (pdf)
 Article in xml format
 Article references
Indicators

Related links
-
 Cited by Google
 -
 Similars in Google
Share

 Permalink
South African Journal of Agricultural Extension
On-line version ISSN 2413-3221
Print version ISSN 0301-603X
S Afr. Jnl. Agric. Ext. vol.46 n.2 Pretoria 2018
http://dx.doi.org/10.17159/2413-3221/2018/v46n2a468
ARTICLES
The level of household food security of urban farming and non-farming households in the informal settlement area of the Cape Town Metropole in South Africa
Swanepoel J. W.I; van Niekerk J. A.II
ICentre for Sustainable Agriculture, Faculty of Natural and Agricultural Sciences, University of the Free State, Republic of South Africa, +27 (0)51 401 2163, SwanepoelJW@ufs.ac.za
IICentre for Sustainable Agriculture, Faculty of Natural and Agricultural Sciences, University of the Free State, Republic of South Africa, vNiekerkJA@ufs.ac.za
ABSTRACT
Different food security (FS) indicators were used to determine the level of FS on all dimensions of FS in the informal settlement areas of the Western Cape Metropole in South Africa. With regards to food access, 78% of households are severely food insecure, while just more than 50% of households earn more than the US$ 2 per capita per day food poverty line and with 21% of the households that fall below the critical point of US$ 1.25 per capita per day. The average total household expenditure on food is R338.26, whereto the share of income spent is an average of 52.5% of household income. Households experience 4.3 hungry months during a year, meaning challenges are experienced concerning food availability. The household diet diversity score (HDDS) was used to measure utilisation and it was found that 10.4 out of 18 different food groups/categories were consumed. Most significant differences can be seen for FS indicators between areas, but no significant differences were measured between farming and non-farming households. This means that households involved in farming are not more food secure than those not involved in farming. Bonteheuwel and Kraaifontein were the two areas most severely affected by food insecurity according to Household Food Insecurity Access Scale (HFIAS), Household Diet Diversity Score (HDDS) as well as Months of Adequate Household Food Provisioning (MAHFP) and the food poverty measures. Gugulethu and Khayelitsha on the other hand seem to be the most food secure of all these areas.
Keywords: Urban households, food security, food security indicators, food security measures, Farmer Support and Development, extension services
1. INTRODUCTION
According to Frayne, Pendleton, Crush, Acquah, Battersby-Lennard, Bras and Zanamwe (2010), urban FS is not only about the amount of food produced or supplied. One has to take into consideration the other dimensions of FS, which include food availability, food quality, food reliability and food accessibility. Hendriks (2015) described food insecurity as a problem with multiple manifestations. Factors contributing to this challenge include social norms, individual behaviour and stages in the human life cycle, food availability and quality. Due to the difficulty in merging the above and diverse understandings thereof, it is thus a challenge to improve responses to the problem.
Labadarios, Mchiza, Steyn, Gericke, Maunder, Davids & Parker (2011) confirmed that there was never a national survey conducted to assess all dimensions of FS in South Africa. In addition, D'Haese, Karaan, Van Rooyen & Vink (2016) observed that there are no regularised ways of monitoring FS in South Africa since different methodologies, samples and sampling techniques are used and different aspects of FS are assessed. This is bound to provide different results and it is thus difficult to compare indicators across studies and develop a single FS estimate for South Africa.
Many initiatives were implemented by the Western Cape Department of Agriculture to alleviate the food insecurity situation of households in the informal settlement areas of the Cape Town Metropole of South Africa. Some of the initiatives included the implementation of urban household and community food gardens assisted by the Department's extension division. Extension services thus played a pivotal role in the advising and training of these urban farmers. Therefore, this article has the purpose to analyse the level of household FS of urban and nonurban farmers in the informal settlement areas of the Cape Town Metropole with reference to all dimensions of FS.
2. METHODOLOGY
2.1. Study area and data collection
The study was conducted in the informal settlement areas that form part of the Cape Town Metropole of the Western Cape in South Africa. Initiatives like urban household and community food gardens implemented by the Farmer Support and Development Division of the Western Cape Department of Agriculture were carried out to improve the food security situation of households in these areas. The farmers involved in these projects comprised of those owning house gardens or those involved in community gardens. Extension officers of the department provide advisory services to them. Randomly selected non-farming households of the same area thus served as the control group.
The informal settlement areas in the Cape Town Metropole selected to conduct the surveys in are:
-
Gugulethu
-
Khayelitsha
-
Kraaifontein
-
Mitchells Plain
-
Bonteheuwel
-
Philippi
These areas are known to consist of some of the poorer communities in the Cape Town Metropole. Quantitative and qualitative data was collected by using questionnaires that included questions constructed to include different social characteristics of the household, the FS situation based on different FS indicators, household income and expenditure, household food production, access to water and to markets and access to governmental support programmes. It thus contributed to an in-depth comprehension of the social and economic aspects of FS at household level and the identification of the factors influencing FS at household level by including the four major FS components, namely food availability, food accessibility, food utilisation and food system stability. A total of 223 surveys were completed and three were eliminated due to outlying values, resulting in 220 households that were analysed.
2.2. Data analysis
To determine the level of household FS it is important to consider the multidimensional characteristics thereof. Household characteristics were used for the purpose to explain the variation in food insecurity. The main characteristics that were used include characteristics regarding demography, capability, livelihood strategies and entitlements of the households. Thus, the following instruments were used to gain a complete representation of household FS:
-
Household Food Insecurity Access Scale (HFIAS)
-
The HFIAS was translated into only three groups (food secure, moderately food insecure and severely food insecure) which were obtained from the scale.
-
Household Diet Diversity Scale (HDDS)
-
Households were asked to report their household dietary consumption during the previous seven days through a constructed 18 food group questionnaire. Due to portion sizes measuring difficulties, this analysis was restricted to the diversity of household diet.
-
Food poverty (FP)
-
Months of adequate household provisioning (MAHFP)
-
Energy availability (EA) proxied as Total Value Consumed (TVC)
-
Share of food expenditure on total household expenditure (SHARE)
The Pearson correlation coefficients and graphs were used to compare the outcome indicators on HFIAS, HDDS, MAHFP, TVC and total share of food expenditure on total food expenditure.
The P-Alpha poverty index was used to analyse household food poverty levels (Foster, Greer & Thorbecke, 1984). For the purpose of this study, the food poverty line as described by Statistics South Africa (2015). The food poverty line is described as follows, "the food poverty line is the Rand value below which individuals are unable to purchase or consume enough food to supply them with minimum per-capita-per-day energy requirement for good health (which is about 2 100 kilocalories)" (Statistics South Africa, 2015). The equation defined by Foster et al. (1984) is as follow:
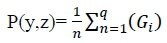
Whereas:
y = value of food consumption per capita in each household
z = recommended food poverty line (R352 per capita per month (Statistics South Africa, 2015)
Gi= z - yi= the ith household food poverty gap
q = number of poor households
n = the total number of households in the area
3. RESULTS
3.1. Household food insecurity access scale
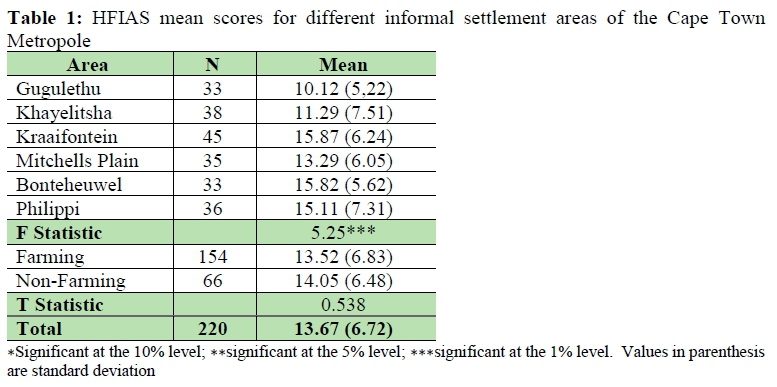
According to the HFIAS scale, it was calculated that 78% of households over all the informal settlement areas surveyed in the Cape Town Metropole experience severe food insecurity. Furthermore, 14% of them experience moderate FS, while only 8% of households surveyed are food secure. Battersby (2011) reported that 80% of the households they surveyed in the Cape Town Metropole experienced either moderate or severe food insecurity. This number is also similar to that reported by Crush, Hovorka & Tevera (2011) who found that within the informal areas of Cape Town, 80% of households were severely food insecure.
The socio-economic indicators of this study area are well described in an article by Swanepoel, Van Niekerk and D'Haese (2017). As seen in Table 1, the area with the lowest mean score on the HFIAS scale is Gugulethu (10.1) and the highest average scores were measured in Bonteheuwel with a score of 16.1 and Kraaifontein with 15.9. When measured against the Pearson Chi-Square of 0.5, there are significant differences between the informal settlement areas in terms of the level of FS. Non-farming households scored 14.1 and urban farmers 13.5 on the HFIAS scale. Although this is an indication that urban farmers are more food secure than households not involved in agricultural activity, no significant difference were found between the FS levels between urban farming households and non-farming households.
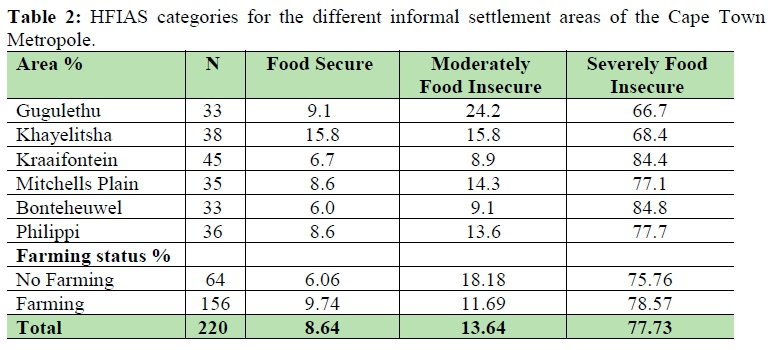
According to the HFIAS, 84.8% of households from Bonteheuwel experience severe food insecurity and 9.1% moderate food insecurity (Table 2). Kraaifontein and Philippi also experience severe food insecurity with levels over 80%. Gugulethu and Khayelitsha have the lowest levels of severe food insecurity with 66.7% and 68.4% respectively, however, these areas do experience moderate food insecurity in 24.2% of households in Gugulethu and 15.8% of households in Khayelitsha. The analysis on the FS status of farming and non-farming households shows that in both cases, more than 75% of households experience severe food insecurity, with a higher percentage of farming households experiencing severe food insecurity.
The majority of respondents over all the informal settlement areas in the Cape Town Metropole reported that they often (more than 10 times during the past 30 days) worried that there would not be enough food for the household to eat. Respondents from Gugulethu and Khayelitsha sometimes worried (three to nine days during the past 30 days) that the household would not have enough food to eat, while households from Kraaifontein, Mitchells Plain, Bonteheuwel and Philippi often worried that there would not be enough food for the household to eat. The households in all the informal settlement areas reported that one of the household members was not able to eat the kinds of food they preferred because of a lack of money.
It was reported that on average in the Cape Town Metropole, one or more of the household members eat just a few kinds of food day-after-day owing to a lack of money. Gugulethu and Khayelitsha respondents once again reported that they experience this situation sometimes during the past 30 days while households from Kraaifontein, Mitchells Plain, Bonteheuwel and Philippi often experienced this problem.
On average, it was reported that in the Cape Town Metropole it often occurred for one of the household members to eat a smaller meal than they felt they needed since there was not enough food. Respondents from Gugulethu and Khayelitsha sometimes, while households from Kraaifontein, Mitchells Plain, Bonteheuwel and Philippi often experienced this situation as well. It was further reported that someone in the household ate fewer meals due to the lack of food. This was sometimes experienced in Gugulethu and Khayelitsha, but often in Kraaifontein, Mitchells Plain, Bonteheuwel and Philippi.
According to most of the respondents over all the informal settlement areas surveyed in the Cape Town Metropole, it sometimes occurred (three to nine days of the past 30 days) that one of the household members went to sleep at night hungry because there was not enough food. It sometimes took place in all the areas individually as well.
Moreover, most of the respondents over all the areas surveyed in the Cape Town Metropole indicated that it sometimes happened (three to nine days of the past 30 days) that one of the household members went a whole day without eating anything because there was no food available. This sometimes took place in all the areas individually as well.
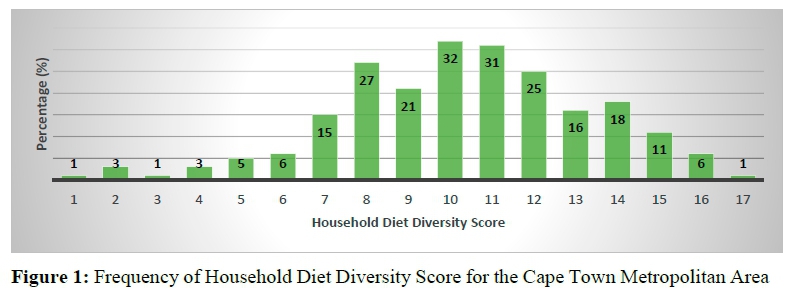
The HDDS is based on the data of food consumed the day before the interview by the household members. The score relates to the number of the different groups of food consumed. A higher score shows higher diversity; thus the household is more food secure (Deitchler, Ballard, Swindale & Coates, 2010). It can also be defined as the total of the amount of different foods or food groups consumed by an individual or household over a specific period.
In Figure 1, the frequency of the HDDS can be seen in the surveyed areas of the Cape Town Metropolitan Area. The highest values were calculated for the region between 8 and 12 on the HDDS where 61.3% of the total surveyed group falls within his area.
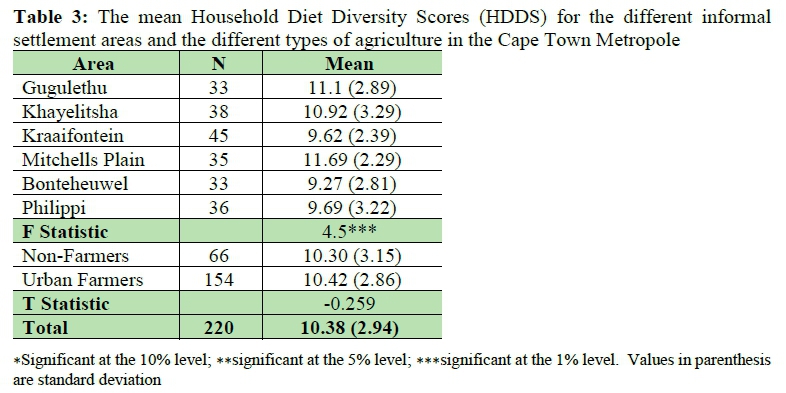
As seen in Table 3,Mitchells Plain (11.7) and Gugulethu (11.1) have the highest HDDS while Bonteheuwel has a much lower HDDS of 9.3. This is an indication that the Bonteheuwel area experiences higher levels of food insecurity. There are significant differences between the HDDS of the different informal settlement areas.
There is almost no difference in value and no significant difference of the HDDS between farming and non-farming households in the Cape Town Metropole. In a study conducted by the Western Cape Department of Agriculture (2015), it was reported that the households that participated in food production have a generally higher HDDS. According to Battersby (2011), the HDDS was generally poor in households in Philippi and Khayelitsha, with a mean of 6.33 out of 12.
3.3. Main sources of food
3.3.1. Consumption per type
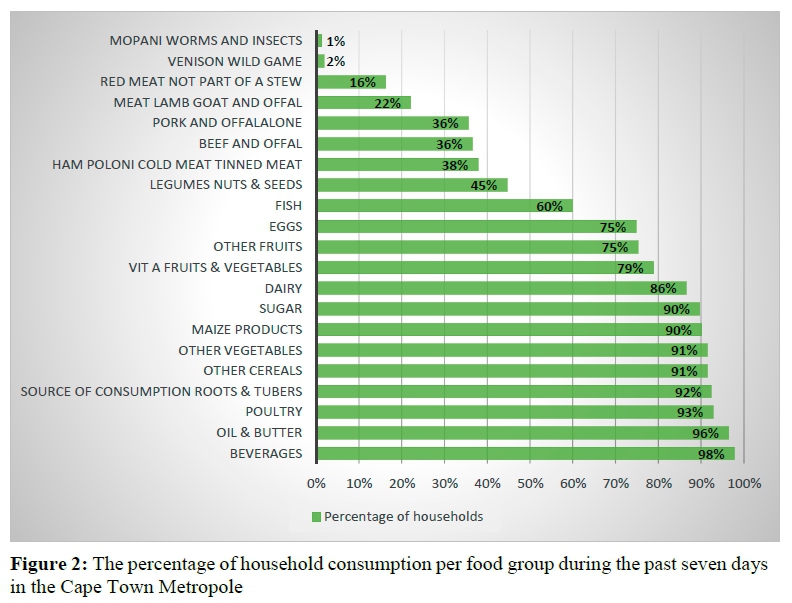
Figure 2 shows the percentage of household consumption per food group during the past seven days of farmers and non-farmers in the Cape Town Metropole. The figure represents each food group. Thus, each bar is based on the total share of consumption among households. The four main groups' consumption during the past seven days (without taking beverages into account) included poultry, other cereals (including bread), maize products and dairy. In the Ekurhuleni area, a study by D'Haese, Vasile and Romo (2013) reported that oil and butter, maize and maize products, sugars and other cereals (including bread) were the main food groups consumed.
It is evident from the figure 2 that farming households consume more roots and tubers, vitamin A fruit and vegetables, other vegetables and maize. This might be because farming households produce some of the above-mentioned food groups. Contrastingly, non-farming households consume more meat, pork, mutton, lamb and goat, and much more poultry than farming households.
3.3.2. Cost per type
Figure 3 provides a good indication of the average expenditure per month on food consumption for households in the Cape Town Metropole on the different groups of food. The average total expenditure per month per household is R1066.24. Money is mostly spent on other cereals, which includes bread with an average of R177.49 per month, followed by poultry and maize products with R176.84 and R134.37 respectively spent by households. Venison, wild and game, mopani worms and other insects, and eggs were the food groups where the least amount of money was spent. In the Ekhurhuleni district, D'Haese et al. (2013) reported that most money was spent on cereals, followed by poultry and maize.
For all the groups of households, it is clear that purchase is the main source of obtaining food in all the food categories. For roots and tubers, other cereals, other vegetables and vitamin A fruits and vegetables, the second highest source of obtaining it is by self-production with 6.3%, 2.7%, 14% and 14.4% respectively. As a second source for obtaining some other food groups, respondents reporting receiving them as gifts. These include beverages, maize, dairy, other fruits, fish, beef and offal, and red meat.
3.4. Hunger Index (Total Hungry Months)
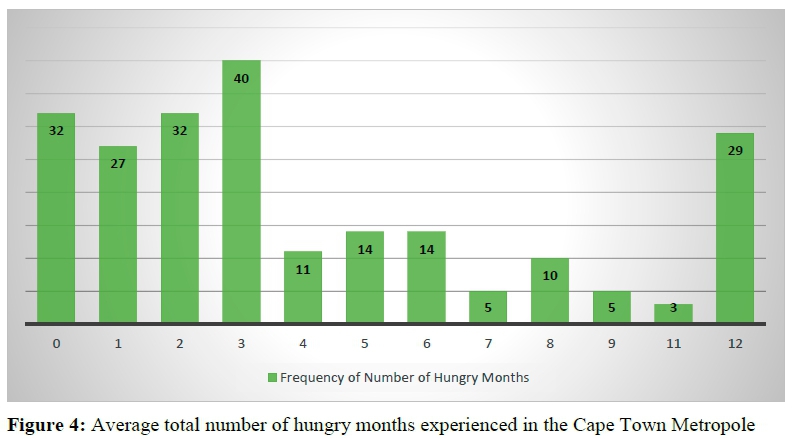
The average total number of hungry months experienced by households in the Cape Town Metropole was 4.3 months during the previous 12 months. This means that during the 12 months prior to the day of the survey there were on average 4.3 months where one or more of the household members had to go hungry due to a lack of food. In Figure 4, one can see that in 29 (13.1%) of the households, someone went hungry at least once each month.
According to Table 4, Khayelitsha households can adequately provide sufficient food in 9.3 months of the year, while this is the case for 7 and 6.1 months for Kraaifontein and Mitchells Plain respectively.
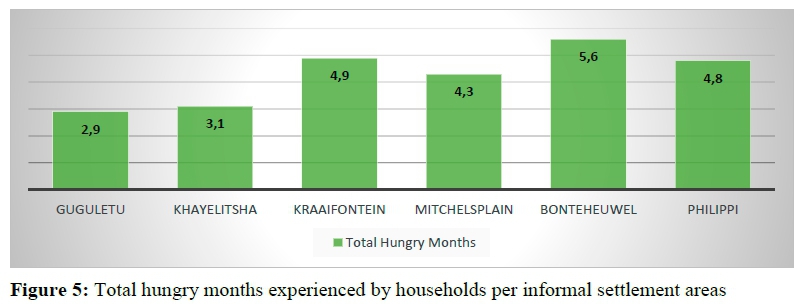
Households from the Bonteheuwel area have a high frequency of hungry months (5.8 months on average) (Figure 5). Gugulethu and Khayelitsha households experienced the lowest number of hungry months with only 2.9 and 3.1 months respectively. On average, the households from the other surveyed informal settlement areas (Kraaifontein, Mitchells Plain and Philippi) experienced between four and five hungry months.
A trend can be seen between the average total of hungry months and the level of food security (Table 5). Food secure households have an average total of 0.8 hungry months per year, while the moderate and severely food insecure households have between 2.4 and 5 hungry months per year. The two assessments (HFIAS and HDDS) for FS verify each other.
Figure 6 represents the distribution of the percentage of households experiencing hungry months over the course of a year. More than 40% of all households are affected by hunger during June and July, and a sharp rise in hunger can be seen in 46% of households in November and 66% of households in December. It can also be noted that the percentage of non-farming households experiencing hungry months are mostly less than farming households, except in July. Battersby (2011) reported similar results for June, but also reported January to be one of the months where food insecurity is experienced in the Western Cape. A main contribution to this peak reporting of hungry periods are due to the fact that the two longest school holidays fall within these months, thus the schools' feeding schemes are not operational. The burden is consequently on the households to provide for food during these periods. This seasonal linkage for both these months follows spending cycles during the December festive season and the cold and wet winter season during June when insecurity can be attributed to extreme weather patterns.
3.5. Food Poverty Measures
Internationally, poverty is measured by using a set standard of the levels of per capita income of US$ 1.25 and US$ 2 per day. Total household income is converted from Rand to Dollar and into income per household member per day. This variable was used to create two categories of households depending on whether household members acquire more or less than US$ 1.25 per capita per day. The same procedure was applied for the US$ 2 per capita per day poverty measure.
Philander (2015) reported that respondents in Langa employed in the urban food garden projects' income ranges between R300 and R1200, while 80% of all respondents receive an income of between R300 and R800. This suggests that the average household lives on about R11 per day.
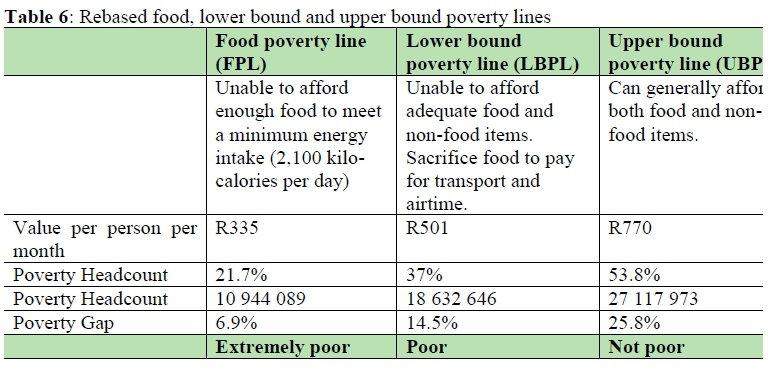
The poverty line in South Africa was reviewed in 2015 by using the Income Expenditure Survey from 2010/2011 to update the basket of goods and services. In other words, this refers to the minimum amount of money one needs to afford basic goods and services to survive. Those falling below this line therefore live in poverty (Nicolson, 2015).
The three lines of poverty that are used by Statistics South Africa (2015) can be seen in Table 6.
When looking at per capita income per day, 79.1% of households reported an income of more than US$ 1.25 per capita per day, while 20.9% of the households are below this critical point. There are however 51.4% of the respondents that earn above US$ 2 per capita per day, with the rest below this amount.
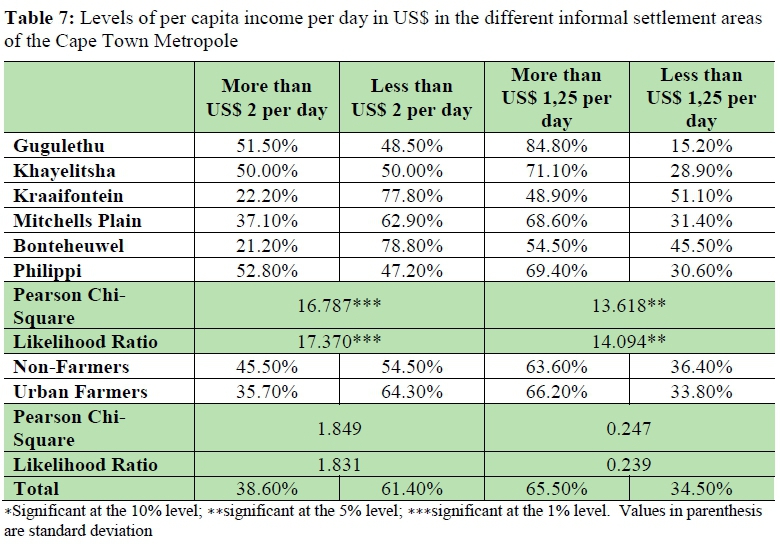
As seen in Table 7, the levels of per capita income per day in US$ in the different informal settlement areas shows that more than 50% of households from Gugulethu, Khayelitsha and Philippi earn above US$ 2 per capita per day.
Less than half (37.1%) of Mitchells Plain households earn more than US$ 2 per capita per day, while this is the case for only 22.2% of Kraaifontein households and 21.2% of Bonteheuwel households. Although 52.8% of Philippi households earn above US$ 2 per capita per day, 30.6% of them earn below US$ 1.25 per capita per day. Furthermore, 45.4% of Bonteheuwel households and 51.1% of Kraaifontein households earn less than US$ 1.25 per capita per day. This shows that households in the Kraaifontein and Bonteheuwel areas are in a very bad situation concerning income (Table 7). For non-farmers, 45.5% earn more than US$ 2 per capita per day, while this is the case for only 35.7% of urban farmers. The values are more or less the same for the US$ 1.25 level for non- and urban farmers. There are significant differences for both the US$ 1.25 and US$ 2 levels between informal settlement areas, but no significant difference could be found for farm type.
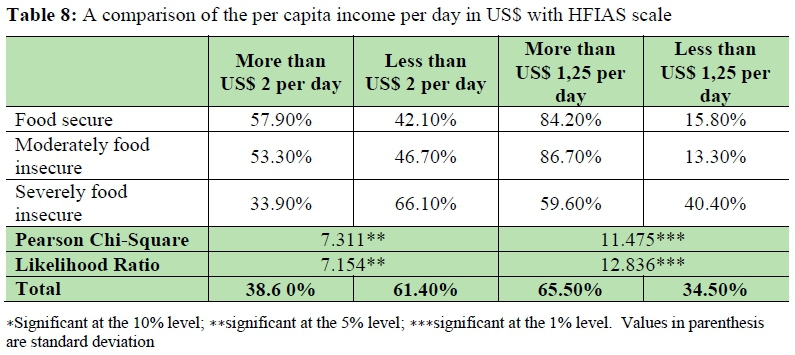
When comparing the food poverty scales with the HFIAS (Table 8) significant differences can be observed for both the US$ 1.25 and US$ 2 levels. It can be observed that only 57.9% of households earning more than US$ 2 per capita per day are food secure according to the HFIAS, while 40.4% earning less than US$ 1.25 are food insecure.
3.6. Food Consumption as a Share of Household Expenditure
Income and expenditure surveys may serve as a measure for FS. Some literature (Leroy, Van Rooyen, D'Haese & De Winter, 2001) states that food consumption, as a part of household spending, is a direct outcome indicator of FS. Therefore, according to D'Haese et al. (2016), it is important to calculate the monetary value of the amount of food purchased, namely how much food is consumed coming from own production and amount of food received as a donation or gift. Even though expenditure patterns of households may provide some information regarding the quantities of different foods purchased per household member, and the contribution to total energy, the information does not indicate FS over time, or whether it has been disposed of in some or other way. Thus, insufficient information regarding food intake has been observed.
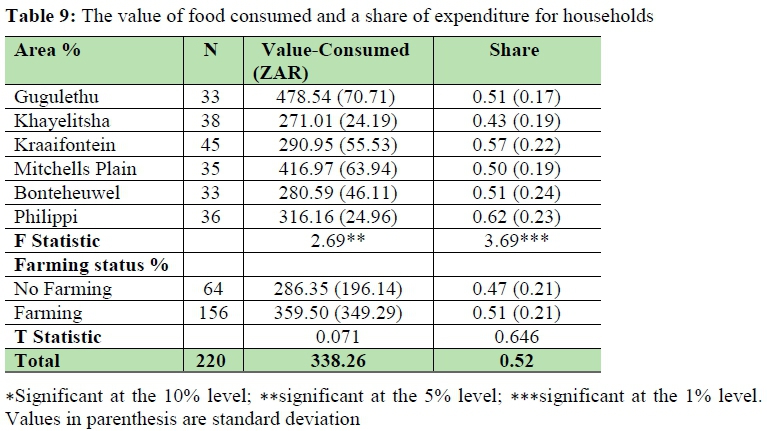
Table 9 shows that households from Gugulethu spent the most money on food consumed (R478.54) per month, while households from Khayelitsha, Kraaifontein and Bonteheuwel spent less than R300 on food consumed per month. Khayelitsha also spent the lowest share of household expenditure (43%) on food consumed. Kraaifontein spend 57% and Philippi 62% of household expenditure on food consumed per month. There are significant differences between areas for both the value spent on food consumed per month as well as the share of household expenditure spent on food. However, non-farming households spent R286.35 per month, while farming households spent R359.35 on food consumed.
Although non-farming households spend about R70.00 per month less on food consumed than farming households, there is no significant difference between the two. This is also the case for the share of household expenditure spent on food by non- farming (47%) and farming households (51%).
3.7. Intra Household Food Distribution
When the respondents were asked when there is not enough food for every member of the household, which members will receive less to eat than necessary to fulfil their needs, it was clear that female and male adults will receive less to eat. Almost half (47.7%) of female adults and 41.4% of male adults are most likely to receive less food. It was mentioned that in some households, 3.2% of children under five years of age and 9.9% of children over the age of five years old are more likely to receive less food when there is not enough to eat. In a study on a rural area by De Cock, D'Haese, Vink, Van Rooyen, Staelens, Schönfeldt & D'Haese (2013), similar values were reported for when food shortages arise where 48% of female adults would eat less, while children under 5 years would mostly have enough food to eat.
Respondents in the surveyed informal settlement areas of the Cape Town Metropole reported that 51% of adults and 85.7% of children had three or more meals the day before the survey. Furthermore, 39.4% of adults had only two meals, while 10% of them only had one meal the day prior to the survey. In the Limpopo province, De Cock et al. (2013) found that most adults ate on average two or three times a day, with 54.6 % of the household having two meals and 35.4 % having three meals a day. Moreover, 24% of children had four meals and 11% of them had two meals the day prior to the survey. Only 3.3% of them had one meal only.
When a comparison was made between the numbers of meals ate the previous day and the level of FS (HFIAS) for adults in the Cape Town Metropole, there was no significant differences between the groups. The food secure group of adults had on average 2.6 meals the previous day, while those moderately and severely food insecure had 2.4 and 2.4 meals on average respectively.
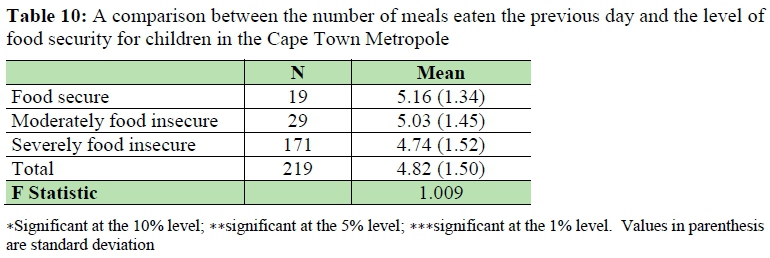
Table 10 shows the comparison between the numbers of meals ate by children the day prior to the survey and the level of FS in the Cape Town Metropole. There are no significant differences between the groups. The food secure group of children had on average 5.16 meals the previous day, while those severely food insecure had 4.7 meals.
4. CONCLUSION AND RECOMMENDATIONS
The HFIAS scale showed that 77.7% of households in the informal settlement areas in the Cape Town Metropole experience severe food insecurity, while only 8.6% are food secure. Gugulethu households reported the lowest mean score on the HFIAS scale (10.1) and the highest food insecurity levels of 16.1 and 15.9 were measured for Bonteheuwel and Kraaifontein respectively. There are significant differences between the areas in terms of the level of FS, but no significant difference in FS between farming and non-farming households.
A value of 10.4 was measured on the HDDS scale for the Cape Town Metropole. The areas showing the highest diet diversity were Mitchells Plain (11.7) and Gugulethu (11.3), while the measure for Bonteheuwel was very low at 8.97. This is an indication that households in the Bonteheuwel area experience higher levels of food insecurity and a much lower diversity in their diet. There are significant differences between the HDDS of the different areas, but none between farming and non-farming households. It can therefore be concluded that Urban Agriculture (UA) does not make a significant contribution to either access or diet diversity.
It was noted that farming households consume more roots and tubers, vitamin A fruit and vegetables, other vegetables and maize than non-farming households. This might be due to the fact that farming households produce some of the above-mentioned food groups. Non-farming households, however, consume more meat, pork, mutton, lamb and goat, and much more poultry than farming households.
The average total expenditure per month per household on food is R338.26. An average of R177.49 per month is spent on other cereals, which includes bread, followed by R176.84 spent on poultry and R134.37 spent on maize products.
Households in the informal settlement areas of the Cape Town Metropole experienced almost 4,5 hungry months during the previous 12 months. In 13.1% of the households, hunger was experienced by someone in the household at least for once a month during the past year.
It is noteworthy that households are especially affected by hunger during June and July, and in November and December. This might be due to the long school holidays when school feeding schemes are inactive and households have to provide food for children.
The majority of households (79.1%) reported an income of more than US$ 1.25 per capita per day, while 20.9% of the households are below this critical point. Only 51.4% of the respondents earn above the US$ 2 per capita per day level, with the rest below this amount.
Gugulethu households spend the most on food per month (R478.54), while Khayelitsha, Kraaifontein and Bonteheuwel spend less than R300.00. Khayelitsha also spent the lowest share of household expenditure (43%) on food. Kraaifontein spent 57% and Philippi 62% on household expenditure on food per month.
When food shortages arise, female and male adults are most likely to receive less food.
To conclude, when looking at the different dimensions of FS, the following levels in FS in the informal settlement areas of the Cape Town Metropole can be observed:
-
Access:
o The Household Food Insecurity and Access Scale shows that 77.7% of households are severely food insecure.
o With regards to the food poverty lines, just over 50% earn more than US$ 2 per capita per day, while 20.9% of the households are below the critical point of US$ 1.25 per capita per day.
o The average total household expenditure on food is R338.26, while an average of 52.5% of household expenditure is spent on food (share of expenditure spent).
-
Availability:
o The Hunger Index shows that 4.3 months of the year in all households and in 13.1% of the households, at least for once a month during the past year, someone had to go hungry.
-
Utilisation:
o 10.4 out of 18 on the Household Diet Diversity Score was measured for the different food groups/categories consumed.
o 47.7% and 41.4% of female and male adults respectively are most likely to receive less food when shortage occurs. Children to a much lesser extent (Intra household food distribution).
-
Sustainability:
o The ability to have sufficient access to food at all times is contained in a mix of the above measurements.
The levels in food insecurity in the informal settlement areas of the Cape Town Metropole are very high as measured in all FS dimensions.
Significant differences can be seen for all FS indicators between areas. Households in the Bonteheuwel and Kraaifontein areas are severely food insecure as measured by the HFIAS scale, while Gugulethu and Khayelitsha has the lowest appearance measured according to this scale. Bonteheuwel, Kraaifontein and Philippi has the lowest HDDS, while Gugulethu, Mitchelsplein and Khayelitsha have the highest HDDS. With regards to the Months of Adequate Household Provisioning Indicator (MAHFP), Bonteheuwel and Kraaifontein have the lowest values, proving to be more food insecure, while Gugulethu and Khayelitsha have the highest values. The same result can be seen with food poverty measures. Since the study analysed the FS situation of urban farming initiated by governmental projects, numerous aids were provided.
It can thus be concluded that there are no significant differences between the households involved in UA and those who are not. This might be a good indication of the severity of food insecurity for the Western Cape's Farmer Support and Development's (FSD) extension services. The FSD should target efforts to assist during hungry months in terms of feeding projects and other alternative measures. Further research should be done on the reasons why non-farming households spend less on food consumed than farming households.
REFERENCES
BATTERSBY, J. 2011. The State of Urban Food Insecurity in Cape Town. AFSUN Food Security Series. Retrieved from http://queensu.ca/samp/afsun/files/AFSUN_11.pdf on 22 November 2015. [ Links ]
CRUSH, J., HOVORKA, A. & TEVERA, D. 2011. Food security in Southern African cities: The place of urban agriculture. Progress in Development Studies, 11(4):285-305. https://doi.org/10.1177/146499341001100402. [ Links ]
D'HAESE, L., KARAAN, M., VAN ROOYEN, C. J. & VINK, N. 2016. Complexity of measuring food and nutrition security at household level and indicators for monitoring and evaluating change. Contribution to the IFAMA 2016 congress in Aarhus (Denmark). [ Links ]
D'HAESE, L., VASILE, M. & ROMO, L. 2013. Research Project "Rajah Grow Together" Food Security in Ekurhuleni, Gauteng Province, South Africa, Independent Study. [ Links ]
DE COCK, N., D'HAESE, M., VINK, N., VAN ROOYEN, C. J., STAELENS, L., SCHÖNFELDT, H. C. & D'HAESE, L. 2013. Food security in rural areas of Limpopo province, South Africa. Food Security, 5(2):269-282. https://doi.org/10.1007/s12571-013-0247-y. [ Links ]
DEITCHLER, M., BALLARD, T., SWINDALE A. & COATES J. 2010. Validation of a measure of household hunger for cross cultural use. US State Food security in rural areas of Limpopo province, South Africa 281. Department Third Annual Conference on program evaluation: New paradigms for evaluating diplomacy in the 21st Century. June 8-9. [ Links ]
FOSTER, J. E., GREER, J. & THORBECKE, E. 1984. A Class of Decomposable Poverty Measures. Econometrica, 52(3):761-766. https://doi.org/10.2307/1913475. [ Links ]
FRAYNE, B., PENDLETON, W., CRUSH, J., ACQUAH, B., BATTERSBY-LENNARD, J., BRAS, E. & ZANAMWE, L. 2010. The State of Urban Food Insecurity in Southern Africa. Progress in Development Studies. [ Links ]
HENDRIKS, S. L. 2015. The food security continuum: a novel tool for understanding food insecurity as a range of experiences. Food Security, 7(3):609-619. https://doi.org/10.1007/s12571-015-0457-6. [ Links ]
LABADARIOS, D., MCHIZA, Z. J., STEYN, N. P., GERICKE, G., MAUNDER, E. M., DAVIDS, Y. D. & PARKER, W. A. 2011. Food security in South Africa: a review of national surveys. Bulletin of the World Health Organization, 89(12):891 -899. https://doi.org/10.2471/BLT.11.089243; 10.2471/BLT.11.089243. [ Links ]
LEROY, J. L. J. P., VAN ROOYEN, C. J., D'HAESE, L. & DE WINTER, A. 2001. A quantitative determination of the food security status of rural farming households in the Northern Province of South Africa, Development Southern Africa, 18(1). [ Links ]
NICOLSON, G. 2015. South Africa: Where 12 million live in extreme poverty. Daily Maverick, HTTPS://WW, 2-4. Retrieved from http://www.dailymaverick.co.za/article/2015-02-03-south-africa-where-12-million-live-in-extreme-poverty/#.VvEdHBJ95V8. [ Links ]
PHILANDER, F. R. 2015. An Appraisal of Agriculture as a Livelihood Strategy for Household Food Security: A Case Study of Urban Food Gardens in Ward 51, Langa, Cape Town. Masters Thesis. University of the Western Cape. [ Links ]
STATISTICS SOUTH AFRICA. 2015. National poverty lines and development Methodological report on rebasing of national poverty lines and development on pilot provincial poverty lines Technical Report, 1 -22. [ Links ]
SWANEPOEL, J. W., VAN NIEKERK, J. A. & D'HAESE, L. S. 2017. The socio-economic profile of urban farming and non-farming households in the informal settlement area of the Cape Town metropole in South Africa. S. Afr. J. Agric. Ext., 45(1):131-140. DOI: http://dx.doi.org/10.17159/2413-3221/2017/v45n1a447 [ Links ]
WESTERN CAPE DEPARTMENT OF AGRICULTURE. 2015. Impact Evaluation of the Food Security Programme on Household Food Security in the Western Cape. Retrieved from: http://www.elsenburg.com/sites/default/files/Food%20security_0.pdf on 1 February 2016. [ Links ]
Corresponding author: J. W. Swanepoel. Email: SwanepoelJW@ufs.ac.za

