


Serviços Personalizados
Artigo
 Inglês (pdf)
 Artigo em XML
 Referências do artigo
Indicadores

Links relacionados
-
 Citado por Google
 -
 Similares em Google
Compartilhar

 Permalink
South African Journal of Agricultural Extension
versão On-line ISSN 2413-3221
versão impressa ISSN 0301-603X
S Afr. Jnl. Agric. Ext. vol.46 no.1 Pretoria 2018
http://dx.doi.org/10.17159/2413-3221/2018/v46n1a467
ARTICLES
An analysis of the indicators affecting urban household food insecurity in the informal settlement area of the Cape Town Metropole
Swanepoel J. W.I; van Niekerk J. A.II; van Rooyen C. J.III
ICentre for Sustainable Agriculture, Faculty of Natural and Agricultural Sciences, University of the Free State, Republic of South Africa, +27 (0)51 401 2163, SwanepoelJW@ufs.ac.za
IICentre for Sustainable Agriculture, Faculty of Natural and Agricultural Sciences, University of the Free State, Republic of South Africa, vNiekerkJA@ufs.ac.za
IIICentre for Sustainable Agriculture, Faculty of Natural and Agricultural Sciences, University of the Free State, Republic of South Africa, cjvr@sun.ac.za
ABSTRACT
Households in the informal settlement areas of the Cape Town Metropole face different challenges in terms of poverty and food security. Challenges are determined by the social and economic circumstances these households subside in. Many initiatives by the Western Cape Department of Agriculture was initiated to aid households in these areas. Some of the initiatives include the implementation of urban household and community food gardens assisted by the Department's extension division. A thorough analysis of these indicators is imperative to initiate development planning. The results showed that 26.1% of household heads completed school, while 33.8% did not reach secondary school (grade 7). The average household size is 4.29 persons in the study area. The average age of household head was 48 and 50.64 years for non-farmer groups and urban farming households respectively. The average monthly income per household was R3543.22. The main source of income generated throughout the year derived from formal salaries or wages (46.4%), while child support grants and pension funds also contributed towards income. Expenditure factors accounts for 20.4% of the variance of factors affecting food security. The expenditure component is comprised by the share of food expenditure on income, the total value of food consumed and the household diet diversity score. The socio-economic indicators component forms the second largest component group (15.15%), while the components with a lesser effect include a food security component, an urban farming component and a geographical and market component.
Keywords: Urban Agriculture, household gardens, community gardens, food security, household size, age, gender, education level, migrant workers, household income.
1. Introduction
With countries recognising the level of food insecurity, platforms were established to progress towards an international state of adequate food availability, access, utilisation and stability. Accordingly, South Africa agreed to the vision statement of the Integrated Food Security Strategy (IFSS) (National Department of Agriculture, 2002), which is "to attain universal physical, social and economic access to sufficient, safe and nutritious food by all South Africans at all times to meet their dietary and food preferences for an active and healthy life".
The Food and Agriculture Organisation (FAO, 2015) defined food security where a situation exists where all people, at all times, have physical, social and economic access to sufficient, safe and nutritious food that meets their dietary needs and food preferences for an active and healthy life.
Development programmes aiming to alleviate food insecurity and reduce poverty need methods to identify and target those households most affected. It is however challenging to develop a perfect method of measurement due to the multi-dimensional nature of food security. Subsequently, policy-making and development programmes are dependent on standardised indicators in order to improve the accuracy on measurement and evaluation of food security.
The multiple factors that influence the access to food are not well understood, with this being more evident at household level. Measurements that are inaccurate and not precise may limit the usefulness of indicators. Certain validation criteria must be met in order to monitor the impact of policy implications on food security. Within this framework, the factors or indicators affecting food security will be analysed in this article.
2. METHODOLOGY
2.1. Study area and data collection
The study was conducted in the informal settlement areas that form part of the Cape Town Metropole of the Western Cape Province in South Africa. Households in the study area included a combination of community and household farmers involved in project gardens funded by the Department of Agriculture in the Western Cape. Farmers comprised of those owning house gardens or those involved in community gardens. Randomly selected non-farming households of the same area thus served as the control group.
The informal settlement areas in the Cape Town Metropole selected to conduct the surveys in are:
-
Gugulethu
-
Khayelitsha
-
Kraaifontein
-
Mitchells Plain
-
Bonteheuwel
-
Philippi
These areas are known to house some of the poorer communities in the Cape Town Metropole.
Quantitative data were collected by using questionnaires that included questions constructed to include different social characteristics of the household, the food security situation based on different food security indicators, household income and expenditure, household food production, access to water and to markets and access to governmental support programs. It thus contributed to an in-depth comprehension of the social and economic aspects of food security at household level and the identification of the factors influencing food security at household level by including the four major food security components, namely food availability, food accessibility, food utilisation and food system stability.
A total of 223surveys were completed however three were eliminated due to outlying values, resulting 220 households that were analysed.
2.2. Data analysis
Statistical analysis of data was carried out with the statistical software programme, Statistical Package for the Social Sciences (SPSS, version 24) to determine the level of food security in the Cape Town Metropole. Pearson's correlation coefficient (r) was computed between different food insecurity levels in order to determine the extent to which values of both parameters are correlated. Tukey-Kramer method was the multiple comparisons procedure used for the simultaneous estimation of pairwise differences of means in one-way Analysis of Variance (ANOVA).
Principal factor analysis (PFA) was performed to measure the significance of different factors affecting food security. The purpose of this multivariate statistical technique is used to reduce correlated data into a few uncorrelated components or factors explaining the maximum variance. As explained by Reimann, Filzmoser & Garrett (2002), the principal factors were calculated based on a correlation matrix. In this study, the Kaiser normalisation, a varimax orthogonal rotation, was used as the rotation method.
It is specified as:
P1 = a11x1 + a12x2 + *** + a1nxn
P2 = a21x1 + a22x2 + *** + a2nxn
P3 = a31x1 + a32x2 + *** + a3nxn
Pn = an1x1 + an2x2 + *** + annxn
Where;
P1p2 Pn = observed variable/factors constraining food security.
A1 an = factor loading correlation coefficients.
X1x2Xn = unobserved underlying factors constraining the study selected factors with.
3. RESULTS
3.1. Household socio-economic demographic characteristics
Table 2 shows a summary of the household characteristics of the informal settlements in the Cape Town Metropolitan Area.
The average household size for surveyed households in the Cape Town Metropole was 4.3 members per household (Table 3). When comparing average household size between urban farmers and households not involved in farming, the average households consist of 4.17 and 4.56 members respectively. In comparison, the average household size reported by D'Haese, Vasile & Romo (2013) in the Ekurhuleni district of the Gauteng province consist of 5.66 members on average, while Frayne, Battersby-Lennard, Fincham & Haysom (2009) reported the average household size for Cape Town to be 3.9 and for Johannesburg to be 3.8. There is no significant difference between urban farming households with households not involved in farming. There are however significant differences in household size between areas. Khayelitsha has the highest average household size with 5.3 members per household, while Philippi and Gugulethu have the lowest average household size with 3.4 and 3.6 respectively. Female-headed households have a higher average household size (4.4) than male-headed households (4.2) do.
There are no significant differences in the average age of household heads between the areas. The average age of household heads was 49.8 years. This corresponds with a study done in Gauteng (D'Haese et al., 2013) with an average age of the household head to be 47 years old; and is lower than household heads in Limpopo (De Cock, D'Haese, Vink, Van Rooyen, Staelens, Schönfeldt & D'Haese, 2013). Battersby (2011) reported average age of the head of the household to be 52 and 46 years respectively for Philippi and Khayelitsha.
The survey showed that 100 (45%) of the household heads were male with an average age of 48.7 years, while 122 (55%) of the surveyed household heads were female with an average age of 50.7 years. There is no significant difference between the ages of male and female household heads.
Less than half of the household heads (40.1%) obtained some secondary level of education (grade 8 to grade 11). Only 4.5% of them had no schooling, while 9% obtained junior primary (grade 0 to grade 4) and 20.3% finished primary school (grade 5 to grade 7). Only 16.2% of respondents had completed school (matric), 5.4% did some courses or certificates for formal training and 3.6% attained a diploma or degree. Kraaifontein household heads could only reach senior primary level or grade 7 on average, while all the other informal settlement areas had an average education level up to some secondary level or grade 11. There is also no significant difference between qualification level between males and females. A study done in Langa showed 63% of household heads involved in urban agriculture received some secondary education and similarly, 7% completed school, 5% completed college and another 2% completed university (Philander, 2015).
No significant difference was found for the ratio between the number of active adults towards household size. There is however a significant difference between the average ratio for number of people working compared to household size. In this instance, male headed households have 46% working household members, while female headed households have only 33% working members compared to household size.
Significant differences exist in the number of active adults between the informal settlement areas of the Cape Town Metropole. Philippi reported 2.4 active adults per household size and Khayelitsha reported 3.7. Differences in the number of persons receiving an income per household size can also be seen between the informal settlement areas with 0.5 for Gugulethu and 0.3 for Bonteheuwel. This is slightly lower than reported by De Cock (2012) in the rural areas of Limpopo. Values below 0.3 indicates that there is a high responsibility on the household members that receive an income as they have to support a high number of other family members.
The dependency ratio of 0.39 is calculated upon members contributing to the household income over the total household members. This threshold of lower than 0.5 indicates that there are fewer people working towards an income than members of the household that are unemployed. Values that are closer to 0.3 indicate that the financial responsibility on the household members earning income are very high, since they have to support a higher number of family members (Table 4).
The number of persons earning an income per household size are 0.36 and 0.40 for non-farmers and urban farmers respectively. These values do not differ significantly. However, significant differences for the number of persons receiving an income per household size, can be seen between areas. The value for Gugulethu is 0.51, which is above the threshold of 0.5, indicating that there are fewer household members earning an income than members of the household that do not earn an income. For Khayelitsha, Philippi, Mitchells Plain and Kraaifontein, this ratio was calculated to be 0.42, 0.41, 0.37 and 0.34 respectively. Only Bonteheuwel had a value of 0.294, which is lower than 0.3. Values below 0.3 indicates that there is a high responsibility on the household members that receive an income as they have to support a high number of other family members.
Philippi and Kraaifontein had 100% African households, while Gugulethu, Khayelitsha and Mitchells Plain had 93.94%, 97.37% and 88.57% African households respectively. Bonteheuwel was predominantly made up of Coloured households (80%).
The majority of households have been living in the respective informal settlement areas of the Cape Town Metropole for an average of 20 years. It was reported that the household heads had lived on average 14.4 years in Kraaifontein, which is the shortest period of all groups studied, and for an average of 29.5 years in Bonteheuwel, which is the longest time.
An impressive 94.5% of respondents volunteered income information. The mean average total household income of the 209 respondents sharing income information reported an average income of R3543.22 per month. There is no significant difference between the average total income per year for households involved in urban agriculture and those not involved in urban agriculture.
When considering the different types of agriculture, no significant difference was found between the average total household income for households not involved in agriculture and those who are. Gugulethu has the highest average yearly income of all the groups with R69 506.25, while Kraaifontein and Bonteheuwel reported the lowest annual household income of R28 412.73 and R25 490.32 respectively. There are significant differences between the informal settlement areas in terms of household income. Household farmers in Gugulethu, Khayelitsha, Kraaifontein, Gugulethu and Philippi have a larger average total yearly income, while non-farming households in Mitchells Plain have the larger average total yearly income.
The main income source of respondents predominantly came from formal salaries or wages (46.4%), while 13.1% and 11.7% reported that child support grants and pension funds respectively are also main sources of income. Less than half of households (44.5%) reported that they had no secondary source income. Other sources for a secondary income included child support or grant (16.8%), formal salary or wages (14.1%) and to a lesser extent, farming activities combined contributed to 10% of the secondary income source. The most important source of income for all the farming types is formal salary or wages. About half of the households not involved in agriculture (48%) have formal salary or wages as first income source. This was also the case with the urban farmers.
Child support grant was the first source of income for 21.9% of the non-farming households and 9.6% of the urban farming households. Agricultural related activities are the first source of income for just over 10% of urban farming households. The above socio-economic indicators are well described in an article by Swanepoel, Van Niekerk & D'Haese (2017).
Table 5 shows the Household Food Insecurity Access Scale level in relation to some livelihood characteristics. As seen, significant differences can be observed between the level on the Household Food Insecurity Access Scale for income less than US$ 1.25 and US$ 2.00 per capita per day. There are significant differences observed for access to formal salary as well as access to grants and gifts. There were also significant differences between the levels of food security with regarding to farm income.
Table 6 displays the farming status in relation to the different food security indicators identified to influence food security. As seen, there is no significant difference between the non-farming and farming households for any of the food security indicators.
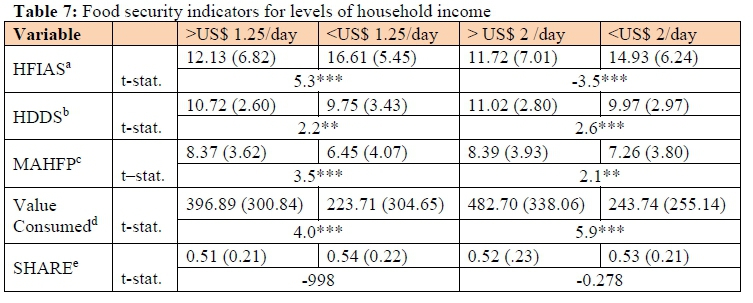
There were significant differences between both the food poverty indexes for the US$ 1.25 and US$ 2.00 levels for Household Food Insecurity Access Scale (HFIAS), Household Diet Diversity Score (HDDS), Months of Adequate Household Provisioning (MAHP) and the value of food calories consumed in South African Rand, but not for the share of food expenditure in total expenditure (Table 7). This was also the case where both farming and formal salaries and wages were reported to be main sources of income. Where the main source of income was reported to be grants and gifts, it was significant for only Household Food Insecurity Access Scale and value of food calories consumed in South African Rand. Participatory decision-making was not significant for any of the food security indicators.
3.2. Household production and institutional environment
Households from the Cape Town Metropole reported to primarily use communal land to grow crops (26.8%) and 20.9% utilise their own private land to grow crops, while 5.5% use rented land to grow crops. Communal land is mostly used for grazing (2.3%), but only two respondents reported to have their own land for grazing.
The average size of land households has available for food production was 1211.63m2. Gugulethu households have land for crops with an average size of 3995.6 m2 and Philippi households have an average size of 1534.89m2. Bonteheuwel and Khayelitsha households have an average size of 989.5 and 959.4 m2 respectively. Mitchells Plain residents reported 263.2m2 of land to produce crops, while Kraaifontein households only has 24.9m2. There is a significant difference between the sizes of land between the informal settlement areas.
Very little of the available land for crops are privately owned. Only Mitchells Plain households own most of the land available, while Kraaifontein and Philippi households own about 50% of available land. In all the areas, crops are irrigated to some extent. More than half of Gugulethu (65.7%), almost 100% of Khayelitsha and Bonteheuwel, a third of Philippi and Kraaifontein and only 1.5% of Mitchells Plain land available for crop production is irrigated.
There are significant differences between areas in terms of the size of land irrigated. Irrigation takes place usually from boreholes (12.3%), tanks (4.1%), rain (14.1%), neighbours (5%), hosepipes (3.2%) or taps (3.2%). Furthermore, 40% of household farmers found the lack of water to be a large constraint for crop production.
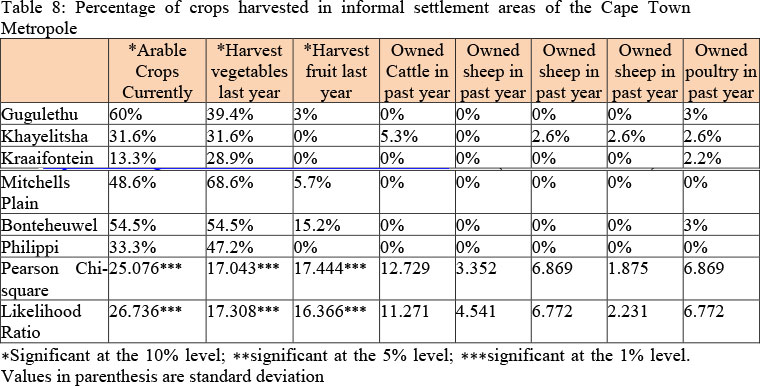
There are significant differences between informal settlement areas of the Cape Town Metropole in terms of their crop indexes. As such, 60% of households in Gugulethu have arable crops, while this is the case with 54.5% of households in Bonteheuwel, 48.6% in Mitchells Plain, 33.3% in Philippi, 31.6% in Khayelitsha, and 13.3% in Kraaifontein (Table 8). There are significant differences between the areas.
During the previous year, 68.6% of Mitchells Plain and 54.5% of Bonteheuwel households harvested vegetables, while they also harvested the most fruit with 15.2% and 5.7% respectively. A very low number of livestock was reported.
Water in all informal settlement areas of the Cape Town Metropole is mostly provided by an internal pipe (51.4%) or a tap in the yard (40.5%). It was also reported that free water from a public tap was used to a lesser extent.
Households from all informal settlement areas of the Cape Town Metropole reported that basic food items could be bought from shops that are on average less than a walk of nine minutes away. Markets to buy goods and food are a bit further away, and it would take households between 14 to 22 minutes to get there. In all areas, banks and post offices are on average less than 28 minutes away, whilst the post office in Khayelitsha is on average 34.4 minutes of travel away from households.
It would take households from the different informal settlement areas of the Cape Town Metropole between 16 and 23 minutes to get to the closest market to sell their goods and food. There are no significant differences in the distance to markets between areas.
One of the challenges mentioned by households in the informal settlement areas was a lack of experience and that this hampers their production. In Gugulethu, the lack of seeds, fertilizer and money, and the presence of pests were the biggest challenges.
For Khayelitsha, insufficient funds were their biggest concern, followed by pests. The lack of seeds, fertilizer and money was the biggest challenges Kraaifontein households faced followed by a lack of water and labour. Mitchells Plain reported the lack of seeds, the lack of fertilizer and the lack of money as the biggest challenges, while Bonteheuwel and Philippi identified the lack of money as their biggest challenge concerning production followed by the lack of seeds and the lack of fertilizer.
Other reasons mentioned as production challenges included the following:
-
All available land has been used for crops;
-
Lack of equipment;
-
Lack of land;
-
Material to maintain the land;
-
Money;
-
No space;
-
Does not own land;
-
No space in yard;
-
Not enough equipment;
-
Not enough information;
-
Not enough land; and
-
Still preparing land.
The stresses and shocks mentioned by the respondents include the increase of food prices, which was the most common stress factor reported, with 26 occurrences during the past year, while the increase in food production costs also played a role with 16 occurrences.
When respondents were asked whether any situations occurred due to any stresses or shocks that made the household suffer in some way the past year, only 15% reacted that this was true. Mostly households from Bonteheuwel (24.2%), Mitchells Plain (22.9%) and Gugulethu (21.2%) experienced shocks or stresses.
The increase in food production costs were especially experienced as a stressor by households from Gugulethu, with seven occurrences during the past year (15%), Mitchells Plain with eight occurrences during the past year (14.3%) and Bonteheuwel with six occurrences during the past year (15.2%). The other areas did not experience this factor as a stressor. Only 9.1% of Bonteheuwel residents reported that serious injury or chronic illness during the previous 12 months kept a household member from doing normal activities which causes the household to suffer to a certain extent. This informal settlement area was also influenced by job loss of the breadwinner (9.1%). Theft was one of the stress factors mentioned by Gugulethu (9.1%), Mitchells Plain (8.6%) and Bonteheuwel (6.1%) households. The increase in food prices was a stressor that affected Gugulethu (21.2%), Mitchells Plain (22.9%) and Bonteheuwel (18.2%) households most. The death of a family member was especially prominent in reports by Gugulethu (9.1%), Khayelitsha (7.9%) and Mitchells Plain (14.3%) households.
In households where none of the members are employed, there were eight occurrences during the past 12 months where higher production costs were reported to be a stress factor for households in the Cape Town Metropole, while there were six occurrences when one member was employed and only two occurrences with two employed household members. This indicates that the more members of the household are employed, the less effect higher production costs would have on them. The same trend could be seen with the increase of food prices. Most occurrences took place with no employed members (nine), eight occurrences with one working member, six occurrences with two working members, two occurrences with three employed members and one occurrence where four members are employed.
Very few households (6.4%) in the Cape Town Metropole reported a severe or sudden drop in income. Some strategies were adopted by households to serve as a buffer for the severe or sudden drop in income. The strategies households applied were mostly to borrow money from friends and family. Households also reduced spending, while others borrowed from unregistered credit providers commonly known as loan sharks ("mashonisa") and to a lesser extent some households sold some assets, used savings or did some additional work.
When food shortages arose in the surveyed households, several strategies were put in place by the households. Only 8.2% of households reported that they mostly rely on other family members in difficult times, 6.4% rely on neighbours, 5.5% rely on family or relatives elsewhere, while 3.6% rely on the church. Help is often provided by means of food (10%), money (9%), counselling (4.1%) or childcare (1.8%).
Furthermore, 6.4% (n =14) of households in the Cape Town Metropole reported a severe or sudden drop in income. This includes four households in Gugulethu, one in Khayelitsha, five in Mitchells Plain and four in Bonteheuwel. Households in Bonteheuwel borrowed food from friends, used savings, borrowed money from family or friends, borrowed from "mashonisa", reduced spending or reduced food consumption to adapt to a sudden drop in income. The same strategies were also applied by households in Gugulethu, Khayelitsha and Mitchells Plain, except that none of these reported selling assets. Borrowing money played a big role in all the informal settlement areas of the Cape Town Metropole. Households in Gugulethu especially reduced food consumption when income dropped.
To overcome food shortages, more than 10% of households from Gugulethu and Mitchells Plain reported to mostly eat less preferred food, reduce food intake, borrow money for food and restrict consumption in favour of children. Mitchells Plain and Bonteheuwel limited or reduced portion size. Only Bonteheuwel households (15.2%) skipped meals for an entire day due to food shortages. Bonteheuwel, Gugulethu and Mitchells Plain households asked neighbours or families' assistance or used savings.
Since the study analysed the food security situation of urban farming initiated by governmental projects, numerous aids were provided. Extension services played a pivotal role in the advising and training of these urban farmers. The following aid programmes were reported:
-
Fifteen households reported to have received agricultural starter packs;
-
Sixteen households were involved in the Comprehensive Agricultural Support Programme (CASP);
-
Fourteen households were beneficiaries of municipal implemented food security projects;
-
Other programmes and schemes implemented to a lesser extent include the Extended Land Care Programme (LCP), the Extended Public Works Programme (EPWP), the Poverty Relief Programme (PRP), the Food Parcel Scheme (FPS), the Land Redistribution for Agricultural Development (LRAD), the National School Nutrition Programmes (NSNP), and the Unemployment Insurance Fund (UIF).
The Agricultural Starter Pack Programme (ASPP) was implemented in six households in Gugulethu, two in Kraaifontein, four in Mitchells Plain and three in Bonteheuwel. CASP benefitted seven households in Gugulethu, two in Khayelitsha, one in Kraaifontein, three in Mitchells Plain, one in Bonteheuwel and two in Philippi. There are significant differences between the informal settlement areas of the Cape Town Metropole for both the ASPP and CASP programmes. Gugulethu also received more aid through the Expanded Public Works Programme (EPWP) and Land Care Programme (LCP). Gugulethu and Philippi areas were especially aided by the municipal implemented food security projects whereby six households in each area received aid and almost none of the other areas surveyed.
It is worthy to note that Gugulethu benefited in 42.7% of aid programmes implemented in the Cape Town Metropole. Philippi and Mitchells Plain benefited from 18.7% and 16.0% respectively, while Khayelitsha, Kraaifontein and Bonteheuwel households were only aided by 8%, 8% and 6.7% of the reported aid projects respectively. From the data it was clear that females were assisted in 50% more cases than males.
3.3. Factor analysis
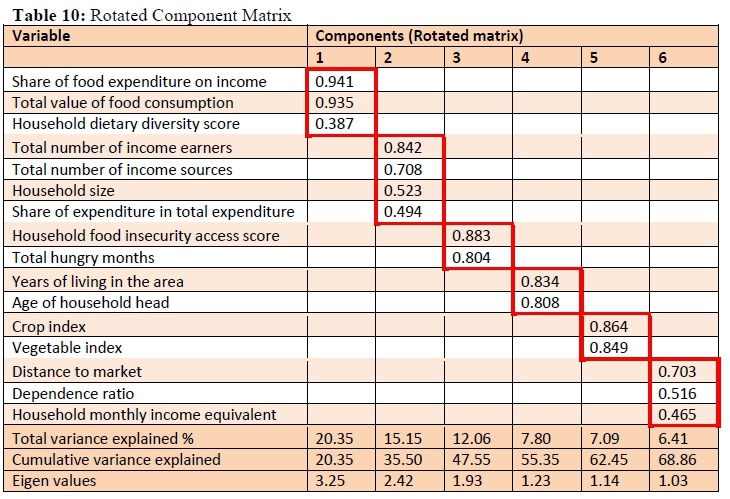
Principal component analysis was carried out on 16 variables. In the Rotated Component Matrix, 16 of these variables satisfied the 0.4 cross-factor loading threshold in the Varimax rotated matrix (Table 10) with a Kaiser-Meyer-Olkin (KMO) test (Table 9), indicating a middling sampling adequacy so that they are easier to interpret. As seen in Table 9, the Bartlett's Test of Sphericity show that the results are statistically significant.
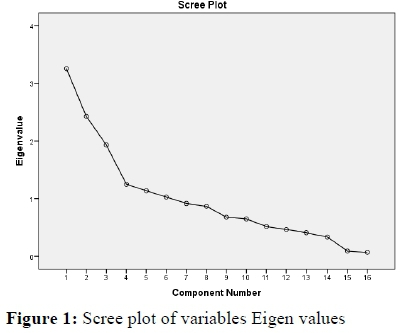
The assumption of independent sampling was met. The assumptions of normality, linear relationships between pairs of variables, and the variables being correlated at a moderate level were checked and mosaic pattern test did not meet the assumptions, in that it was correlated at a low level with each of the other variables. Six components were rotated, based on the eigenvalues over 1 criterion and the scree plot (Figure 1). After rotation,
o the first component accounted for 20.35% of the variance,
o the second component accounted for 15.15% of the variance,
o the third component accounted for 12.06% of the variance,
o the fourth component accounted for 7.80% of the variance,
o the fifth component accounted for 7.09% of the variance, and
o the sixth component accounted for 6.41% of the variance.
The Principal components analysis with Varimax rotation was conducted to assess how certain variables that influence urban household food security are clustered. Table 10 displays the items and component loadings for the rotated components, with loadings less than .30 omitted to improve clarity.
While keeping with zero-order correlations, the results suggest the following coherent components as identified in common themes (in red blocks) (Table 10):
1. Expenditure factors
o Share of food expenditure on income;
o Total value of food consumed; and
o Household Diet Diversity Score.
2. Household and Socio-economic Indicators
o Total number of income earners;
o Total number of income sources;
o Total household size; and
o Share of food expenditure on total expenditure.
3. Food security Indicators
o Household food security access score; and
o Total Hungry months.
4. Time Indicators
o Years living in the area; and
o Age of household head.
5. Urban Farming Indicators
o Vegetable-index (Total number of vegetables cultivated); and
o Crop-index (Total number of crops cultivated).
6. Geographical and Market Indicators
o Distance to market;
o Dependency ratio; and
o Household monthly income equivalent.
The first component (Expenditure factors) accounts for 20.35% of variance and it is characterised by factors relating to expenditure on food. The factors that accounts for the highest variance within this component is the share of food expenditure on income. This is an indicator of household food security, since more vulnerable households spend a higher proportion of their disposable incomes on food. This factor goes hand in hand with the total value of food consumed, which indicates how much income is spent on food. The household Diet Diversity Score is included in this group, since the groups of food purchased (diversity) are dependent on the amount of purchase power available. This is in accordance to Engel's Law on food expenditure in relation to income (Perthel, 1975).
A household and socio-economic indicators component was also identified since the grouping relates to the total number of individuals in the household earning an income, the number of income sources, size of the household and the share of food expenditure on total expenditure. Thus, the more members of a family earning an income, and the more sources of income in relation to the number of people within the household, the higher the possibility would be that the household would be food secure. The above factors can also determine the proportion of total expenditure spent in relation to food expenditure. These factors are a good grouping for this component and accounts for 15.15% of variance.
The third component is comprised of food security indicators and accounts for 12.06% of the variance. The household food insecurity access scale and hunger index (total hungry months) are directly correlated with each other in this study and are determinants of the level of food security and covers accessibility. It also relates to the availability of food and the household's ability to access it.
The number of years living in the area and the age of the household head at the time of conducting the data collection are grouped together in the rotated component matrix. Time indicators constitutes 7.80% of the variance. Long periods of residence may be an indication of stability due to good public policies.
The urban farming component accounts for 7.09% of the variance and contains the vegetable and crop index. The vegetable and crop indexes are determined by the number of different vegetables and crops produced by urban farmers.
Geographical and Market Indicators include the distance to market, dependency ratio and household monthly income equivalent. This component demonstrates 6.41% of the total variance.
4. Discussion and Conclusions
The factor analysis showed the expenditure component accounts for 20.35% of variance and it is characterised by factors relating to expenditure on food. The expenditure component is comprised by the share of food expenditure on income, the total value of food consumed and the household diet diversity score. Since the groups of food purchased (diversity) are dependent on the size of purchase power available, this factor fits within this component group. The socio-economic indicators component forms the second largest component group (15.15%), which includes the total number of individuals in the household earning an income, the number of income sources, the size of the household and the share of food expenditure on total expenditure. The two most important components are mostly concerning income and expenditure factors, demonstrating that these factors are the biggest contributors towards food security. Other components with a lesser effect include a food security component, which include food security indicators, an urban farming component and a geographical and market component.
It can thus be concluded that for urban farming households supported by Farmer Support and Development through extension services, income and expenditure related factors, are the most important component of factors influencing household food security. These households therefore rely more on salaries or wages to overcome food insecurity faced by them than agricultural related factors.
5. RECOMMENDATIONS
It is evident that income and expenditure factors, and not the practice of urban agriculture, play a substantial role towards factors influencing food security, especially for households in the informal settlement areas of the Cape Town Metropole. It is vital to stimulate the economy in these areas for members of households to have more access to job opportunities and therefore income to improve food security.
REFERENCES
BATTERSBY, J. 2011. The State of Urban Food Insecurity in Cape Town. AFSUN Food Security Series. Retrieved from http://queensu.ca/samp/afsun/files/AFSUN_11.pdf on 22 November 2015. [ Links ]
DE COCK, N. (2012). A comparative overview of commonly used food security indicators, case study in the Limpopo Province, South Africa. Faculty of Bioscience Engineering. 2012, Masters. [ Links ]
DE COCK, N., D'HAESE, M., VINK, N., VAN ROOYEN, C. J., STAELENS, L., SCHÖNFELDT, H. C. & D'HAESE, L. 2013. Food security in rural areas of Limpopo province, South Africa. Food Security., 5(2):269-282. https://doi.org/10.1007/s12571-013-0247-y. [ Links ]
D'HAESE, L., VASILE, M. & ROMO, L. 2013. Research Project "Rajah Grow Together" Food Security in Ekurhuleni, Gauteng Province, South Africa, Independent Study. [ Links ]
FOOD AND AGRICULTURE ORGANISATION. 2015. Regional Overview of Food Insecurity Africa. https://oi.org/10.1080/04597238908460834. [ Links ]
FRAYNE, B., BATTERSBY-LENNARD, J., FINCHAM, R. & HAYSOM, G. (2009). Urban food security in South Africa: Case study of Cape Town, Msunduzi and Johannesburg. Development Planning Division Working Paper, (15):4-43. [ Links ]
NATIONAL DEPARTMENT OF AGRICULTURE. 2002. Integrated food security strategy for SA, (July), 47. Retrieved from http://www.nda.agric.za/docs/Policy/Foodsecuritystrat.pdf on 3 May 2016 [ Links ]
PERTHEL, D. 1975. Engel's Law Revisited. International Statistical Review, 43(2):211-218. Retrieved from http://are.berkeley.edu/courses/ARE251/fall2009/Papers/perthel75.pdf on 21 February 2016. [ Links ]
PHILANDER, F. R. 2015. An Appraisal of Agriculture as a Livelihood Strategy for Household Food Security: A Case Study of Urban Food Gardens in Ward 51, Langa, Cape Town. Masters Thesis. University of the Western Cape. [ Links ]
REIMANN, C., FILZMOSER, P. & GARRETT, R. G. 2002. Factor analysis applied to regional geochemical data: problems and possibilities. Appl. Geochem. 17, 185e206 Republic of South Africa. (2014). Food and Nutrition Security. Retrieved from http://www.fao.org/ag/agp/greenercities/en/whyuph/foodsecurity.html on 12 April 2016 [ Links ]
SWANEPOEL, J. W., VAN NIEKERK, J. A. AND D'HAESE, L. S. 2017. The socio-economic profile of urban farming and non-farming households in the informal settlement area of the Cape Town metropole in South Africa. S. Afr. J. Agric. Ext., 45(1):131-140. DOI: http://dx.doi.org/10.17159/2413-3221/2017/v45n1a447 [ Links ]
Corresponding author: J. W. Swanepoel, Email: swanepoeljw@ufs.ac.za

