


Serviços Personalizados
Artigo
 Inglês (pdf)
 Artigo em XML
 Referências do artigo
Indicadores

Links relacionados
-
 Citado por Google
 -
 Similares em Google
Compartilhar

 Permalink
South African Journal of Agricultural Extension
versão On-line ISSN 2413-3221
versão impressa ISSN 0301-603X
S Afr. Jnl. Agric. Ext. vol.45 no.1 Pretoria 2017
http://dx.doi.org/10.17159/2413-3221/2017/v45n1a447
ARTICLES
The socio-economic profile of urban farming and non-farming households in the informal settlement area of the Cape Town Metropole in South Africa
Swanepoel J.W.I; Van Niekerk J.A.II; D'Haese L.III
ICentre for Sustainable Agriculture, Faculty of Natural and Agricultural Sciences, University of the Free State, Republic of South Africa, +27 (0)51 401 2163, SwanepoelJW@ufs.ac.za
IICentre for Sustainable Agriculture, Faculty of Natural and Agricultural Sciences, University of the Free State, Republic of South Africa, vNiekerkJA@ufs.ac.za
IIIDepartment of Agricultural Economics, Ghent University, Belgium, Luc.dhaese@ugent.be
ABSTRACT
Households in the informal settlement area of the Cape Town Metropolitan area face different challenges in terms of poverty and food security. Livelihood of households are determined by the social and economic circumstances these households subside in. A thorough analysis of these indicators is imperative to initiate development planning. This study looks at average household size, the average age of the household head, gender, education, ethnic group and household income. The average household size was 4.32 members, while the average age was 50. More female headed households formed part of the study, while 40.1% of the household heads had obtained some secondary level of education. Furthermore, most households were African and their main source of income came from formal salaries and wages. The results showed that additional sources of income are required to run a household, therefore, means of increasing household income, and in return, increasing food security, need to be investigated.
Keywords: Community gardens, food security, household gardens, urban agriculture
1. INTRODUCTION
The beginning of the millennium brought world leaders together to form a broad vision, compiled in the Millennium Development Goals (MDG's), to fight poverty in all its dimensions (United Nations, 2015). These goals have remained the framework for poverty reduction for the past 15 years. A new set of goals, the Sustainability Development Goals (SDG's) were designed to replace the MDG's. These where an identified and analysed set of indicators created to highlight critical gaps and challenges moving towards 2030. It would thus create a balance between the three dimensions of sustainable development which include; environmental, social, and economic dimensions (United Nations, 2016). This new development agenda applies to all countries, and promotes peaceful and inclusive societies, where better jobs are created and environmental challenges, especially climate change are addressed. The SDG's are aligned to South Africa's National Development Plan (NDP), and has sustainable development at its core (Department of Environmental Affairs, 2016).
The rate of urbanisation is however not concurrent with the rate of economic growth and the rates of urban poverty are getting worse (Stewart, Korth, Langer, Rafferty, Da Silva & Van Rooyen, 2013). Food insecurity and malnutrition are direct results of urban poverty causing urban populations to depend on rural food production. The Western Cape Department of Agriculture have several initiatives to address the deteriorating food security situation in the informal settlement areas of the Cape Town Metropole. These include agricultural starter packs for household gardens, support for community and school gardens, extension services and other community projects. In contribution to this, Van Niekerk & Stroebel (2011), stressed the importance of effective farmer support and development.
This paper is an overview of the socio-economic profile of urban farming and non-farming households in the informal settlement area of the Cape Town Metropole in South Africa. Detailed data of the households are very important to initiate development planning. It is also necessary to have regular surveys to stay current with expenditure and income, poverty levels, food security levels and other needs.
2. METHODOLOGY
2.1 Study Area
The Western Cape's agricultural sector is unique from other provinces in South Africa, mostly in terms of physical resource. The winter rainfall region of the Winelands and the year-round rainfall of the Southern Cape enable a variety of crop mix and production potential. It is well known that agriculture plays a significant role in the Western Cape. The Cape Town Metropolitan area is approximately 2,461 km2 and according to the 2011 census houses 3 740 025 people with an unemployment rate of 23.8%. Cape Town is the second largest urban area in South Africa and migration rates account for 41% of the annual population growth in Cape Town. It is the provincial capital and primate city of the Western Cape, as well as the legislative capital of South Africa, where the National Parliament and many government offices are located (Battersby, 2011a).
An increase in population size of 29.3% was seen from 2001 to 2011 (City of Cape Town, 2012). During this period growth mostly occurred in the informal sector, due to the fast growth of informal settlements. According to Leaning (2015), a positive correlation could be seen between the rise of informal settlements with rising poverty and unemployment rates.
2.2 Data Collection Phase
Households in the study area, which included a combination of about 25 community and household farmers involved in project gardens funded by the Department of Agriculture in the Western Cape, supported by extension officers, and at least eight randomly selected non-farming households of the same area were selected to do the survey. The non-farmers would thus serve as a control group. Farmers comprised of those owning house gardens or those involved in community gardens.
Surveys were conducted in; Gugulethu, Khayelitsha, Kraaifontein, Mitchellsplain, Bonteheuwel, and Philippi. These areas are representative of informal settlements in the Cape Town Metropole and are seen as some of the poorer areas in this region. The Western Cape Department of Agriculture assists people in these areas to start household or community gardens.
A total of 220 households took part in the study. Enumerators collected quantitative and qualitative data on different characteristics of the household. Aspects investigated include; average household size, average age of the household head, gender, education, ethnic group and household income. All these factors are thought to contribute to the food security of households. In addition, a dependency ratio was calculated to serve as an indication to determine the extent to which the household members are dependent on the other working members providing an income for the rest of the household.
For the purpose of this study, two types of dependency ratios were calculated:
The number of active persons (people between 18 and 65 years old) was divided by the total household size. This provides an interdependency ratio that depicts the ability for a household to earn an income to support the rest of the household members.
The activity rate is calculated upon members contributing to the household income over the total household members.
3. RESULTS
3.1 Average Household Size
The average household for the 220 samples taken in the Cape Town Metropole, in the Western Cape, consists of 4.32 members per household, with a standard deviation of 2.1. The average household size reported by D'Hease, Vasile & Ramo (2013), in the Ekurhuleni district of the Gauteng province had an average of 5.66 members, while Frayne, Battersby-Lennard, Fincham & Hayson (2009), reported the average household size for Cape Town to be 3.9 and for Johannesburg to be 3.8. On average, a household in Limpopo was composed of 6.5 household members (De Cock, D'Haese, Vink, van Rooyen, Staelens, Schőnfeldt & D'Hease, 2013). The biggest household in this study consisted of 12 members, while 17 households only consist of a single member. When comparing urban farmers with households not involved in farming, the average households consisted of 4.17 and 4.56 respectively. There was no significant difference between urban farmers with households not involved in farming. The average number of household members in households not involved in farming, household farmers and community farmers are 4.61, 4.06 and 4.35 respectively. Female headed households had a higher average household size (4.4) than male headed households (4.21). There were however significant differences (P < 0.05) in household size between the informal settlement areas. Khayelitsha had the highest average household size with 5.29 members per household, while Philippi and Gugulethu had the lowest average household size of 3.39 and 3.64 respectively.
3.2 Average Age of Household Head
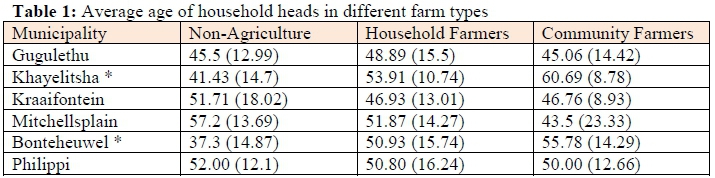
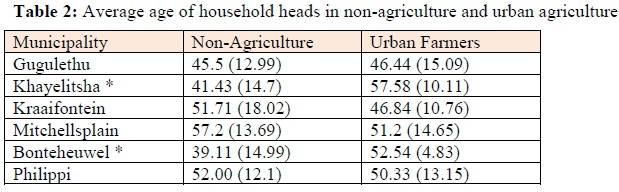
The average age of household heads was 50. This corresponds with a study done in Gauteng (D'Hease et al., 2013), where the average age of the household head was 47 years old, but was lower than household heads in Limpopo (De Cock et al., 2013). Battersby (2011a) reported the average age of the household head to be 52 and 46 years for Philippi and Khayelitsha respectively. The non-farmer group had an average age of 48, while people involved in urban farming were on average 51 years of age at the time of the survey. Household farmers and community farmers had the same average age.
Gugulethu had the lowest average age (46), while Mitchellsplain had the highest (53 years). There was no significant difference between the average age of household heads between the informal settlement areas.
In Table 1 it can be seen that there are significant differences (P < 0.05) between the different types of agriculture and non-agriculture in two areas namely Khayelitsha and Bonteheuwel. The same effect can be seen in Table 2, with significant differences (P < 0.05) between in the non-agriculture and urban agriculture groups in the same two areas.
3.3 Gender
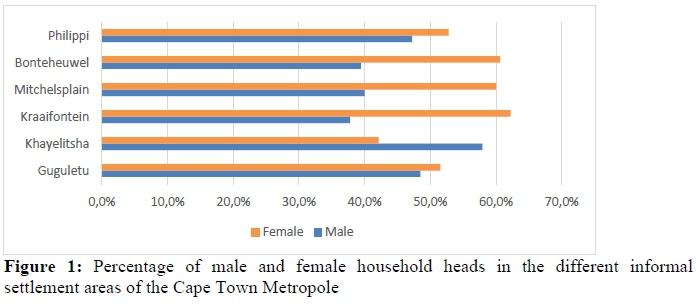
The households surveyed consisted of 99 male headed and 121 female headed households. This is consistent with reports by Frayne, McCordic & Shilomboleni (2014). Furthermore, there were more female heads than males in households not involved in agriculture and household farmers, while community farmers had 37 males and 34 females involved.
The average age of female headed households in the Cape Town Metropole was 51 years and for males an average of 49 years old. In Bonteheuwel, Mitchellsplain and Kraaifontein, more than 60% of households were female headed. Philippi and Gugulethu have about 3% more female than male head households. Khayelitsha is the only household with more male than female headed households. This can be seen in Figure 1.
There was no significant difference (P < 0.05) between the levels of education between male and female headed households. This was also the case for the ration between the number of active adults towards household size, with an average of 0.76 for male and 0.73 for female headed households and the active number of adults, with an average of 3.07 and 3.04 for male and female headed households respectively. There was however a big significant difference (P < 0.05) between the average ratio for number of people working compared to household size. In this instance male headed households had 46% working household members, while female headed households only had 33% working members compared to household size.
3.4 Education Level of Household Heads
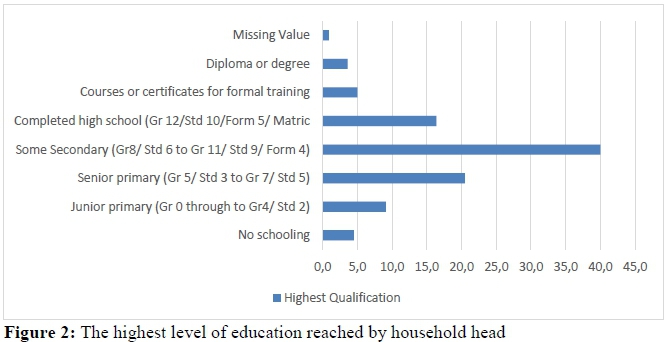
There is no difference between the average level of education of household heads. Generally, most (40.1%) household heads obtained some secondary level of education ranging from Grade 8 to Grade 11. Primary school (grade 5 to grade 7) was completed by 20.3%, while 9% obtained Junior primary which ranges from grade 0 to grade 4, and 4.5% had no schooling.
Figure 2 shows that 16.2% completed school (matric), 5.4% did some courses or certificates for formal training and 3.6% attained a diploma or degree. A study done in Langa showed 63% of household heads involved in urban agriculture received some secondary education and similarly 7% completed school, 5% completed college and another 2% completed university (Philander, 2015). In Limpopo, it was reported that 8.3% of household heads completed school.
When looking at the highest level of education by a household head in the different informal settlement areas of the Cape Town Metropole, Kraaifontein household heads reached an average of senior primary level or grade 7, while all the other areas had an average education level up to some secondary level or grade 11. There was also no difference between qualification level between males and females.
3.5 Ethnic Group
Most of the households surveyed belonged to the African ethnical group (83.3%). Coloured (83.3%), Indian (15.3%) and White (0.5%) made up the rest of the households. All the informal settlement areas, except Bonteheuwel had predominantly African households. Philippi and Kraaifontein had 100% African households, while Gugulethu, Khayelitsha and Mitchellsplain had 93.94%, 97.37% and 88.57% African households respectively. The surveys included two Coloured households in Gugulethu, one Indian household in Khayelitsha and four Coloured households in Mitchellsplain. Bonteheuwel were predominantly Coloured households (80%), followed by African (14.29%), Indian (2.86%) and White (2.86%) households.
3.6 Household Income
3.6.1 Total household income
Income information was shared by 94.5% of the respondents. It is assumed that this information is considered confidential, therefore was not supplied by all participants. The mean average total household income of the 209 respondents sharing income information was R3543.22. This is higher than the average household income reported for the Limpopo area (R2953/month), although this amount might be higher since the study was done in 2013 (De Cock et al., 2013). The minimum amount of total household income per month reported was R200, while the maximum was R35000. Households within the Cape Town metropole that have a total income of R1001 to R1500 made up 20%, 14.4% had a total income of R1501-R2000, 17.2% had a total income of R2001 - R3000 and 17.2% had a total income of R3001 to R4000. Thus 68.9% of all households had a total income of R1001 to R5000 per month.
The average total income per year for households involved in urban agriculture was R41 837.60 while, those not involved in urban agriculture was R44 280.00. There was no significant difference between the two groups. There was also no significant difference between the average total household income for households not involved in agriculture (R44 280.00), household farmers (R48 400.50) and community farmers (R34 337.14). It is interesting to notice that household farmers have the highest income, while community farmers have the lowest income of the three groups.
As seen in Table 3, Gugulethu has the highest average annual income of R69 506.25. A maximum income of R420 000.00 was reported by one household in Gugulethu. Kraaifontein and Bonteheuwel had the lowest annual household income of R27 368.41 and R22 173.33 respectively. There are significant differences (P < 0.05) between the informal settlement areas of the Cape Town Metropole in terms of household income.

When looking at the average annual income for the different farm types per municipality one can see that there are significant differences (P < 0.05) between the different farm types for Khayelitsha, Bonteheuwel and Philippi. Household farmers in Gugulethu, Khayelitsha, Kraaifontein and Philippi have a larger average annual income, while non-farming households in Mitchellsplain and community farmers in Bonteheuwel have the larger average annual income.
3.6.2 Source of income
According to Philander (2015), the growth of urban agriculture could provide more job opportunities. He stated that urban agriculture may provide an income less than R1000, which remains a low source of income, but at least serves as a source of income. The households indicated that their principal source of income throughout the year came from formal salaries or wages (46.4%), while 24.8% reported that child support grants and pension funds were also their main source of income. Battersby (2011b) also reported that the main source of income in the informal settlement areas is by means of wages. The study in Langa, also in the Cape Town Metropole showed that 49% of the respondents receive income from social grants, while 30% receive income from part-time work and only 16% from full-time work (Philander, 2015). Other forms of social grant (8.6%), and food or crop production (7.7%) also contributed to household income.
No second income was reported by 4.5% of the households. Those that did have a second income obtained it from child support or grant (16.8%), formal salary or wages (14.1%) and to a lesser extent farming activity combined contribute to 10% of the secondary income source. The Household Survey indicates that 36.5% of the households in the Western Cape received social grants (Statistics South Africa, 2015). Altman, Hart & Jacobs (2010), and Frayne et al., (2009) reported that social grants are the most important contributor to reducing hunger, poverty and food insecurity in poor households. A further 88 households (40%) reported no third income stream, while some sources of a third income stream include child support or grant (5.9%).
Chitiga-Mabugu, Nhemachena, Karuaihe, Motala, Tsoanamatsie & Mashile (2013), reported that at national level the main source of income reported by households include salaries (63%) and grants (45%). At the provincial level, the largest percentage of households that reported salaries as main source of income was from Western Cape (74%) and Gauteng (73%). Limpopo (59%) and Eastern Cape (57%) reported the highest percentages of grant income. These two also have the highest poverty levels in the country.
It was reported that more than half the time (50.5%), it was the household head that generated the income. The spouse and household head contributed 8.2% to the household income. The head of the household makes decisions regarding resource usage 58.6% of the time. The spouse of the head of the household makes decisions 14.5% of the time, while together the household head and spouse of the household head make decisions 11.8% of the time.
The most important source of income for all the farming types was a formal salary or wages. 48% of households not involved in agriculture had a formal salary or wages as first income source. This was also the case with household farmers (44.4%) and community farmers (49.3%). Child support grant are the first source of income for 21.9% of non-farming households, 9.9% of household farmers and 9.6% of community farmers, while pension and other social grants are also mentioned to be first income sources for all groups. It is noteworthy that Government grants which include pension, child support grants and other social grants together with food assistance or gifts, and other assistance contributed to 51% of non-farming households, 38.3% of household farmers and 26% of community farmers. Agriculture related activities are the first source of income for 8.6% of household farmers and 16.4% of community farmers. With regards to the second source of income, child support and grants and formal salary and wages are most prominent, while 46.3% of non-farming households, 61.4% of household farmers and 38.2% of community farmers mentioned that they do not have a second source of income. Agriculture related activities are the second source of income for 6% of non-farming households, 10% of household farmers and 13.2% of community farmers. It is thus interesting to note that a much higher percentage of community farmers had agriculture related activities as first and second source of income.
The Pearson Chi-Square test showed significant differences (P < 0.05) between different informal settlement areas for sources of income. Within all areas formal wages and salaries were the main source of income. In Gugulethu 66.7% of income come from formal wages and salaries. This was also the case for 52.6% of the households in Khayelitsha, 42.2% in Kraaifontein, 28.6% in Mitchellsplain, 36.4% in Bonteheuwel and 52.8% in Philippi. In Mitchellsplain and Bonteheuwel the second highest frequency of main income came from pension with 25.7% and 24.2 % respectively. In Kraaifontein 15.6% of households reported that child support grants were the main source of income, while 13.3% reported other social grants were their main source of income. 25% of households in Philippi reported that child support grants were the main source of income. In both Gugulethu and Khayelitsha, 12.9% and 15.8% of households respectively reported income from crop production to be the main source of income.
3.6.3 Farm income
Households from Gugulethu (12.1%), Khayelitsha (18.4%) and Kraaifontein (13.3%) reported farm income to be the main source of income. In Mitchellsplain and Philippi only 2.9% and 2.8% of households respectively reported that farm income is the main source of income, while no household in Bonteheuwel reported farm income to be the main source of income. The Pearson Chi-Square test showed significant differences (P < 0.05) between different informal settlement areas of the Cape Town Metropole for farm income as main source of income.
The total average income from farming activities for household farmers were R13886.67 and for community farmers a significantly lower amount of R3007.31. The reason for this difference might be that community farmers only earn a salary for the work they had done and the produce they received, while household farmers own everything they produce.
3.7 Dependency Ratio
3.7.1 Number of active persons (people between 18 and 65 years) divided by total household size
The highest average dependency ratio was experienced in Kraaifontein (0.7593) and the lowest in Khayelitsha (0.7028). There was no significant difference between the areas (P < 0.05). This was lower than a study done by De Cock et al., (2012) in Limpopo. It is interesting to note that all the informal settlement areas of the Cape Town Metropole had a dependency ratio higher than 0.5 which indicates that the number of the active people in every household is larger than the non-active members (including members below the age of 18 and above the age of 65). The areas with higher dependency ratios will most probably have a greater advantage if new working opportunities emerge.
When looking at the number of active adults in a household, the non-farmer group vs urban farmer group reported 3.33 and 2.92 active adults in the households respectively. There was also no significant difference between the two groups. There was however a significant difference (P < 0.05) between the areas, where Philippi reported the least number of active adults (2.44), Khayelitsha the highest, with 3.66 active adults.
3.7.2 Number of persons with income per total household size
The number of persons receiving an income per household size was 0.358, 0.433 and 0.364 for non-farmers, household farmers and community farmers respectively. These rates were not significantly different. However, differences regarding the number of persons receiving an income per household size can be seen between informal settlement areas. The value for Gugulethu was 0.512, which is above the threshold of 0.5, indicating that there are less people working for an income than members of the household that do not earn an income. For Khayelitsha, Philippi, Mitchellsplain and Kraaifontein this ratio was calculated to be 0.422, 0.407, 0.369 and 0.344 respectively. Values below 0.3 indicate that there is a high responsibility on the household members that receive an income as they have to support a high number of other family members. Only Bonteheuwel had a value below 0.3 (0.294).
4. Conclusion and recommendations
From the data, it is clear that these communities are very poor and depend on alternative sources of income. Through the data provided decision makers can measure trends and progress towards meeting goals. Further studies, as also suggested by Van Niekerk et al. (2015), are necessary to understand the need for economically viable approaches to improve household income. Secondly, this study would assist funders of urban agriculture projects to determine the sustainability and viability of the projects. These will likely lead to more sustainable urban agriculture practises in order to contribute to food security and household income.
References
ALTMAN, M., HART, T. B. G., & JACOBS, P. T. 2010. Household food security status in South Africa. Agrekon, 48(4): 345-361. [ Links ]
BATTERSBY, J. 2011a. Urban food insecurity in Cape Town, an alternative approach to food access. Development Southern Africa, 28(4): 545-61. [ Links ]
BATTERSBY, J. 2011b. The state of urban food insecurity in Cape Town. Urban Food Security Series, 11: 1-42. [ Links ]
CHITIGA-MABUGU, M., NHEMACHENA, C., KARUAIHE, S., MOTALA, S., TSOANAMATSIE, N. & MASHILE, L. 2013. Food security study report, NDA Research and Policy Unit in collaboration with the Human Sciences Research Council Economic Performance and Development. [ Links ]
CITY OF CAPE TOWN. 2012. 2012 Trends and Change - 10 years: Census 2001 - Census 2011. Retrieved from http://resource.capetown.gov.za/documentcentre/Documents/Maps%20and%20statistics/ 2011_Census_Cape_Town_Profile_Change_from_2001-2011.pdf on 5 January 2017. [ Links ]
DE COCK, N. 2012. A comparative overview of commonly used food security indicators, case study in the Limpopo Province, South Africa. Faculty of Bioscience Engineering. 2012, Masters Thesis. [ Links ]
DE COCK, N., D'HAESE, M., VINK, N., VAN ROOYEN, C. J., STAELENS, L., SCHÖNFELDT, H. C. & D'HAESE, L. 2013. Food security in rural areas of Limpopo province, South Africa. Food Security, 5(2): 269-282. [ Links ]
DEPARTMENT OF ENVIRONMENTAL AFFAIRS, SOUTH AFRICA. 2016. "Sustainable Development Goals (SDG'S) of equal value," Minister Molewa tells AMCEN. Retrieved from https://www.environment.gov.za/mediarelease/molewa_sdgs_amcen on 16 February 2017. [ Links ]
D'HAESE, L., VASILE, M. & ROMO, L. 2013. Research Project "Rajah Grow Together" Food Security in Ekurhuleni, Gauteng Province, South Africa, 1-123. [ Links ]
FRAYNE, B., BATTERSBY-LENNARD, J., FINCHAM, R. & HAYSOM, G. 2009. Urban food security in South Africa : Case study of Cape Town , Msunduzi and Johannesburg. Development Planning Division Working Paper, (15): 4-43. [ Links ]
FRAYNE, B., MCCORDIC, C. & SHILOMBOLENI, H. 2014. Growing out of poverty: does urban agriculture contribute to household food security in Southern African Cities? Urban Forum, 25(2): 177-189. [ Links ]
PHILANDER, F. R. 2015. An appraisal of urban agriculture as a livelihood strategy for household food security: a case study of urban food gardens in ward 51, Langa, Cape Town. Masters Thesis, University of Cape Town. [ Links ]
STATISTICS SOUTH AFRICA. 2015. General household survey. Retrieved from http://www.statssa.gov.za/publications/Report-03-10-11/Report-03-10-11.pdf on 4 November 2016. [ Links ]
STEWART, R., KORTH, M., LANGER, L., RAFFERTY, S., DA SILVA, N. & VAN ROOYEN, C. 2013. What are the impacts of urban agriculture programs on food security in low and middle-income countries? Environmental Evidence, 2(1): 7. [ Links ]
UNITED NATIONS. 2015. The Millennium Development Goals Report. United Nations, 72.Retrieved from http://www.un.org/millenniumgoals/2015_MDG_Report/pdf/MDG%202015% 20rev%20(July%201).pdf on 12 December 2016. [ Links ]
UNITED NATIONS. 2016. The Sustainable Development Goals Report. Retrieved from https://unstats.un.org/sdgs/report/2016/The%20Sustainable%20Development %20Goals%20Report%202016.pdf on 2 October 2016. [ Links ]
VAN NIEKERK, J. A., MAHLOBOGOANE, M. & TIRIVANHU, P. 2015. The transfer of intergenerational family knowledge for sustainable commercial farming in Mpumalanga province of South Africa. S. Afr. J. Agric. Ext., 43(1): 66-77. [ Links ]
VAN NIEKERK, J. A. & STROEBEL, A. 2011. Towards redesigning the agricultural extension service in South Africa: views and proposals of extensionists in the Eastern Cape. S. Afr. J. Agric. Ext., 39(2): 57-68. [ Links ]
 Correspondence:
J. W. Swanepoel
Email: SwanepoelJW@ufs.ac.za

