


Servicios Personalizados
Articulo
 Inglés (pdf)
 Articulo en XML
 Referencias del artículo
Indicadores

Links relacionados
-
 Citado por Google
 -
 Similares en Google
Compartir

 Permalink
South African Journal of Agricultural Extension
versión On-line ISSN 2413-3221
versión impresa ISSN 0301-603X
S Afr. Jnl. Agric. Ext. vol.43 no.2 Pretoria 2015
http://dx.doi.org/10.17159/2413-3221/2015/v43n2a357
Adapted SERVQUAL for evaluating the provision of information as an agricultural Extension Service in South Africa
Simpson A. P.I; Calitz A. P.II
IDr, Research Associate, Department of Computing Sciences, Faculty of Science, Nelson Mandela Metropolitan University, Tel.: 021 807 8900, Email: Tony@grainco.co.za
IIProfessor, Department of Computing Sciences, Faculty of Science, Nelson Mandela Metropolitan University, Tel.: 041 504 2639, Email: Andre.Calitz@nmmu.ac.za
ABSTRACT
The paper describes the adaptation of the Service Quality Instrument (SERVQUAL) for measuring the provision of information as an Extension Service. It explores agricultural Extension Services as a customer service and SERVQUAL as a service evaluation tool. The study aims to provide an adapted SERVQUAL instrument which includes a dimension for the measurement of the provision of information as a service. The reliability of the adapted instrument is tested by examining the results of a practical implementation thereof. The reliability of the adapted instrument is confirmed by using quantitative analysis of empirical data. Data used in the analysis was collected by means of a case study involving an agricultural organisation in the South African grain sector. This paper serves as the impetus for a discussion on the evaluation of the provision of Information as a Service, as provided by an agricultural organisation using Extension Services.
Key words: SERVQUAL, Information as a Service, Agricultural Extension Services
1. INTRODUCTION
Agricultural organisations support farmers involved in agricultural practices through Extension Services, amongst other activities. The purpose of Extension Services is to advise and educate producers about new agricultural practices, techniques and products. A key component of extension services is the provision of relevant current information to producers. The provision of information to producers by agricultural organisations can be viewed as a service and by extension, a customer service. A service is an intangible activity or benefit which an organisation provides to a consumer (Kerin, Hartley, Berkowitz & Rudelius, 2006).
Over the past decade strategic impetus has been given to the emergence of customer service in a growing number of organisations. (An, Lee & Park, 2008; Ray, 2005). A measure of service quality, SERVQUAL, was developed by Parasuraman, Zeithaml & Berry (1988) with a view to test customers' expectations and perceptions of service quality. The use of the SERVQUAL instrument has been accepted by business to evaluate the quality of service (Beukes, Prinsloo & Pelser, 2014; Jiang, Klein, Parolia & Li, 2012; Malik, 2012; Twinomurinzi, Zwane & Debusho, 2012). SERVQUAL has five dimensions by which customers evaluate service, namely: tangibles, reliability, responsiveness, assurance and empathy. For each dimension, customers' expectations of service and secondly their perceived levels of service are measured. SERVQUAL scores are calculated by subtracting scores of perception of services received from scores of service expectations.
Parasuraman, et al. (1988) noted that appropriate adaptation of the instrument may be desirable when a specific service is investigated. The purpose of this paper is to describe the adaption of the SERVQUAL instrument to measure the provision of information as a service to agricultural producers. The reliability of the adapted instrument is evaluated by using results from empirical research conducted by an agricultural organisation to measure the service rendered when information is supplied as a service via Extension Services.
The following section discusses Agricultural Extension Services as a Customer Service. The third section explains SERVQUAL as a service evaluation tool. Thereafter the adaption of the SERVQUAL instrument is explained. The discussion includes testing the reliability of the instrument with the use of a case study. The final section of the paper is the conclusion which summarises the main findings and highlights future research.
2. AGRICULTURAL EXTENSION SERVICES AS A CUSTOMER SERVICE
Agricultural Extension is defined as the set of organisational structures that facilitate tasks and support people engaged in agricultural production in order to solve problems and to obtain information, impart skills and technologies to improve their livelihoods and well-being (Birner, Davis, Nkonya, Anandajayasekeram, Ekboir, Mbabu, Spielman, Horna, Benin & Kisamba-Mugerwa, 2006). Information shared by means of extension services includes information about current market conditions, local agricultural conditions, agricultural research, agricultural best practices, new farming products and new farming techniques.
A development in Agricultural Extension is the emergence of Commercial Extension Services, which is concerned with commercial agriculture or with the modern form of traditional agriculture (Diekmann, Loibl & Batte, 2009). Agricultural supply firms, traders or consultancies have begun to employ Commercial Extension Services as part of their sales and service strategy. The goal of Commercial Extension Services is profit earning, which, in turn, is tied closely to customer satisfaction (Nagel, 1998).
Customer satisfaction, the degree of satisfaction provided by customer service, may be defined by using two perspectives, the transaction's specific perspective or cumulative perspective (Kuo, Chi-Ming Wu & Deng, 2009). The transaction-specific perspective regards the most recent service encounter as the measure by which a customer will rate the quality of the service received, whereas cumulative perspective takes into account the accumulation of the combined experiences perceived by the customer.
The focus of this paper is to develop and test the reliability of an instrument for the measurement of producers' expectations and perception of information provided as a service. This paper focuses on the services agricultural organisations perform in order to provide relevant and current information to producers through Agricultural Extension. Feng, Duan, Mathews & Fu (2007) identified knowledge transfer, which is arguably akin to the provision of information, as a primary function of extension services. Feng, et al. (2007) developed a conceptual model for identifying the causal factors affecting the success of ICT-based knowledge transfer through extension services, depicted in Figure 1.
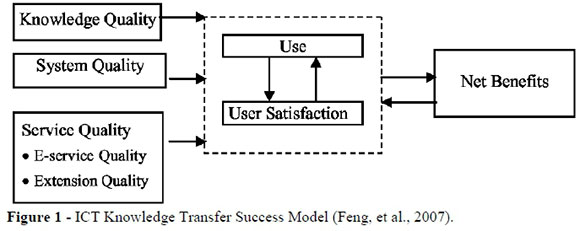
It is evident from Figure 1 that the quality of knowledge, systems and service has a direct influence on use and user satisfaction. Feng, et al. (2007) noted that their model is a preliminary model and as such requires validating. This paper will contribute to validating the model by adapting the Parasuraman, Zeithaml & Berry (1985) SERVQUAL instrument for measuring user expectations and perception of services relative to the provision of information as a service.
3. SERVQUAL AS A SERVICE EVALUATION TOOL
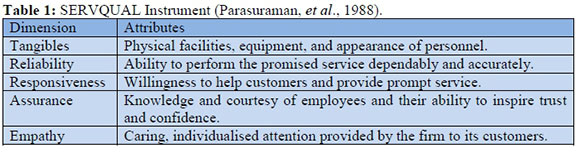
Parasuraman, et al. (1988) defined five dimensions by which customers evaluate service expectations, namely: tangibles, reliability, responsiveness, assurance and empathy. The five dimensions are included in the SERVQUAL instrument of Parasuraman, et al. (1988) which is intended to measure expectations of a service and secondly the perceived levels of service actually provided. In the instrument, each dimension is measured by four or five items, 22 in total. The dimensions and their definitions are presented in Table 1.
Each item is recast into two statements, the first to measure expectations of service from organisations in general within the service category under investigation. The second is to measure perceptions about the particular organisation whose service quality is being assessed. A seven point Likert scale ranging from "Strongly Disagree" (1) to "Strongly Agree" (7), with no verbal labels for scale points 2 to 6, accompanies each statement. SERVQUAL groups the expectation statements together in the first half of the instrument, the corresponding perception statements are included in the second half.
Scholars differ in their support for the SERVQUAL instrument (Bick, Abratt & Möller 2010), particularly in its applicability across diverse industries. To test its applicability across various industries Ladhari (2008) compared thirty studies of service quality based on SERVQUAL and found considerable empirical support for the use thereof. Scholars who question the conceptual framework and measurement of SERVQUAL are, for example, Cronin & Taylor (1992) and Teas (1993).
Parasuraman, Zeithaml & Berry (1994) respond to the criticism of their model and question if the weight of conceptual and empirical evidence presented against their model is sufficient to discount it in its entirety. The SERVQUAL model is confirmed in its usefulness by recognising an excess of 14 000 citations of the work by Parasuraman, et al. This paper therefore accepts the validity of the argument presented by Parasuraman, et al. (1985, 1988, 1994) and the evaluation of service which is based on expectations relative to perceptions.
The original SERVQUAL instrument does not have a dimension for testing the provision of information as a specific service element. Literary searches could not find an adapted and verified version of SERVQUAL for this purpose, particularly in the agricultural sector. Parasuraman, et al. (1988) noted that their SERVQUAL model might need modification to adapt to the specific requirements of individual industries. The following section of this paper describes the adaption and validation of SERVQUAL to include a dimension for the testing the provision of information as a service.
4. ADAPTED SERVQUAL
The SERVQUAL instrument was adapted with the objective of evaluating the provision of information as a service by an agricultural organisation in South Africa. The adapted SERVQUAL instrument was tested by the agricultural organisation which provides information to its producers as a service. The reliability of the adapted instrument was tested by examining the item scores recorded in the test.
The original SERVQUAL instrument was adapted by substituting the "Tangibles" section with an "Information" section and rewording the items appropriately. References to "organisations" were changed to refer specifically to "agricultural organisations" and references to "customers" were changed to "producers or customers". The adjusted SERVQUAL instrument is displayed in Table 2.

The next section describes the evaluation procedure including a discussion on the data collection method. Thereafter the reliability of the research is presented with a view to validating the adapted instrument.
4.1 Evaluation Procedure
Prior to the survey, the objectives of the evaluation were communicated to the participants and the evaluation procedure was explained. The evaluation consisted of three phases:
• Introduction and explanation of evaluation;
• Completion of SERVQUAL online questionnaire, alternatively completion of the paper-based questionnaire; and
• Encoding and analysis of the results of the evaluation.
A total of 150 producers were personally requested to participate in the survey during producer information sessions arraigned by the organisation. The SERVQUAL evaluation consisted of 40 questions divided into two sections, service expectations and service perceptions, all of which were answered by selecting from a seven point Likert Scale. Options were recorded from 1 to 7 with the words "Strongly Disagree" to the left of value 1 and "Strongly Agree" to the right of value 7.
A total of 86 South African grain producers completed the questionnaire, a 57% response rate. After the survey closed, the results were loaded into Microsoft Excel in order to perform statistical tests on the data. The reliability of the test was first tested by measuring the Cronbach's alphas (α), which is the coefficient of internal consistency for each dimension. Cronbach alpha values above .70 would indicate a good internal reliability (Pallant cited in Beukes, et al., 2014; Nunally, 1978).
Apart from the Cronbach's alpha, the mean (x), the variance and standard deviation (σ) for each dimension were calculated. The standard deviation measures the amount of variation from the mean. A low standard deviation would indicate that the individual scores would tend to be very close to the mean of the sample - indicating consistency in answers. SERVQUAL scores were calculated for each dimension. Histograms of the SERVQUAL scores were examined to determine the normality of the sample distributions.
4.2 Reliability of Instrument
Reliability is the degree to which an assessment tool produces stable and consistent results. Ritter (2010) points out that a common misconception is that reliability is a characteristic of a test. Ritter explains that reliability is a characteristic of the scores themselves. Reliability as a characteristic was first introduced by Spearman (1904) who used a method which measured each individual item multiple times. Reliability thus pertains to the consistency of scores. Spearman's (1904) method intended to determine reliability based on the consistency of the individual's scores across equivalent items. Consistency across item scores would indicate that the scores were reliable. Conversely, lack of consistency across item scores indicates that the scores were not reliable.
A measure of a sample's reliability is Cronbach's alpha (α) which is a coefficient of internal consistence. It was first named alpha by Lee Cronbach in 1951 (Bajpai & Bajpai, 2014). Cronbach's alpha is one of the most commonly used reliability coefficients (Hogan, Benjamin & Brezinksi, 2000). Cronbach's alpha takes into consideration the correlation between item scores. Alpha is the square of the correlation between true score variance and total score variance (Ritter, 2010). Perfectly correlated item scores would have a rounded value of 1, while perfectly uncorrelated items will have a score of 0.
Cronbach's alpha coefficients greater than .70, the recommended minimum value for reliability recommended by Nunally (1978), were observed for most dimensions with the exception of expectations on information (.66) and responsiveness (.63). However, in the early stages of basic research, coefficients between .50 and .69 are sufficient evidence of adequate reliability (Collis & Hussey, 2009; Nunnally, 1978; Maree, Creswell, Ebersohn, Eloff, Ferreira, Ivankova, Jansen, Nieuwenhuis, Pietersen, Clark & Van Der Westhuizen, 2012). The observed Cronbach's alpha coefficients in the evaluation were all in this interval or better (Table 3), thus confirming the reliability of the adapted SERVQUAL instrument and indicating an acceptable internal reliability. These results suggest that the added information dimension could be viewed as a valid measure of provision of information as a service.
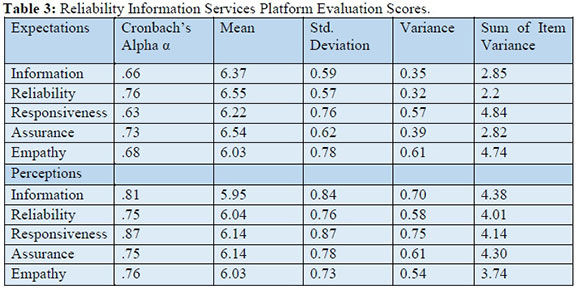
The results of the standard deviation were between 0.57 and 0.87 with a variance of between 0.32 and 0.70 across the five service quality dimensions for both expectations and perceptions (Table 3). These statistics indicates a small variation between the respondents' answers implying that their opinions correspond on most of the items within the five service quality dimensions for both the expectations and perceptions sections.
The mean (μ) scores returned a range of between 5.95 and 6.55 out of a maximum score of 7 across the dimensions (Table 3). The high scores returned are an indication of the importance producers place on service from agricultural organisations across all the dimensions measured. The high expectations of service of producers underscore the importance of Extension Services programmes of agricultural organisations.
The information expectations dimension had a mean score (μ) of 6.37 with a standard deviation (σ) of 0.59, which is an indication of information's relative importance to producers (Table 3). The information perceptions dimension had a mean score (μ) of 5.95 with a standard deviation (σ) of 0.70, which is an indication that producers think that the organisation could do more when it comes to providing information.
4.3 Information Services SERVQUAL Results
Each item in the SERVQUAL instrument constituted a variable for which a value was assigned by using a Likert scale between 1 (Strongly Disagree) and 7 (Strongly Agree). The items were divided into two sections, service expectations and service perceptions. Each section consisted of five dimensions: information, reliability, responsiveness, assurance, and empathy. Each of the dimensions contained four items. By averaging the values assigned to each of the items in the dimensions, a mean score was obtained for each dimension. The SERVQUAL scores for each participant were calculated by subtracting the mean scores for each expectation dimension from its corresponding perception dimension.
The SERVQUAL scores were in the range between negative 3 and positive 2.75 with one outlier at negative 4, which was ignored. A frequency distribution of scores was created by counting the number of scores in intervals of 0.5 starting at -3 and ending at 3. The frequency distributions or the scores are shown in Table 4.
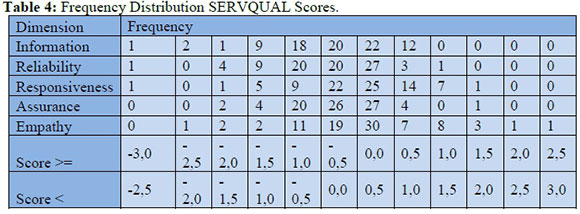
The frequency distribution of each dimension: information, reliability, responsiveness, assurance and empathy is graphically displayed in Figure 2. Examining the histograms shows that the SERVQUAL scores of the responsiveness dimension are normally distributed while the remaining dimensions are skewed to the left.
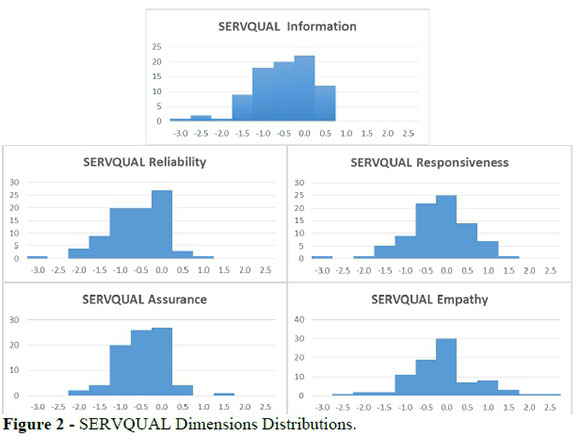
The left skew is a result of the consistently high scores associated with expectations of service which leaves very little room for organisations to exceed the expectations in relation to perceptions. The significance of this is that expectations of service are very high among the producer community and agricultural organisations will need to be innovative and provide the unexpected in order to exceed expectations.
5. CONCLUSION
This purpose of this paper was to describe and validate the adaption of the SERVQUAL instrument to measure the provision of information to producers. The relevance of the provision of information as a service by means of Agricultural Extension was motivated. SERVQUAL was identified as a relevant, service-evaluation instrument, however it was noted that the standard SERVQUAL instrument did not cater specifically for the measurement of the provision of information as a service.
To address the shortcoming of SERVQUAL to measure the provision of information as a service, an adapted SERVQUAL instrument was developed and presented. Consequently the adapted instrument was used in a case study by an agricultural organisation to test the expected and perceived level of service it was providing for its producers.
By using the data accumulated during the evaluation, the reliability of the adapted SERVQUAL instrument was tested. The internal reliability of the adapted SERVQUAL instrument was tested by examining the Cronbach's alpha coefficients. The observed Cronbach's alpha coefficients were all found to be within acceptable levels, thus confirming the internal reliability and thus validating the adapted SERVQUAL instrument.
Examination of the SERVQUAL scores across the five dimensions showed a high frequency between -0.5 and 0.5. A SERVQUAL score of close to zero implies that the service largely matched expectations. The slight skew to the left in the normal distributions of SERVQUAL results indicated that services were falling moderately short of expectations for a number of producers. A lower percentage of respondents was of the opinion that the organisation was exceeding their service expectations.
Future research is required to confirm the results observed during this evaluation. Repeated usage and refinement of the SERVQUAL instrument, adapted in this research, would lead to an improved instrument for measuring the provision of information as a service. It is anticipated that the provision of information as a service would be a growing phenomenon in the area of Agricultural Extension. Additional research is required in the agricultural sector as well as in other segments of the economy in order to test this assumption.
REFERENCES
AN, Y., LEE, S. & PARK, Y. 2008. Development of an Integrated Product-Service Roadmap with QFD. A Case Study on Mobile Communications. International Journal of Service Industry Management, 19(5), pp. 621-638. [ Links ]
BAJPAI, R. C. & BAJPAI, S. 2014 Goodness of Measurement: Reliability and Validity. International Journal Medical Science Public Health, 3(2), pp. 112-115. [ Links ]
BEUKES, J., PRINSLOO, J. J. & PELSER, T. G. 2014. Service Quality Expectations from Alcoholic Beverage Suppliers in the North West Province. 8th International Business Conference Proceedings, Swakopmund, 19-21 August 2014, pp. 52-69. [ Links ]
BICK, G., ABRATT, R. & MÖLLER, D. 2010. Customer Service Expectations in Retail Banking in Africa. South African Journal or Business Manage, 41(2), pp. 13-27. [ Links ]
BIRNER, R., DAVIS, K., PENDER, J., NKONYA, E., ANANDAJAYASEKERAM, P., EKBOIR, J., MBABU, A., SPIELMAN, D. J., HORNA, D., BENIN, S. & KISAMBA-MUGERWA, W. 2006. From Best Practice to Best Fit: A Framework for Designing and Analyzing Agricultural Advisory Services. ISNAR Discussion Paper 5. Washington: IFPRI. [ Links ]
COLLIS, J. & HUSSEY, R., 2009. Business Research: A Practical Guide for Undergraduate & Postgraduate Students. 3rd Edition. Palgrave Macmillan. [ Links ]
CRONIN, J. J. & TAYLOR, S. A. 1992. Measuring Service Quality: A Re-examination and Extension. Journal of Marketing, 56(3), pp. 55-68. [ Links ]
DIEKMANN, F., LOIBL, C. & BATTE, M. T. 2009. The Economics of Agricultural Information: Factors Affecting Commercial Producers' Information Strategies in Ohio. Review of Agricultural Economics, 31(4), pp. 853-872. [ Links ]
FENG, W. Z., DUAN, Y. Q., MATHEWS, B. & FU, Z. T. 2007. Measuring ICT-based Agricultural Knowledge Transfer Under a Sender Advantage Asymmetric Information Structure. New Zealand Journal of Agricultural Research, 50, pp. 1307-1314. [ Links ]
HOGAN, T. P., BENJAMIN, A. & BREZINKSI, K. L. 2000. Reliability Methods: A Note on the Frequency of use of Various Types. Educational and Psychological Measurement, 60(4), pp. 523-531. [ Links ]
JIANG, J. J., KLEIN, G., PAROLIA, N. & LI, Y. 2012. An Analysis of Three SERVQUAL Variations in Measuring Information System Service Quality. The Electronic Journal Information Systems Evaluation, 15(2), pp. 149-162. [ Links ]
KERIN, R. A., HARTLEY, S. W., BERKOWITZ, E. N. & RUDELIUS, W. 2006. Marketing. New York: McGraw-Hill/Irwin. [ Links ]
KUO, Y., CHI-MING WU, C. & DENG, W. 2009. The Relationships Among Service Quality, Perceived Value, Customer Satisfaction, and Post-purchase Intention in Mobile Value-added Services, Computers in Human Behaviour, 25(4), pp. 887-896. [ Links ]
LADHARI, R. 2008. Alternative Measures of Service Quality: A Review. Managing Service Quality, 18(1), pp. 65-86. [ Links ]
MALIK, S. U. 2012. Customer Satisfaction, Perceived Service Quality and Mediating Role of Perceived Value. International Journal of Marketing Studies, 4(1), pp. 68-76. [ Links ]
MAREE, K., CRESWELL, J. W., EBERSOHN, L., ELOFF, I., FERREIRA, R., IVANKOVA, N. V., JANSEN, J. D., NIEUWENHUIS, J., PIETERSEN, J., CLARK, V. L. & VAN DER WESTHUIZEN, C. 2012. First Steps in Research. 1st Edition. Pretoria: Van Schaik. [ Links ]
NAGEL, U. J. 1998. Improving Agricultural Extension. A Reference Manual. Rome: FAO. [ Links ]
NUNALLY, J. 1978. Psychometric Theory (2nd ed.). New York: McGraw-Hill. [ Links ]
PARASURAMAN, A., ZEITHAML, V. A. & BERRY, L. L. 1985. A Conceptual Model of Service Quality and Its Implications for Future Research. Journal of Marketing, 49(4), pp. 41-50. [ Links ]
PARASURAMAN, A., ZEITHAML, V. A. & BERRY, L. L. 1988. SERVQUAL: A Multiple-Item Scale for Measuring Consumer Perceptions of Service Quality. Journal of Retailing, 64(1), pp. 12-40. [ Links ]
PARASURAMAN, A., ZEITHAML, V. A. & BERRY, L. L. 1994. Reassessment of Expectations as a Comparison Standard in Measuring Service Quality: Implications for Further Research. Journal of Marketing, 58(1), pp. 111-124. [ Links ]
RAY, G. 2005. Information Technology and the Performance of the Customer Service Process: A Resource Based Analysis. MIS Quarterly, 29(4), pp. 625-652. [ Links ]
RITTER, N. L. 2010. Understanding a Widely Misunderstood Statistic: Cronbach's α. Annual meeting of the Southwest Educational Research Association, New Orleans, 18 February 2010, pp. 1-17. [ Links ]
SPEARMAN, C. E. 1904. The proof and measurement of association between two things. American Journal of Psychology, 15(1), pp. 72-101. [ Links ]
TEAS, R. K. 1993, Expectations, Performance Evaluation and Consumers' Perceptions of Quality. Journal of Marketing, 57, pp. 18-34. [ Links ]
TWPNOMURFNZI, H., ZWANE, M. G. & DEBUSHO, L. K. 2012. SERVQUAL as a Social-Technical Approach to Measuring e-Government Service Quality and Guiding e-Governance Strategies. The African Journal of Information and Communication, 12, pp. 84-108. [ Links ]
 Correspondence:
A. P. Simpson
Email: Tony@grainco.co.za

