


Serviços Personalizados
Artigo
 Inglês (pdf)
 Artigo em XML
 Referências do artigo
Indicadores

Links relacionados
-
 Citado por Google
 -
 Similares em Google
Compartilhar

 Permalink
SAMJ: South African Medical Journal
versão On-line ISSN 2078-5135
versão impressa ISSN 0256-9574
SAMJ, S. Afr. med. j. vol.114 no.4 Pretoria Abr. 2024
http://dx.doi.org/10.7196/SAMJ.2024.v114i4.1393
RESEARCH
How far? Travel burdens for children admitted to hospitals in the Western Cape Province of South Africa
M RichardsI; D le RouxII; D PienaarIII
IMB ChB FCPaed; Department of Paediatrics and Child Health, Faculty of Health Sciences, University of Cape Town, South Africa
IIMB ChB, PhD; Department of Paediatrics and Child Health, Faculty of Health Sciences, University of Cape Town, South Africa
IIIMB ChB, FCPHM; Western Cape Department of Health, Cape Town, South Africa
ABSTRACT
BACKGROUND: The ability to access effective hospital care for children is a significant determinant of good health outcomes. The Western Cape Province is a large land area with a wide array of human settlements, both in urban and rural spaces. For many children in the Western Cape, after-hours access to healthcare becomes constrained when primary care clinics close and hospitals are either far away or difficult to get to. The cumulative travel burden of communities across this area is not known. The recently established data-gathering capacity of the Provincial Health Data Centre of the Western Cape represents a new capacity to study this
OBJECTIVES: To describe the cumulative travel burdens of children in communities throughout the Western Cape Province, and how they compare relative to one another, with a particular focus on the after-hours period in a week
METHODS: Over a period of 5 years from 2017 to 2021, all the admission details to every hospital in the Western Cape Province of children <18 years of age were collected, with basic demographic and disease data, including place of residence. The distance each child travelled to their first admission facility was calculated and represented within defined communities across the metro of Cape Town and the rural Western Cape
RESULTS: There were 574 220 admissions over the 5-year period, of which 360 783 were able to be used for travel analysis. The majority of admissions were for children under 5 years of age, were in the City of Cape Town and occurred after hours. Median travel distance was less for children outside of Cape Town, but the range of travelled distances was greater. Communities across the Western Cape, particularly rural communities, reflected significant variation in their cumulative travel burdens
CONCLUSION: Using a large health dataset, this study demonstrates in a novel way for South Africa the distances children travel to access admission facilities. A wide variation exists across all parts of the province, but particularly in rural areas. These findings could be further interrogated for people's choices of facility and method of travel. Detailed service area modelling and extending primary care working hours are potential considerations for improving access at scale and at the local community level
Access to health services is a key determinant of health outcomes. Service providers and consumers mediate the many parts of access in discrete and interdependent ways.[1]Providers mediate approachability and appropriateness, and consumers the ability to recognise a need and the ability to reach a service, among other issues.[2] Reaching a service could in turn be a composite of factors such as physical distance to a health facility, real-world travel time, transport availability and the economic cost to a household of finding or owning a vehicle for a journey. [3,4] Accessible emergency care for children is of particular importance because of their susceptibility to poor outcomes if care is delayed.[5-15]
Health service access is a well-studied field containing a rich literature from many countries for varied conditions and services. '16-201 There is only a small published literature describing spatial health access in South Africa (SA).[21-23] The authors are not aware of any local research specifically describing this for children.
Equity in health service provision is dependent on understanding population characteristics and spatial distribution of peoples. Research in this field is dependent on accurate data and careful inferential work while working with large datasets and co-existing uncertainty about data incompleteness.[24] In the Western Cape Province of SA, the aggregation into large datasets of patient health records, demographic data and residential information has recently become available through the Provincial Health Data Centre (PHDC), creating novel capacity to interrogate large numbers of health-seeking events across the province.[25]
In this study we utilise a combination of hospital admission and residential data to demonstrate the travel burdens experienced by children and their carers in the City of Cape Town and the rest of the Western Cape. Over a period of 5 years, we demonstrate, in particular, this travel for unscheduled hospital visits and how communities and hospitals reflect these cumulative journeys relative to one another.
Methods
The PHDC of the Western Cape government collated hospital admissions of children aged <18 years to all state hospitals in the Western Cape from 2017 to 2021. Personal patient details were deidentified; details of admission included age, gender, ICD10 code(s), times and dates of admissions and discharges, and survival. Ethical clearance for the study was granted by the Faculty of Health Sciences of the University of Cape Town (ref. no. HREC REF 178/2022).
Home addresses were assigned to a Statistics SA (Stats SA) Census Enumeration Area entitled a 'main place' (essentially equating to a large suburb or small town). Replacing street-level addresses with suburbs was required by an institutional ethics requirement, and a predicted best effort for geolocating home addresses (many patients were assumed to be residing in informal homes without official addresses). All suburbs in the Western Cape that had 20 or more admissions over 5 years were included, and a representative co-ordinate was defined for each suburb. When available, co-ordinates for suburbs were referenced from Stats SA datasets.[26] In cases where these were not available, such as in new suburbs or informal settlements, centroid co-ordinate assignments were made using schools, churches, or other community structures.
For each suburb, the four most frequently accessed hospitals were utilised for point-to-point distance calculations. The rationale for this was the increasing likelihood of incorrect residential addresses in view of apparently irrational or unlikely first hospital choices. Only the facility providing the first admission was used as a destination, excluding all subsequent referral facilities used in multifacility admissions.
Travel times and distances between suburbs and facilities were estimated using ArcGIS Pro 2.9 network analysis (ESRI, USA). Travel times and distances between suburbs and facilities were estimated using a routing analysis in ArcGIS Pro 2.9 with the ArcGIS Online World Routing Service.[27] Technical support was provided by the GIS Lab at the University of Cape Town. Statistical analysis was performed with STATA 10 (StataCorp, USA).
Two distinct populations were defined for the Western Cape, namely those within the single metropole of the Western Cape, the City of Cape Town (CoCT) and those outside the metropolitan area ('district/rural'). Using admission times, two categories of admissions were created, being 'working hours' (08h00 - 17h00 Monday - Friday) and 'after hours' (evenings and weekends). 'After hours' admissions were analysed as indicative of emergency visits, as opposed to planned elective admissions.
Exclusions were all infants <1 week old, as most of these are admitted to neonatal facilities, repeat admissions within a space of 24 hours, hospital admissions after a transfer from another admitting hospital, admissions with missing residential data and admissions from communities with <20 admissions over 5 years.
The dataset was cleaned to remove duplicates and admissions with missing data. No folders were interrogated, nor were patients or their families contacted to verify data entries. It was not possible to derive modes of transport to admission facilities, nor to assess if a child had received ambulatory care at an emergency centre and then transferred without being admitted at the first facility.
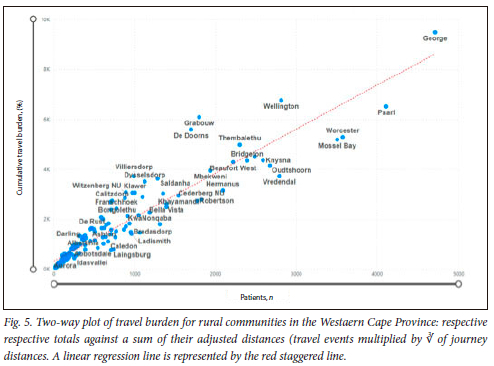
Data were analysed to demonstrate communities with travel distances that were outliers relative to average or median (interquartile range (IQR)) travel distance. 'Patient kilometres' (total patients multiplied by distances to hospital) were calculated for each community. We postulate that in rural areas, where travel over very large distances are routine, a few extra kilometres of travel do not impart the same real-world experience of travel burden that the same distance would impart in an urban area. To offset this effect, and to minimise the impact of very long journeys on the 'patient-kilometres' product in rural areas, a travel distance correction was made by using the cube root of distances to hospital. This correction was not applied within the urban CoCT, which had shorter and more uniform distribution of travel distances. Regression modelling was calculated using a least squares method.
Results
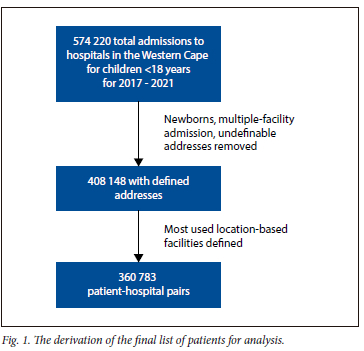
The complete dataset over the 5 years consisted of 574 220 admissions at 53 hospitals recording admissions for people <18 years old. After exclusions, utilising the most frequently accessed hospitals by a community, distance analyses were performed on 360 783 admissions (Fig. 1).
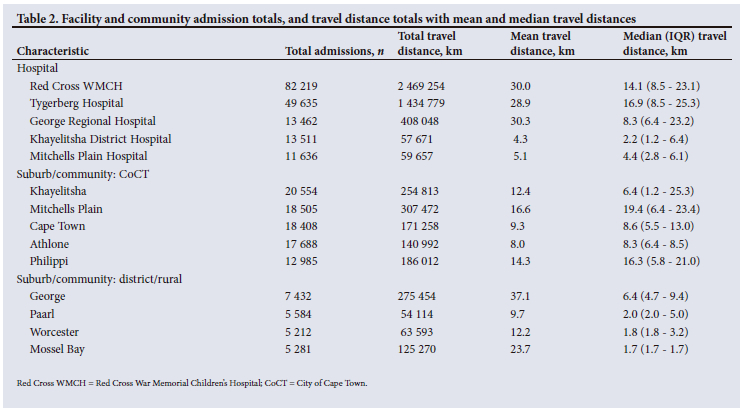
There were 213 communities included. Most admissions were in the age group 1 - 4 years. There were more admissions in the CoCT, but the total travel distance in rural areas was greater (Table 1).
The hospitals with the highest numbers of admissions were Red Cross War Memorial Children's Hospital, Tygerberg Hospital, George Regional Hospital, Mitchells Plain Hospital and Khayelitsha District Hospital. The CoCT suburbs with the highest numbers of admissions and highest total travel distances were Khayelitsha, Mitchells Plain, Cape Town and Athlone. The rural communities with the highest admissions were George, Paarl, Mossel Bay and Worcester (Table 2).
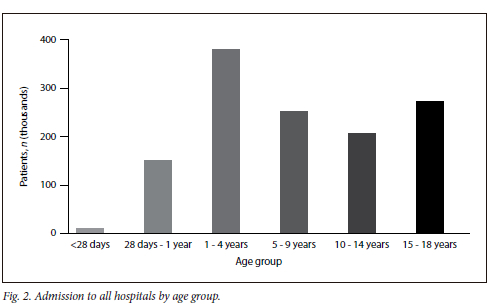
The under-5 age group represents 58% of admissions to hospital (Fig. 2). There was a small increase in hospitalisations in later teenage years, as obstetric and traumatic conditions became more prevalent. [28]
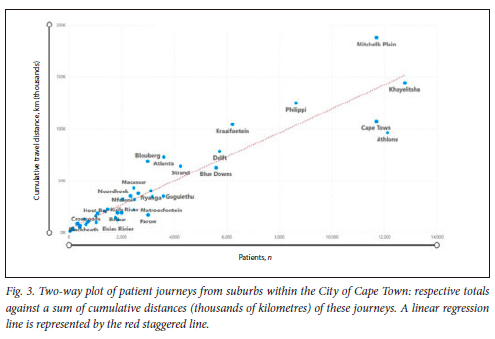
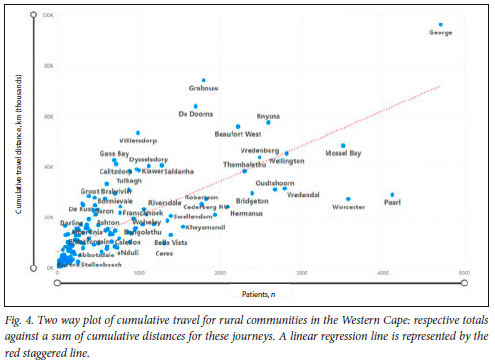
City of Cape Town and Rural cumulative travel distances are represented in Figs 3 and 4. Distances are best understood by comparing communities with similar numbers of admitted patients. Those lower down on the vertical axis will be relatively closer to their admission hospital; those higher up on the vertical axis will have travelled further to their admission hospital. In essence, the gradient of the line joining the origin of the graph to the point represented by a community describes a measure of a community's average journey distance.
An emphasis on travel events over kilometres per event is reflected in Fig. 5. For example, the towns of Worcester and Paarl now approach the regression line in view of a higher number of travelling events.
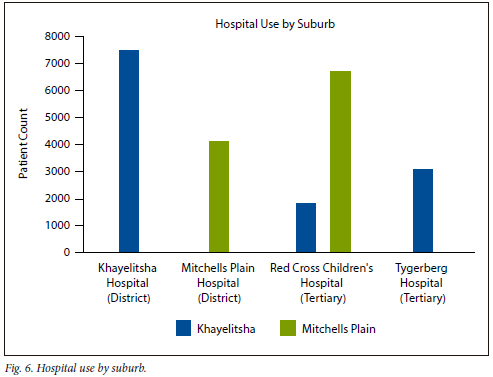
Two quite distinct hospital utilisation patterns are observed in two similarly sized urban suburbs in the CoCT, in this case Mitchells Plain and Khayelitsha, each with their own local level 1 hospital (Fig. 6). For children living in Khayelitsha, 7 481 of 12 340 hospital admissions (61%) occurred at the local district hospital, whereas for children living in Mitchells Plain, only 38% of admissions occurred at the local hospital, with a comparatively higher utilisation of the more distant tertiary facility.
Some areas contribute disproportionately to total travel for a particular facility. A rural example is that of Worcester Hospital, based in an urban setting but with a very rural large drainage area. The rural community of De Doorns, 32 km from Worcester, contributes 23% of after-hours patient numbers, but close to 60% of the total travel burden for the hospital (Fig. 7).
Discussion
This is the first SA study documenting the relative travel burdens of communities at scale. We demonstrate that there are significant differences between rural communities in their cumulative travel distances to get to emergency admission facilities. In Cape Town, community travel burdens are also unequal, with additional travel efficiency anomalies demonstrated in how different communities are admitted to their respective closest admission facility. We have demonstrated that communities of similar admission needs can have up to 3 - 4 times the cumulative distance to travel for this level of care. This is particularly evident in the rural parts of the province. As a proof of concept, it establishes the capacity of a new government health data centre, the PHDC, to produce large, aggregated datasets enabling broader analytical work.
The populations described in this study represent extremes of ability to access health facilities.[29] SA has the highest level of income inequality in the world, and the Western Cape in particular includes both remote rural areas as well as dense urban areas. There is a mix of agricultural settlements, formal suburbs and rural and urban informal settlements.[29,30] The physical location of services in SA still reflects the legacy of apartheid spatial discrimination, with large regional and central hospitals located far from densely populated lower socioeconomic areas. Additionally, urban, interprovincial and transnational migration has resulted in rapid expansion of living areas, often faster than services can be established.
The question 'How far is too far?' for hospital access has no national or provincial reference standard in SA, a country with significant poverty, wide variety in human population density and low vehicle ownership. Two international consensus examples for acceptable proximity are a 2-hour total travel time set by the World Health Organization as a threshold for emergency obstetric and surgical care; for universal health care coverage by 2030, the Lancet Commission for global surgery recommends 80% of a population residing within that time threshold.[31]
There were discrepancies in how the most proximate hospital was used, both in the CoCT and between the CoCT and rural settings. Rurality and local economics may play significant roles in the agency of local communities to exercise their choice of hospital. Reasons for differences in district v. tertiary hospital admissions for children from Mitchells Plain and Khayelitsha are complex. The two suburbs have significantly different economic indicators, with the number of formal homes in Mitchells Plain being 95% compared with 45% in Khayelitsha.[32] There may be other issues of patient preference that would need prospective evaluation. The disproportionate contribution of total travel made by children from De Doorns to admissions for Worcester Hospital can be understood when considering the distances involved. At the time of writing, De Doorns only has a weekday primary care clinic, and 90% of admissions from De Doorns are to the closest hospital, Worcester Hospital, 32 km away. De Doorns contains a large informal settlement providing seasonal agricultural labour. The economics of the area also represent a more constrained population, with only 51% of dwellings being formal[32]
We were not able to interrogate the health-seeking behaviour of carers, local hospitals' onward referral rates nor admission capacity, or why families preferred remote facilities over local hospitals for their child's care.
SA has a low private vehicle ownership rate, and this would be particularly low in the populations accessing public health facilities. [33] In SA, car ownership is significantly lower in rural compared to urban areas (14% v. 39% respectively).[33] This may further delay access to after-hours healthcare for rural areas. In urban informal settlements, emergency medical service vehicles will sometimes refuse to travel without police escorts.[34,35] Our study cannot tell the real stories of individual journeys to hospital. It may require a walk between informal homes late at night, carrying a child to a police or fire station to await an ambulance, or a delay in finding money to pay for a private vehicle.
In this study, child deaths were rare, and the sample size too small to reliably correlate with distance from hospital. Since folders were not reviewed, we were not able to interrogate the circumstances around those deaths. The effects of delay in accessing effective care for unwell children in low-income countries are well described; further investigation would be required to confirm similar findings in our context.[5-15]
In two rural communities (De Doorns and Grabouw - Fig. 4) and a Cape Town Metro informal settlement (Du Noon -represented as Blouberg - Fig. 3), significant service protests have been experienced in the last 15 years. Civil unrest relating to service deficiency is a common theme in marginalised communities in SA. These communities all plotted relatively far from the regression line in their respective graphs. In Grabouw and Du Noon, after-hours access to healthcare has become established subsequent to these events.[36,37]
There are many limitations to a study such as this. Data volumes are large, and cleaning and consolidating residential locations is error prone. Care was taken to validate address data and geocode accurately. Farming communities routinely reported postal addresses, distinct from physical addresses. Not all data captured at points of care was complete, and it was impossible to accurately define errors for some fields. Modes of travel to hospital were not captured consistently or accurately. Travel times (instead of travel distance) were explored in preliminary analyses in ArcGIS; however, this was not included in the final analysis due to variability of travel times through a day or week. An after-hours focus ameliorated this in part.
Further study is warranted, in particular, an evaluation of the discrete travelling distance from home to a health centre, regardless of admission status. And with this information, more detailed modelling with regard to the ideal location of future after-hours service creation or expansion of existing facilities would be facilitated. It is intended in a follow-up study to isolate patient health-seeking behaviour by interrogating only emergency centre attendances.
Conclusion
In conclusion, we analysed travel distances from community to place of first hospital admission for 360 000 child admissions over 5 years. We demonstrated great variability in travel distances both for suburbs in the CoCT and rural communities. Further research is required to understand facility choices and referral patterns within specific suburbs in the CoCT.
Declaration. None.
Acknowledgements. The authors would like to acknowledge the assistance of the GIS Lab at the University of Cape Town Libraries Digital Library Services (www.gis.uct.ac.za) and that of Dr Alexa Heekes and Juan-Paul Hynek from the PHDC of the Western Cape in curating the original dataset.
Author contributions. MR conceptualised the research, collected and analysed the data and drafted the manuscript; DLR was involved in data analysis and editing the manuscript; DP was involved in reviewing the analysis and editing the manuscript.
Funding. None.
Conflicts of interest. None.
References
1. Penchansky R Thomas JW. The concept of access: Definition and relationship to consumer satisfaction. Med Care 1981;19(2):127-140. https://doi.org/10.1097/00005650-198102000-00001 [ Links ]
2. Levesque J-F, Harris MF, Russell G. Patient-centred access to health care: Conceptualising access at the interface of health systems and populations. Int J Equity Health 2013;12(1):18. https://doi.org/10.1186/1475-9276-12-18 [ Links ]
3. Goudge J, Gilson L, Russell S, et al The household costs of health care in rural South Africa with free primary care and hospital exemptions for the poor. Trop Med Int Health 2009;14:458-467. https://doi.org/10.1111/j.1365-3156.2009.02256.x [ Links ]
4. Matovu F, Nanyiti A, Rutebemberwa E. Household health care-seeking costs: Experiences from a randomised, controlled trial of community-based malaria and pneumonia treatment among under-fives in eastern Uganda. Malar J 2014;13:222. https://doi.org/10.1186/1475-2875-13-222 [ Links ]
5. Debsarma D, Saha J, Ghosh S. Factors associated with delay in treatment-seeking behaviour for fever cases among caregivers of under-five children in India: Evidence from the National Family Health Survey-4, 2015 - 16. PloS ONE 2022;17(6):e0269844. https://doi.org/10.1371/journal.pone.0269844 [ Links ]
6. Hollowell T, Sewe MO, Rocklöv J, et al. Public health determinants of child malaria mortality: A surveillance study within Siaya County, Western Kenya. Malar J 2023;22(1):65. https://doi.org/10.1186/s12936-023-04502-9 [ Links ]
7. Kadobera D, Sartorius B, Masanja H, et al The effect of distance to formal health facility on childhood mortality in rural Tanzania, 2005 - 2007. Glob Health Action 2012;5:1-9. https://doi.org/10.3402/gha.v5i0.19099 [ Links ]
8. Karra M, Fink G, Canning D. Facility distance and child mortality: A multi-country study of health facility access, service utilisation, and child health outcomes. Int J Epidemiol 2016;46(3):817-826. https://doi.org/10.1093/ije/dyw062 [ Links ]
9. Khan N, Islam Trisha N, Rashid M. Availability and readiness of health care facilities and their effects on under-five mortality in Bangladesh: Analysis of linked data. J Glob Health 2022;12:04081. https://doi.org/10.7189/jogh.12.04081 [ Links ]
10. Kibret GD, Demant D, Hayen A. The effect of distance to health facility on neonatal mortality in Ethiopia. BMC Health Serv Res 2023;23(1):114. https://doi.org/10.1186/s12913-023-09070-x [ Links ]
11. Okwaraji YB, Cousens S, Berhane Y, et al Effect of geographical access to health facilities on child mortality in rural Ethiopia: A community based cross sectional study. PloS ONE 2012;7(3):e33564. https://doi.org/10.1371/journal.pone.0033564 [ Links ]
12. Ouma PO, Maina J, Thuranira PN, et al Access to emergency hospital care provided by the public sector in sub-Saharan Africa in 2015: A geocoded inventory and spatial analysis. Lancet Glob Health 2018;6(3):e342-e350. https://doi.org/10.1016/s2214-109x(17)30488-6 [ Links ]
13. Quattrochi JP, Hill K, Salomon JA, et al. The effects of changes in distance to nearest health facility on under-5 mortality and health care utilisation in rural Malawi, 1980 - 1998. BMC Health Serv Res 2020;20(1):899. https://doi.org/10.1186/s12913-020-05738-w [ Links ]
14. Schoeps A, Gabrysch S, Niamba L, et al. The effect of distance to health-care facilities on childhood mortality in rural Burkina Faso. Am J Epidemiol 2011;173:492-498. https://doi.org/10.1093/aje/kwq386 [ Links ]
15. Soni A, Khalil S, Pandey RM, et al. Risk factors predicting early in-hospital mortality among under-five children and need for decentralisation of pediatric emergency care services. Indian J Pub Health 2022;66(3):257-263. https://doi.org/10.4103/ijph.ijph_487_22 [ Links ]
16. Ahmed S, Adams AM, Islam R, et al. Impact of traffic variability on geographic accessibility to 24/7 emergency healthcare for the urban poor: A GIS study in Dhaka, Bangladesh. PloS ONE 2019;14(9):e0222488. https://doi.org/10.1371/journal.pone.0222488 [ Links ]
17. Yahya N, Sukiman NK, Suhaimi NA, et al. How many roads must a Malaysian walk down? Mapping the accessibility of radiotherapy facilities in Malaysia. PloS ONE 2019;14(3):e0213583. https://doi.org/10.1371/journal.pone.0213583 [ Links ]
18. Hierink F, Rodrigues N, Muniz M, et al. Modelling geographical accessibility to support disaster response and rehabilitation of a healthcare system: An impact analysis of Cyclones Idai and Kennethin Mozambique. BMJ Open 2020;10(11):e039138. https://doi.org/10.1136/bmjopen-2020-039138 [ Links ]
19. Weiss DJ, Nelson A, Vargas-Ruiz CA, et al Global maps of travel time to healthcare facilities. Nat Med 2020;26(12):1835-1838. https://doi.org/10.1038/s41591-020-1059-1 [ Links ]
20. Banke-Thomas A, Wong KLM, Ayomoh FI, et al. 'In cities, it's not far, but it takes long': Comparing estimated and replicated travel times to reach life-saving obstetric care in Lagos, Nigeria. BMJ Glob Health 2021;6(1):e004318. https://doi.org/10.1136/bmjgh-2020-004318 [ Links ]
21. Tsoka JM, le Sueur D. Using GIS to measure geographical accessibility to primary health care in rural South Africa: Research in action. S Afr J Sci 2004;100(7):329-330. https://doi.org/10.10520/EJC96284 [ Links ]
22. Doherty J, Rispel L, Webb N. Developing a plan for primary health care facilities in Soweto, South Africa. Applying locational criteria. Health Pol Planning 1996;11(4):394-405. https://doi.org/10.1093/heapol/11.4.394 [ Links ]
23. Kapwata T, Manda S. Geographic assessment of access to health care in patients with cardiovascular disease in South Africa. BMC Health Serv Res 2018;18(1):197. https://doi.org/10.1186/s12913-018-3006-0 [ Links ]
24. Delmelle EM, Desjardins MR, Jung P, et al Uncertainty in geospatial health: Challenges and opportunities ahead. Ann Epidemiol 2022;65:15-30. https://doi.org/10.1016/j.annepidem.2021.10.002 [ Links ]
25. Boulle A, Heekes A, Tiffin N, et al. Data centre profile: The Provincial Health Data Centre of the Western Cape Province, South Africa. Int J Popul Data Sci 2019;4(2):1143. https://doi.org/10.23889/ijpds.v4i2.1143 [ Links ]
26. Statistic South Africa. StatsSA_CensusBoundaries2011. Pretoria: StatsSA, 2011. https://www.arcgis.com/home/item.html?id=141c1076a31c4cd2af54e7d5e58af6c2. (accessed 19 March 2024). [ Links ]
27. ArcGIS Online World Routing Service 2023. https://www.arcgis.com/home/item.html?id=4df15427983145b5a19dd122e5151631. (accessed 19 March 2024). [ Links ]
28. Morden EGP, Zinyakatira N, Neethling I, et al. Western Cape Mortality Profile 2013. Cape Town: South African Medical Research Council, 2016. [ Links ]
29. McLaren ZM, Ardington C, Leibbrandt M. Distance decay and persistent health care disparities in South Africa. BMC Health Serv Res 2014;14:541. https://doi.org/10.1186/s12913-014-0541-1 [ Links ]
30. Sulla VZ, Zikhali P, Cuevas PF. Inequality in southern Africa: An assessment of the Southern African Customs Union. Washington, DC: World Bank Group, 2022. [ Links ]
31. Meara JG, Leather AJM, Hagander L, et al Global surgery 2030: Evidence and solutions for achieving health, welfare, and economic development. Lancet 2015;386(9993):569-624. https://doi.org/10.1016/S0140-6736(15)60160-X [ Links ]
32. Statistics South Africa. Statistics by place 2023. Pretoria: Stats SA, 2023. https://www.statssa.gov.za/?page_id=993&id=city-of-cape-town-municipality (accessed 10 July 2023). [ Links ]
33. General Household Survey (2018). Pretoria: Statistics South Africa, 2019. [ Links ]
34. Charles M. 'Traumatised' emergency staff targeted by violent criminals in Western Cape. News 24, 2023. https://www.news24.com/news24/southafrica/news/traumatised-emergency-staff-targeted-by-violent-criminals-in-western-cape-202303 (accessed 19 March 2024) [ Links ]
35. Gelby F. Ambulance in red zones in Cape Town, South Africa. Waiting times for patients when ambulance requires an armed escort. Master's thesis) Boras, Sweden: University of Boras, 2018. [ Links ]
36. New Temporary Du Noon Clinic an example of Governing Better Together. News and Speeches, Western Cape Government, April 2013. https://www.westerncape.gov.za/news/new-temporary-du-noon-clinic-example-governing-better-together (accessed 19 March 2024). [ Links ]
37. Ludidi V. Grabouw gets 24-hour health service following protests. Groundup, 2019. [ Links ]
 Correspondence:
M Richards
mark.richards@uct.ac.za
Accepted 4 March 2024

