


Services on Demand
Article
 English (pdf)
 Article in xml format
 Article references
Indicators

Related links
-
 Cited by Google
 -
 Similars in Google
Share

 Permalink
SAMJ: South African Medical Journal
On-line version ISSN 2078-5135
Print version ISSN 0256-9574
SAMJ, S. Afr. med. j. vol.114 n.3 Pretoria Mar. 2024
http://dx.doi.org/10.7196/SAMJ.2024.v114i3.1560
RESEARCH
Lower respiratory tract infection admissions and deaths among children under 5 years in public sector facilities in the Western Cape Province, South Africa, before and during the COVID-19 pandemic (2019 - 2021)
K KehoeI, II, III; E MordenIII, IV;A HeekesV, VI;H E JonesVII;S R WalterVIII, IX;T JacobsIII; J MurrayX;H BuysXI, XII;B EleyXIII, XIV;M T RedanielVII, IX, *; M-A DaviesV, VI, *
IMPH; Centre for Infectious Disease Epidemiology and Research, School of Public Health, University of Cape Town, South Africa
IIMPH; Population Health Sciences, Bristol Medical School, University of Bristol, UK
IIIMPH; Health Intelligence Directorate, Western Cape Government Health and Wellness, South Africa
IVMPHDivision of Public Health Medicine, School of Public Health, University of Cape Town, South Africa
VPhD;Centre for Infectious Disease Epidemiology and Research, School of Public Health, University of Cape Town, South Africa
VIPhD;Health Intelligence Directorate, Western Cape Government Health and Wellness, South Africa
VIIPhD;Population Health Sciences, Bristol Medical School, University of Bristol, UK
VIIIPhD;Population Health Sciences, Bristol Medical School, University of Bristol, UK
IXPhD;National Institute for Health and Care Research Applied Research Collaboration West (NIHR ARC West) at University Hospitals Bristol and Weston NHS Foundation Trust, Bristol, UK
XMB ChB; Department of Paediatrics & Neonatology, Paarl Hospital, Western Cape Government Health and Wellness, Paarl, South Africa
XIFCPaed;Department of Paediatrics and Child Health, University of Cape Town, Cape Town, South Africa
XIIFCPaed;Red Cross War Memorial Children’s Hospital, Western Cape Government Health and Wellness, Cape Town, South Africa
XIIIMB ChB; Department of Paediatrics and Child Health, University of Cape Town, Cape Town, South Africa
XIVMB ChB; Red Cross War Memorial Children’s Hospital, Western Cape Government Health and Wellness, Cape Town, South Africa
ABSTRACT
BACKGROUND: The COVID-19 pandemic resulted in the implementation of strict public health and social measures (PHSMs) (including mobility restrictions, social distancing, mask-wearing and hand hygiene), limitations on non-essential healthcare services, and public fear of COVID-19 infection, all of which potentially affected transmission and healthcare use for other diseases such as lower respiratory tract infections (LRTIs).
OBJECTIVE: To determine changes in LRTI hospital admissions and in-facility mortality in children aged <5 years in the Western Cape Province during the pandemic.
METHODS: We conducted a retrospective analysis of LRTI admissions and in-facility deaths from January 2019 to November 2021. We estimated changes in rates and trends of LRTI admissions during the pandemic compared with pre-pandemic period using interrupted time series analysis, adjusting for key characteristics.
RESULTS: There were 36 277 children admitted for LRTIs during the study period, of whom 58% were male and 51% were aged 28 days -1 year. COVID-19 restrictions were associated with a 13% step reduction in LRTI admissions compared with the pre-COVID-19 period (incidence rate ratio (IRR) 0.87, 95% confidence interval (CI)) 0.80 - 0.94). The average LRTI admission trend increased on average by 2% per month during the pandemic (IRR 1.02, 95% CI 1.02 - 1.04).
CONCLUSIONS: The COVID-19 surges and their associated measures were linked to declining LRTI admissions and in-facility deaths, likely driven by a combination of reduced infectious disease transmission and reduced use of healthcare services, with effects diminishing over time. These findings may inform future pandemic response policies.
The COVID-19 pandemic and subsequent responses by both the South African (SA) government and the population resulted in many changes impacting disease transmission, access to healthcare services, and population mobility.[1,2] Changes were driven by a combination of public fear of COVID-19 infection, restricted provision of non-essential health services and the introduction of strict public health and social measures (PHSMs),[2] aimed at curbing the spread of SARS-CoV-2 and ensuring sufficient hospital capacity for COVID-19 admissions.
Based on core indicators of COVID-19 burden such as case numbers and hospitalisations, PHSMs, first introduced on 26 March 2020, were either relaxed or tightened nationally. PHSMs included physical distancing, restrictions on non-essential services, remote working and closures of schools and early childhood development centres.[2] Additional practices such as mask-wearing, using of alcohol-based sanitisers and promotion of handwashing were implemented throughout the pandemic.[2,3] The Western Cape Government Department of Health and Wellness (WCGHW) kept primary healthcare services, including childhood immunisation, operational. However, they intentionally de-escalated certain healthcare services by postponing elective surgery, reducing routine clinic appointments and increasing duration of drugs dispensed to increase capacity to treat COVID-19 patients. All of these factors, combined with the fear of acquiring COVID-19 at healthcare facilities, likely impacted both the transmission and healthcare service use for other infectious diseases such as non-COVID-19 lower respiratory tract infections (LRTIs). To effectively plan for future pandemic responses, it is important to evaluate the impacts on LRTI morbidity and mortality that, prior to COVID-19, persisted across SA in children aged <5 years with pronounced seasonality in the early winter months (March/April - June).[4,5]
We aimed to assess the changes in number and rates of LRTI hospital admissions and in-facility mortality among children aged <5 years in relation to COVID-19 surges and associated measures, including PHSMs, in public sector facilities in the Western Cape Province from January 2019 to November 2021.
Methods
Setting and study population
The mid-year population estimate for the Western Cape Province in 2022 was ~7.2 million, of which ~8% (586 201) were children aged <5 years.[6] About 75% of the population access public sector healthcare, but this proportion among children <5 years is likely higher (around 80%).[7] We included hospitalisation data for all children aged <5 years who were hospitalised or died from LRTIs at Western Cape public sector facilities from January 2019 to November 2021.
Data sources and variables
We developed a consolidated dataset from the data sources described below, aggregating data by location and calendar month. Within the Western Cape, the public sector healthcare services are geographically distributed into one metropolitan and five rural districts. The metropolitan district services ~66% of the population,[6] and for this analysis we further grouped data into the eight health subdistricts.
LRTI hospital admissions and in-facility deaths
We identified LRTI hospital admissions and in-facility deaths using a dataset derived from three data sources available in the Western Cape Provincial Health Data Centre (WCPHDC): routine health information systems (RHIS);[7] Child Problem Identification Programme (Child PIP);[8,9] and Death Notification (DN) Surveillance.[10] This dataset is described in detail elsewhere.[11] Briefly, the dataset leveraged all available International Classification of Diseases 10th Revision (ICD-10) codes at discharge to identify LRTI hospital admissions. ICD-10 coding practices improved during the pandemic, with higher completeness when compared with pre-pandemic. The cause of in-facility LRTI deaths was determined using the cause of death recorded in Child PIP or DN Surveillance if available, or a proxy cause of death from RHIS based on ICD-10 admission code.
Population estimates
The Western Cape population estimates are based on the 2022 mid-year estimates from Statistics South Africa at district level, projected at subdistrict level using the ratio method.[6]
COVID-19 PHSMs
The first PHSM implementation occurred shortly after the first imported COVID-19 case was identified in SA, when COVID-19 cases and admissions were still low. During subsequent COVID-19 waves, stricter PHSMs were implemented at the onset of or during COVID-19 waves when the number of cases/admissions were highest nationally and/or healthcare services were under severe pressure. PHSMs were relaxed during inter-wave periods. The PHSMs and implementation dates are summarised in Table S1 (appendix https://www.samedical.org/file/2172). Briefly, more stringent PHSMs included restrictions of movement within and into the country; reduced social interactions through curfews, closures of schools, early childhood development centres and other institutions, and wearing of masks and face coverings.[2] There was also widespread provision of alcohol-based sanitisers and promotion of hand-washing.[2,3] These PHSMs could have impacted the spread of COVID-19, as well as other infections.
The analysis period extends to November 2021, 2 months after the end of the final wave that caused major pressure on healthcare services. There was no further increase in stringency of PHSMs thereafter. The analysis thus concluded at the last implementation (relaxation) of PHSMs.
Data analysis
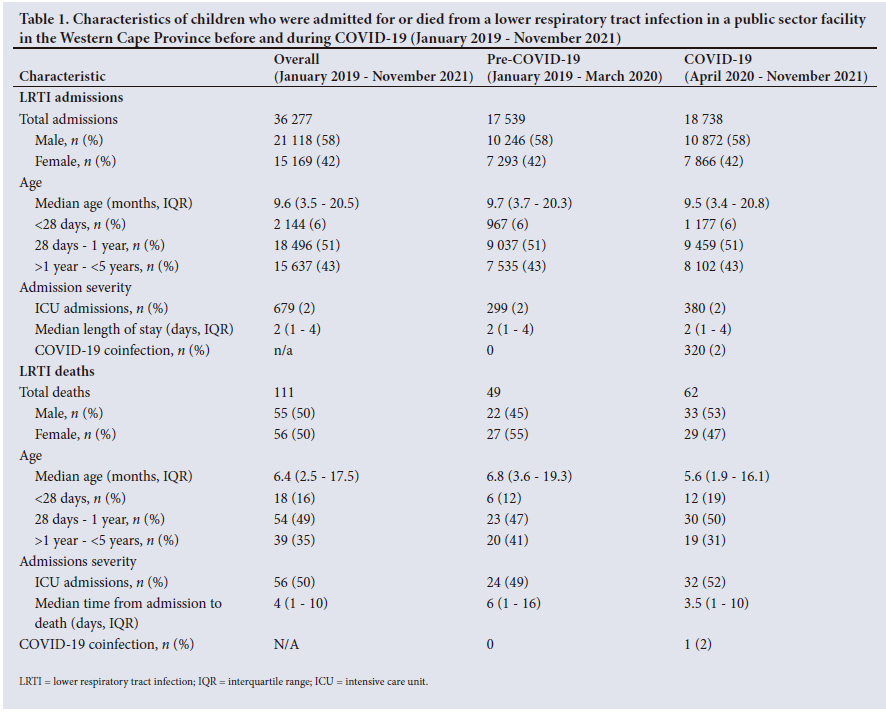
We described characteristics of children who were either admitted or died in facilities due to LRTIs during different time periods: the entire study period (January 2019 - November 2021), pre-pandemic (January 2019 - March 2020) and COVID-19 pandemic (April 2020 - November 2021). Characteristics described included sex, age, admission severity and COVID-19 coinfection. Medians and interquartile ranges (IQRs) were used for continuous variables, and frequencies and proportions for categorical variables.
We described how LRTI admission rates, admission mortality rates and case fatality rates (CFRs) changed across time periods. LRTI admission rates were estimated for each time period by dividing LRTI admissions by 80% of the population estimates for children <5 years (representing the estimated proportion accessing public sector healthcare services). Rates are presented per 1 000 person months with 95% confidence intervals (CIs). We also estimated mortality rates with 95% CIs including: (i) admission mortality rates per 100 000 live births (number of LRTI in-facility deaths divided by the number of live births documented in the province) and (ii) CFRs (number of LRTI in-facility deaths divided by total LRTI admissions).
To assess the association between COVID-19 surges and associated factors, including PHSMs, and LRTI admissions more formally, we conducted an interrupted time series analysis[12] using negative binomial segmented regression applied to monthly level data and allowing for both a level and trend change. We applied random effects for location to account for differences in access to healthcare across locations. Time was measured in calendar months and divided into pre-COVID-19 (January 2019 - March 2020) and COVID-19 (April 2020 - November 2021) periods. The COVID-19 period was further divided based on changes in PHSMs, including alternating periods of stricter and eased measures: April - August 2020, September - December 2020, January - February 2021, March - June 2021, July - September 2021 and October - November 2021. A separate model was fitted to each pair of restriction periods to assess changes in LRTI related to each change in restriction level. Incidence rate ratios (IRRs) and 95% CIs were reported for the step change, trend change and the post-interruption trend for each model comparison. The step change refers to the shift in LRTI admissions immediately post-PHSM introduction compared to immediately pre-PHSM. The trend change represents the ratio of the trend in LRTI admissions over time after PHSM implementation v. the trend before PHSM. The post-interruption trend is the trend per calendar month in LRTI admissions in the period after PHSM implementation.
The model adjusted for several aggregated variables deemed potential confounders (limited by data availability), including proportion male, median age of LRTI admission, median duration of LRTI admission, quarterly proxy immunisation coverage, COVID-19 confirmed admissions and seasonality (measured in quarters: January -March, April - June, July - September, October - December) to account for autocorrelation. Proxy immunisation coverage was calculated quarterly by dividing the number of fully immunised children aged <1 year by the previous year's <1 year population (to represent a proxy eligible cohort), adjusted for quarterly live births from the WCPHDC (which records live births in all public sector facilities). The number of children fully immunised with the expanded programme of immunisation (EPI) vaccines was extracted from the District Health Information System (January 2019 - December 2021).[7] Vaccines included in the EPI are polio, tuberculosis, rotavirus, diphtheria, tetanus, pertussis, Haemophilus influenzae type B, hepatitis B and pneumococcus.[5] COVID-19 cases and admissions were used to as a proxy for service pressure measured by people with a laboratory-confirmed COVID-19 diagnosis (positive SARS-CoV-2 PCR or antigen test), irrespective of symptoms. We did not consider COVID-19 cases based on clinical diagnosis only, nor on multisystem inflammatory syndrome in children unless there was a corresponding positive SARS-CoV-2 test. COVID-19 cases and admissions included the number of new diagnoses, irrespective of whether these were first or subsequent infections. We conducted a sensitivity analysis excluding children co-infected with COVID-19 during LRTI admission to assess potential impact on LRTI admission rates.
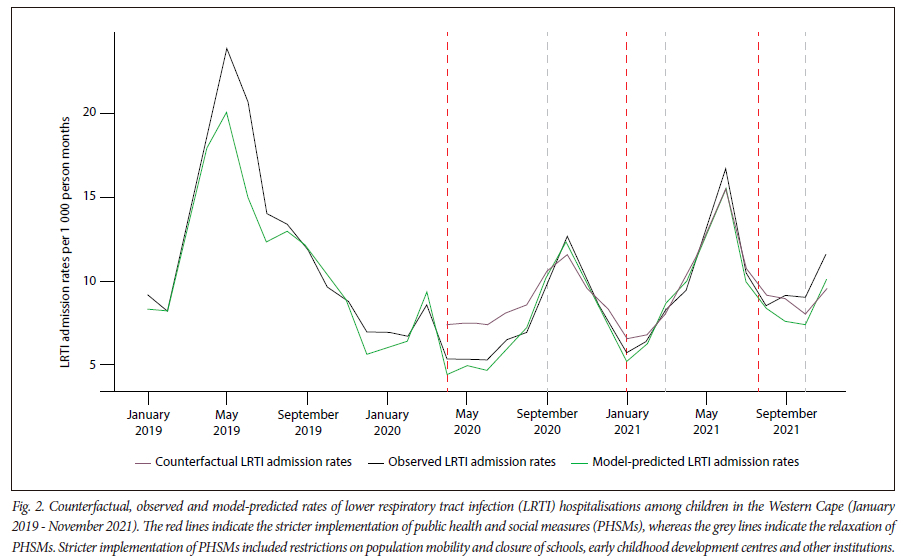
To assess what would have happened to LRTI admission rates under the expected seasonality pattern had the pandemic and its associated factors not occurred, we also modelled the pre-COVID-19 period alone. We used the estimated relationship between covariates and outcome to forecast counterfactual LRTI admission rates for the pandemic period. This pre-pandemic period model included the same variables as the full model, with the exception of COVID-19 cases and the interruption variable. Observed, model-predicted and counterfactual LRTI admission rates per 1 000 person months were plotted.
Data cleaning and coding were performed in SQL (ISO/IEC JTC 1, Switzerland), while data linkage and aggregation were done in R Studio 2022.12.0 (Rstudio, USA), and analysis in Stata 17.0 (StataCorp, USA).
Ethical approval
This study was approved by the Human Research Ethics Committee in the Faculty of Health Sciences at the University of Cape Town (ref. no. HREC REF 197/2021).
Results
Characteristics of LRTI admissions and in-facility deaths in children
Of 36 277 children admitted for LRTIs for the entire study period, most were male (n=21 118, 58%) and aged 28 days - 1 year (n=18 496, 51%), with 2% (n=679) of LRTI admissions including a period in an intensive care unit (ICU) (Table 1). The distribution of these characteristics for LRTI hospital admissions were similar during the pre-COVID-19 and COVID-19 periods. Among children who died from LRTIs in facility, the median age at death was 6.8 months (IQR 3.6 - 19.3 months) pre COVID-19 and 5.6 months (IQR 1.9 -16.1 months) during the pandemic period. The median time from admission to death was 6 days (IQR 1 - 16 days) pre-COVID-19 and 3.5 days (IQR 1 - 10 days) during COVID-19.
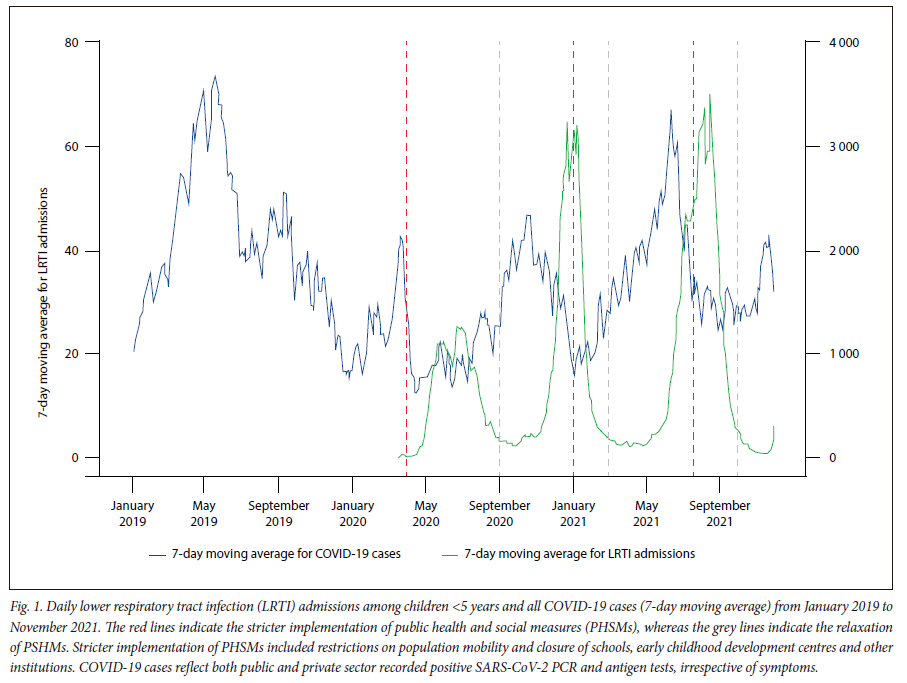
Daily LRTI admissions and COVID-19 cases
During stricter PHSMs, which were implemented prior to the COVID-19 peaks, LRTI admissions were at the lowest levels (Fig. 1). The pre-pandemic early-winter surge (April - June) in LRTI admissions shifted to later in the year after the onset of COVID-19 PHSMs.
Rates of LRTI admissions and in-facility deaths across PHSM periods
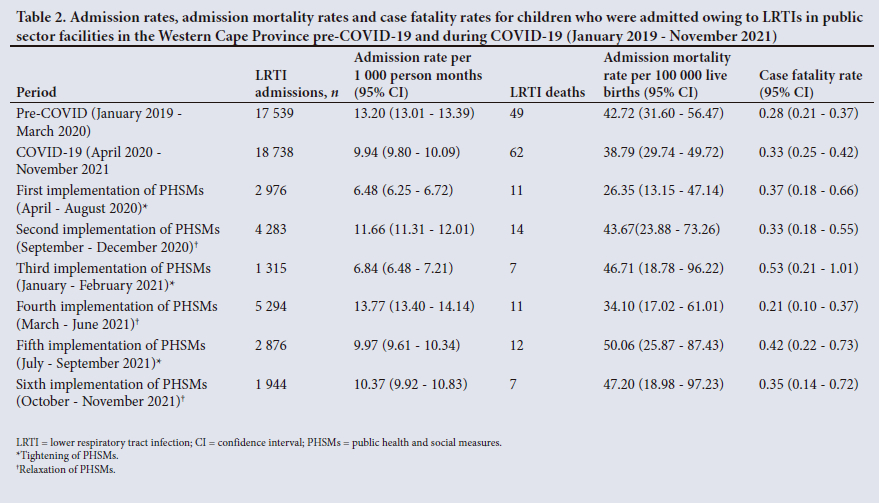
LRTI admission rates lowered from 13.20 LRTI admissions per 1 000 person months (95% CI 13.01 - 13.39) pre-pandemic to 9.94 LRTI admissions per 1 000 person months (95% CI 9.80 - 10.09) during COVID-19 overall (Table 2). During the first and strictest implementation of PHSMs, the admission rate lowered from pre-COVID-19 to 6.48 LRTI admissions per 1 000 person months (95% CI 6.25 - 6.72) (Table 2). During the period of PHSMs relaxation, (second and fourth implementation) the average LRTI admission rates were higher than the preceding period, except for the sixth implementation, where LRTI admission rates remained similar.
There was a slight decrease in LRTI admission mortality rates: 42.72 deaths per 100 000 live births (95% CI 31.60 - 56.47) in the pre-pandemic period to 38.79 deaths per 100 000 live births (95% CI 29.74 - 49.72) in the pandemic period overall (Table 2). The pattern of fluctuations in LRTI admission rates with PHSMs was not observed in LRTI admission mortality rates. There was a decrease during the first (the strictest) and the fourth (a relaxation) implementation of PHSMs. The CFRs followed a similar pattern to the admission mortality rates; however, the highest CFR (0.53%, 95% CI 0.21 - 1.01) was observed during the third implementation (tightening of restrictions) of PHSMs.
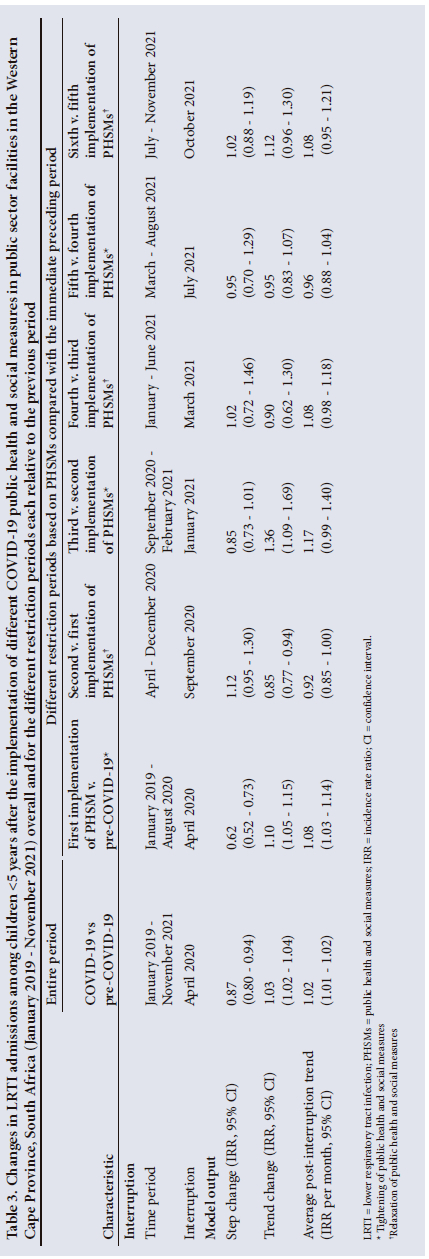
Interrupted time series model: Changes in LRTI admissions in relation to PHSMs
After adjusting for potential confounders, we estimated that the COVID-19 period was associated with a 13% (IRR 0.87, 95% CI 0.80 -0.94) step reduction in LRTI admissions v. pre-COVID-19 (Table 3), followed by an increase in average trend of 2% per month (IRR 1.02, 95% CI 1.02 - 1.04). Analysing different periods of PHSM implementation revealed that the initial (strictest) implementation of PHSMs was associated with the greatest step drop in LRTI admissions (IRR 0.62, 95% CI 0.52 - 0.73), followed by an 8% average increase per month (IRR 1.08, 95% CI 1.03 - 1.14). Generally, step increases were associated with PHSM easing. There was a diminishing step change effect over time, with no evidence of change for the last PHSM implementation. Similar step and trend changes were observed when COVID-19 co-infected cases were excluded from the analysis (appendix Table S2).
Counterfactual and estimated LRTI admission rates
Predicted counterfactual LRTI admission rates during the first PHSM implementation based on the assumption of no PHSM effect were higher than observed rates through the initial period following the first PHSM measures (Fig. 2). Subsequently, observed and counterfactual LRTI admission rates were similar at longer durations post interruption.
Discussion
Our study demonstrated how the effects of the COVID-19 pandemic, including PHSMs co-occurring service de-escalation and fear of accessing healthcare services, impacted LRTI admissions and in-facility deaths in public healthcare facilities in the Western Cape, SA. Overall, the greatest reductions were associated with stricter PHSMs, with greatest declines in LRTI admissions noted as PHSMs were first introduced. Early on, in-facility LRTI admission mortality rates decreased when more stringent PHSMs were in place. However, increases in CFRs were observed with reductions of LRTI admissions, generally during stricter PHSMs.
Previous studies in other low- and middle-income settings have reported similar findings,[13,14] indicating that PHSM changes impacted LRTI admission rates among children, with the greatest reductions temporally associated with stricter PHSMs. However, determining the extent to which these reductions were influenced by decreased transmission from school closures, social distancing and improved hygiene practices v. reduced healthcare use due to mobility restrictions and/or fear is difficult, as these factors often occurred simultaneously. Nonetheless, because PHSMs were implemented nationwide in SA, whereas the timing of the worst COVID-19 healthcare service admission pressure varied by province, we could examine the impact of PHSMs independently from the effect of facilities being overburdened by COVID-19 admissions. The change in childhood LRTI admission patterns, preceding the COVID-19 admission peak and coinciding with the adjustment of PHSM stringency, suggests that reduced admissions were not due to reduced healthcare access driven by overburdened healthcare facilities. Rather, our findings indicate that PHSMs and resulting behavioural shifts influenced disease transmission. Additionally, the interplay of PHSMs and fear of contracting COVID-19 at healthcare facilities affected healthcare utilisation.
Behaviour changes due to COVID-19 PHSMs (social distancing, mask wearing, hand hygiene practices and healthcare use) disrupted the previously established seasonal pattern of an autumn/winter LRTI admission peak, potentially altering immunity to LRTI pathogens, with children being less exposed to LRTIs at younger ages. Similar shifts in seasonality for LRTI admissions have been observed in other settings.[13-15]
Despite decreases in children <5 years dying across SA during COVID-19, pneumonia remained one of the main causes of death.[15,16] Children dying from LRTIs during COVID-19 were generally younger, with shorter admission-to-death time v. pre-pandemic. This suggests that either more severely ill children sought healthcare during the pandemic, or there were challenges in accessing healthcare in the context of PHSMs, potentially leading to worsened illness severity upon presentation. Admission mortality rates were overall slightly lower in the pandemic v. pre-pandemic, consistent with findings in other SA facilities. [13] It is possible that the proportion of out-of-facility mortality increased during this time, but we were unable to evaluate this as our study was limited to in-facility mortality. We observed fluctuations in LRTI admission rates each time the PHSMs were altered. The highest CFRs and admission mortality rates largely coincided with increased service pressure during COVID-19 waves as well as reductions in mobility due to tightening of PHSMs and/or fear of transmission during COVID-19 waves. Caution should be exercised when interpreting these findings, as CFRs are sensitive to the number of admissions, and the lowest number of LRTI admissions occurred during this time.
This study was strengthened by using individual-level data for the aggregation, allowing us to have linked admission and mortality outcomes of children, informed by data linkage within the WCPHDC.[11] We had data for the entire Western Cape Province for both time periods, increasing the generalisability of these findings. We used a comprehensive list of ICD-10 codes to identify LRTI admissions and in-facility deaths, ensuring thorough case identification. Mapping LRTI admissions and deaths to a child's residence helped identify the burden of severe illness in the community.
This study had several limitations. Aggregated monthly data sometimes grouped PHSM implementations in the same month, addressed by selecting the closest month for analysis. Out-of-facility deaths were inaccessible, which may have increased owing to healthcare access challenges in the context of PHSMs. We relied solely on electronic health records; however, we believe that electronic data completeness was high and, if anything, increased in more recent years and during the pandemic, which would have resulted in underestimating the PHSM-associated reductions in LRTI admissions and deaths. We only had LRTI admissions, not all cases, hindering our understanding of the full impact of COVID-19 surges and the associated factors. We were only able to adjust for socioeconomic status using the subdistrict or district of the child's residence as a crude proxy. Data variables were limited by availability.
Hospital data and population estimates reflected the child's residence, whereas immunisations, live births and COVID-19 data represented healthcare service locations. Population estimates, the denominator to calculate rates, are based on an assumption of the percentage of children reliant on public sector services. A different assumption may alter the rates themselves, but would not impact estimated changes over time.
Conclusion
COVID-19 surges and changes in stringency of COVID-19 PHSMs were associated with temporal reductions in LRTI admissions and deaths, albeit with impacts diminishing over time. This is likely due to a combination of social distancing and hand hygiene measures directly impacting LRTI transmission, as well as decreased population mobility and hesitancy/fear reducing access to healthcare services. The lowest levels of LRTI admissions coincided with the strictest PHSMs, rather than with COVID-19 wave peaks. This suggests that the changing pattern of LRTI admissions was not due to the COVID-19 pandemic nor high COVID-19 service pressure crowding out paediatric LRTI admissions, but could be due to direct impacts of PHSMs on respiratory pathogen transmission, as well as reduced mobility and fear reducing healthcare access. These findings can be used to inform policies for responses to future pandemics.
Declaration. This study will form part of KK's PhD.
Acknowledgements. The authors acknowledge the children included in this study, their clinicians and service providers. We thank the WCPHDC for their assistance.
Author contributions. KK conceptualised the research study with guidance from MAD, MTR, SRW, HEJ and BE. KK was responsible for the data management with assistance from NZ and AH. KK was responsible for data cleaning, statistical analyses and the initial draft manuscript. SRW, HEJ, BE, MAD and MTR supervised data analysis. All authors (KK, EM, TJ, NZ, AH, JRM, HB, SRW, BE, HEJ, MTR and MAD) reviewed, revised and approved the final manuscript.
Funding. We acknowledge funding from the Bill and Melinda Gates Foundation (OPP1164272), the National Institutes of Health (R01 HD080465; R61 HD103093; U01 AI069924), the Grand Challenges ICODA pilot initiative delivered by Health Data Research UK and funded by the Bill and Melinda Gates and Minderoo Foundations (INV-017293), the Wellcome Trust (203135/Z/16/Z, 222574) and the European Union (101045989).
Conflicts of interest. None.
References
1. Spaull N, Ardington C, Bassier I, et al. Overview and findings NIDS-CRAM synthesis report wave 1 September 2020. National Income Dynamics Study - Coronavirus Rapid Mobility Survey. NiDS, 2020. [ Links ]
2. South African Government. COVID-19/Coronavirus. 2023. https://www.gov.za/Coronavirus (accessed 20 March 2020). [ Links ]
3. Moonasar D, Pillay A, Leonard E, et al. COVID-19: Lessons and experiences from South Africa's first surge. BMJ Glob Health 2021;6(2):1-5. https://doi.org/10.1136/bmjgh-2020-004393 [ Links ]
4. Isaacs-Long Y, Myer L, Zar HJ. Trends in admissions, morbidity and outcomes at Red Cross War Memorial Children's Hospital, Cape Town, 2004 - 2013. S Afr Med J 2017;107(3):219-226. https://doi.org/10.7196/SAMJ.2017.v107i3.11364 [ Links ]
5. Massyn N, Barron P, Day C, Ndlovu N, Padarath A. District Health Barometer 2018/19. Durban: Health Systems Trust, 2020. https://doi.org/0.1017/CBO9781107415324.004 [ Links ]
6. Western Cape Government: Department of Health. Circular H12 of 2023 population. 2023. [ Links ]
7. Boulle A, Heekes A, Tiffin N, et al. International Journal of Data Centre Profile: The provincial health data centre of the Western Cape. Int J Popul Data Sci 2019;4(2):6. https://doi.org/10.23889/ijpds.v4i2.1143 [ Links ]
8. Patrick ME, Stephen CR. Child PIP: Making mortality meaningful by using a structured mortality review process to improve the quality of care that children receive in the South African health system. S Afr J Child Health 2008;2(2):38-42. https://doi.org/10.7196/SAJCH.100 [ Links ]
9. Stephen C. Saving Children 2012 - 2013: An eighth survey of child healthcare in South Africa. Pretoria: Tshepesa Press, 2016. [ Links ]
10. Groenewald P, Bertelet M, Bradshaw D, et al. Western Cape Mortality Profile 2010. Cape Town: South African Medical Research Council, 2013. [ Links ]
11. Kehoe K, Morden E, Jacobs T, et al. Comparison of paediatric infectious disease deaths in public sector health facilities using different data sources in the Western Cape, South Africa (2007 - 2021). BMC Infect Dis 2023;23(1):1-11. https://doi.org/10.1186/s12879-023-08012-6 [ Links ]
12. Bernal JL, Cummins S, Gasparrini A. Interrupted time series regression for the evaluation of public health interventions: A tutorial. Int J Epidemiol 2017;46(1):348-355. https://doi.org/10.1093/ije/dyw098 [ Links ]
13. Izu A, Nunes MC, Solomon F, et al. All-cause and pathogen-specific lower respiratory tract infection hospital admissions in children younger than 5 years during the COVID-19 pandemic (2020 - 22) compared with the pre-pandemic period (2015 - 19) in South Africa: An observation. Lancet Infect Dis 2023;3099(23):1-11. https://doi.org/10.1016/S1473-3099(23)00200-1 [ Links ]
14. Uppala R, Sitthikarnkha P, Niamsanit S, Sutra S. Effect of the COVID-19 pandemic on lower respiratory tract infection determinants in Thai hospitalised children : National data analysis 2015-2020. Trop Med Infect Dis 2022;7(8):151. https://doi.org/0.3390/tropicalmed7080151 [ Links ]
15. Bardsley M, Morbey RA, Hughes HE, et al. Epidemiology of respiratory syncytial virus in children younger than 5 years in England during the COVID-19 pandemic, measured by laboratory, clinical, and syndromic surveillance: A retrospective observational study. Lancet Infect Dis 2023;23(1):56-66. https://doi.org/10.1016/S1473-3099(22)00525-4 [ Links ]
16. Pillay Y, Museriri H, Barron P, Zondi T. Recovering from COVID lockdowns: Routine public sector PHC services in South Africa, 2019 - 2021. S Afr Med J 2022;113(1):17-23. https://doi.org/10.7196/SAMJ.2022.V113I1.16619 [ Links ]
 Correspondence:
K Kehoe
Kathleen.Kehoe@westerncape.gov.za
Accepted 12 December 2023
* Joint last authors

