


Servicios Personalizados
Articulo
 Inglés (pdf)
 Articulo en XML
 Referencias del artículo
Indicadores

Links relacionados
-
 Citado por Google
 -
 Similares en Google
Compartir

 Permalink
SAMJ: South African Medical Journal
versión On-line ISSN 2078-5135
versión impresa ISSN 0256-9574
SAMJ, S. Afr. med. j. vol.114 no.2 Pretoria feb. 2024
http://dx.doi.org/10.7196/SAMJ.2023.v114i2.1054
RESEARCH
Mortality trends during the first three waves of the COVID-19 pandemic at an urban district hospital in South Africa: A retrospective comparative analysis
O HirachundI; C PennefatherII; M NaidooIII
IMB BCh, DIPEC (SA); Wentworth Hospital, Sidmouth Avenue, Wentworth, South Africa
IIMB ChB; Wentworth Hospital, Sidmouth Avenue, Wentworth, South Africa
IIIMB ChB, MMedSci; Family Physician, Department of Family Medicine, University of KwaZulu-Natal, Durban, South Africa
ABSTRACT
BACKGROUND: Severe acute respiratory syndrome coronavirus 2 (SARS-COV-2) is the virus responsible for the COVID-19 (C19) pandemic. South Africa (SA) experienced multiple periods of increased transmission. Tertiary, regional and central hospitals were overwhelmed, resulting in low acceptance rates
OBJECTIVES: To compare mortality trends of patients who died in hospital from SARS-CoV-2 infection during the first three waves of infection as defined by the National Institute of Communicable Diseases of South Africa
METHODS: This was a retrospective cohort study at a district level hospital of 311 adults who died within the first three waves of COVID-19. The study analysed case and crude fatality rates, baseline characteristics, symptomatology, clinical presentation and management of patients
RESULTS: Waves 1, 2 and 3 yielded case fatality rates of 14.5%, 27.6% and 6.3%, respectively, and crude fatality rates of 16.7%, 33.0% and 12.2%, respectively. Black Africans were less likely to die during the third wave (odds ratio (OR) 0.54; 95% confidence interval (CI) 0.31 - 0.94). Patients in the second wave had clinical frailty scores of <5 (OR 2.51; 95% CI 1.56 - 4.03). Obesity was most prevalent in the second wave (OR 1.87; 95% CI 1.01 - 3.46), and dyslipidaemia (OR 3.03; 95% CI 1.59 - 5.77) and ischaemic heart disease (OR 3.77; 95% CI .71 - 8.33) were most prevalent during the third wave. Severe ground glass appearance was most common during the second wave (OR 2.37; 95% CI 1.49 - 3.77). Renal impairment was most prevalent during the first wave (OR 3.28; 95% CI 1.59 - 6.77), and thrombo-embolic phenomena were less common during wave three (OR 0.12; 95% CI 0.02 - 0.91
CONCLUSION: The Beta variant was the most virulent, with the highest case and crude fatality rates in wave 2
Since the start of the COVID-19 (C19) pandemic, there have been multiple studies worldwide. However, knowledge of mortality trends in developing countries - particularly at a district hospital (DH) level -is limited. Mortality remains high in multi-morbid ventilated patients with C19 in South Africa (SA) at any level of care.[1] Globally, multiple independent risk factors have been identified as key contributors to the development of severe disease and mortality. These risk factors include male sex, obesity and comorbidities such as hypertension (HT), type 2 diabetes mellitus (T2DM), cardiovascular disorders, malignancies, chronic obstructive pulmonary disease, pulmonary tuberculosis (PTB) and HIV.[2] Within SA, differential patterns of C19 deaths by sex, age, comorbidities and province have emerged. However, individuals with HT and T2DM are reliably shown to be at high risk of death from C19.P1
On 1 April 2020, the National Institute for Communicable Diseases (NICD) developed the DATCOV database to serve as a national surveillance system for C19 hospitalisations.[4] This system allowed for data to be collected regarding C19. However, there is no official system to ensure regular analysis of these data within individual institutions to allow appropriate feedback to improve service provision. Little is known about the impact of the C19 pandemic on these facilities and the differences in mortality trends between the first three waves at all DHs in SA. Anecdotal reports suggest that many DHs had little support from higher levels of care (tertiary and regional hospitals) during surges in the infection rate.
What this study adds
Prior to the pandemic, most DHs in SA functioned at their peak capacity due to staff shortages and an increased service load.[3] Mortality trends are essential for future planning/risk stratification of patients. Most of the data published within SA have been gathered at a tertiary level - minimal evidence exists at a DH level. This is particularly important to guide decision-making, especially in resource-constrained environments with limited ability to expand critical care capacity.[5] Ethical allocation of resources with early effective triaging of patients is dependent on local data to ensure equitable and appropriate admission to critical care services. This study utilises Wentworth Hospital (WWH) as an example of a DH in SA. The findings of this study may be generalised to other low-resourced facilities in low- and middle-income countries (LMICs) or rural primary care facilities in high-income countries (HICs).
Severe acute respiratory syndrome coronavirus 2 (SARS-CoV-2) is responsible for the C19 pandemic. SA has experienced numerous periods of increased transmission, also known as 'waves' of infection.[5] Variants or mutations of the original virus drove the surges in infection rates. The first wave was predominated by the ancestral strain with the Asp614Gly mutation, the Beta variant (B.1.351) during the second wave and the Delta variant (B.1.617.2) during the third wave.[5] Prior to the vaccination rollout, state-run and private healthcare facilities across the country were overwhelmed by the impact of C19.[1] SA's overall facility case fatality rate was 21.5% during the first wave, 28.8%
during the second wave and 26.4% during the third wave.[5] Despite evidence existing from a SA context, most of the published studies were conducted in the Western Cape Province. The Western Cape has better infrastructure and a stronger healthcare system than many other provinces in the country, and therefore the mortality rates are likely to be lower than in other parts of SA.[1,7,8] Mortality rates were highest in patients aged >60 years and in those with comorbidities -especially obesity, hypertension and diabetes mellitus.[9] These results are in keeping with international findings.
The SA public healthcare system consists of various levels of hospitals: district, regional, tertiary, provincial tertiary, central and specialised.[10] DHs provide primary healthcare and unspecialised services, and subsequently refer patients to regional or tertiary facilities should the patient require a higher level of care. During the peak of each wave, many tertiary, regional and central hospitals were inundated with large patient volumes, resulting in poor acceptance rates of referrals from DHs. Consequently, many severely ill patients with complex presentations were managed at DHs. In KwaZulu-Natal Province (KZN), intensive care unit (ICU) services were limited, and many ill patients were placed on waiting lists for ICU beds. In the interim, these patients were managed at the DH level. The additional burden of increasing healthcare worker infection rates -who required self-isolation - posed increased stressors to an already resource-constrained environment.[7] Contract staff were employed to bridge the gap of the service burden during the C19 pandemic, but many of them were untrained in managing critically ill patients.
This study compared mortality rates, examined the risk factors for death and explored differing clinical presentations of patients with SARS-CoV-2 infection between the first three defined waves of infection at an urban DH in KZN, SA. There are limited data from level one hospital facilities in SA, and therefore limited insight into the effects of the pandemic at a primary care level.
Methods
Study design and setting
A single-centre retrospective observational analysis of WWH's clinical records was performed. WWH is a DH in Durban, KZN, SA. The target population included all patients admitted to WWH who subsequently died from C19 disease in the hospital within the designated waves as defined by the NICD.[11] Wave one in KZN was from week 26 - 34 of 2020; wave two was from week 49 of 2020 to week five of 2021, and wave three was from week 24 to 37 of 2021.
Inclusion and exclusion criteria
All patients >18 years of age infected with C19 (based on clinical, biochemical or radiological features suggestive of SARS-CoV-2 infection) who were admitted and subsequently died in hospital during the defined waves were included in the study. The study excluded patients who died outside of the defined waves. None of the patients were re-admissions, and patients who were discharged and died at home were not included in the study. The diagnosis of C19 disease was based on a positive polymerase chain reaction (PCR) test from a nasopharyngeal upper respiratory tract swab. A small subset of patients with negative PCR tests were included in the study based on the score attained in a locally devised clinical probability score. A score of >9 (out of 21) was deemed 'highly suggestive' of C19. Points were awarded as follows: a history of positive contact (2 points); acute cough (1 point); fever >38°C (2 points); respiratory rate >25/min (1 point); pulse oximetry saturation (SpO2) <95% (2 points); recent loss of taste/smell (3 points); high C-reactive protein (CRP) (2 points); high white cell count (WCC) (1 point); positive chest X-ray (ground glass (3 points) or pneumonia (2 points)); D-dimer >0.25 (2 points); and any diabetic emergency (hyper- or hypoglycaemia) (2 points). The study excluded any non-C19-related deaths, i.e. an incidental positive C19 finding in a patient who died from injuries sustained in a motor vehicle accident.
Data sources and outcome measures
An electronic data collection tool was devised (this consisted of a Google form which converted the data into an Excel (Microsoft, USA) spreadsheet) and a pilot study was conducted on 54 files of patients who died in August 2020 to validate the data collection tool and ensure that the study objectives were met. The data were gathered from paper-based records and then captured electronically by the two principal investigators. A crude fatality rate for each wave was calculated using admission data of patients who were admitted to WWH with C19 disease during each wave. A case fatality rate per wave was calculated using positive PCR test results from the National Health Laboratory Service at WWH. Further analysis was conducted on the baseline characteristics, comorbidities, clinical presentation, and management of patients across all three waves. Race was recorded on admission as identified by patients, or for those who were too ill to communicate or dead on arrival, race was reported by the attending medical doctor and captured on the admission clerking tool. The admitting medical doctor described the radiological changes evident on chest radiograph, and these findings were confirmed by the consulting family physician, as no radiologist was available at the facility.
Quantitative variables and statistical methods
Descriptive statistics were used to summarise the data. Frequencies and percentages were used for categorical data such as gender, ethnicity, and comorbidities. Frequency distributions of numeric variables were examined for normality and mean (standard deviation (SD)) or median (interquartile range (IQR)) were used as appropriate. Odds ratios (ORs), 95% confidence intervals (CIs) and p-values were reported. P<0.05 was considered statistically significant. Stata version 17 (StataCorp, USA) was used in the analysis. Analysis was done to determine whether the continuous variables differed significantly across the three waves. This was done using either ANOVA or Kruskal-Wallis tests.
Patients and public involvement
Patients and the public did not personally take part in this research owing to the retrospective, observational nature of the study. Ethical clearance was obtained from the Biomedical Research Ethics Committee of the University of KwaZulu-Natal (ref. no. BREC/00003680/2021) and the National Health Research Database NHRD (ref. no. KZ_202201_003). Additionally, institutional ethical clearance was received from the Wentworth Hospital Ethics Committee.
Results
Participant and mortality data
Of the 311 total patients who died within the defined waves, 59 (19.0%) died in wave one, 189 (60.8%) died in wave two and 63 (20.3%) died in wave three. During the first three waves, 354, 573 and 517 patients, respectively, were admitted to WWH with C19 infection, yielding crude fatality rates (institutional C19 deaths/institutional C19 admissions) of 16.7%, 33.0% and 12.2% for waves one, and two and three, respectively (appendix 1: https://www.samedical.org/file/2152). Over these defined periods, 408, 684 and 994 patients, respectively, tested positive for C19 using the PCR test, yielding an institutional case fatality rate (institutional C19 deaths/institutional C19 positive PCR swabs) of 14.5%, 27.6% and 6.3% for waves one, and two and three, respectively.
Descriptive data
Retrospective descriptive analysis was conducted on the files of 311 patients whose dates of death fell into the specified waves of infection. This included 11 patients who were 'dead on arrival' (DOA) and 28 patients who 'died within a few hours of admission'.
Background characteristics
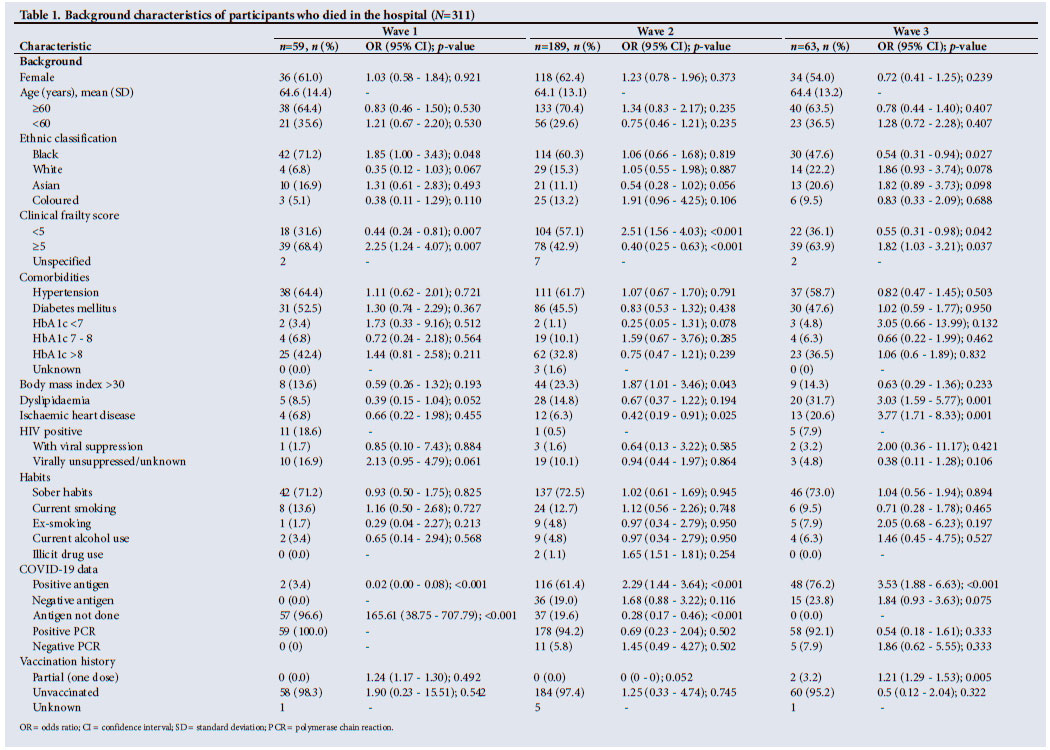
Across the three waves, most patients were female and aged >60 years (Table 1). Black African individuals constituted most deaths across all three waves; however, they contributed significantly less to the total population during the third wave (OR 0.54; 95% CI 0.31 - 0.94; p=0.027). White patients made up a significantly smaller proportion of deaths during the first wave (OR 0.35; 95% CI 0.12 - 1.03; p=0.067) compared with the second and third waves. Patients were more likely to have clinical frailty scores <5 in the second wave (OR 2.51; 95% CI 1.56 - 4.03; p<0.001) compared with the other two waves, indicating better premorbid functioning of those who died in wave two. Contrastingly, patients were more likely to have clinical frailty scores >5 in the first wave (OR 2.25; 95% CI 1.24 - 4.07; p=0.007) and third wave (OR 1.82; 95% CI 1.03 - 3.21; p=0.037) compared with the second wave, indicating lower level of premorbid function in these patients.
Hypertension and diabetes mellitus were present in a similar proportion of patients across all three waves. Most patients with diabetes mellitus across all three waves had an HBA1c >8%. Although poorly reported, obesity was most prevalent in the second wave (OR 1.87; 95% CI 1.01 - 3.46; p=0.043) compared with the other two waves. Dyslipidaemia (OR 3.03; 95% CI 1.59 - 5.77; p=0.001) and ischaemic heart disease (IHD) (OR 3.77; 95% CI 1.71 - 8.33; p=0.001) were most prevalent during the third wave. IHD was least prevalent during the second wave (OR 0.42; 95% CI 0.19 - 0.91; p=0.025) compared with the other two waves. HIV-positive patients with unsuppressed viral loads were most common in the first wave (OR 2.13; 95% CI 0.95 - 4.79; p=0.061) compared with the other two waves. Most patients reported sober habits, with current smoking being the most frequently reported social habit across all three waves. Antigen testing was introduced at WWH towards the end of the first wave. The rapid antigen test yielded positive results in 61.4% and 76.2% of patients who fit the inclusion criteria during the second and third waves, respectively. Most positive antigen tests were found during the third wave (OR 3.53; 95% CI 1.88 - 6.63; p<0.001). The PCR test was positive in all patients during the first wave, 178 (94.2%) patients during the second wave and 58 (92.1%) patients during the third wave. None of the patients were fully vaccinated.
Clinical presentation
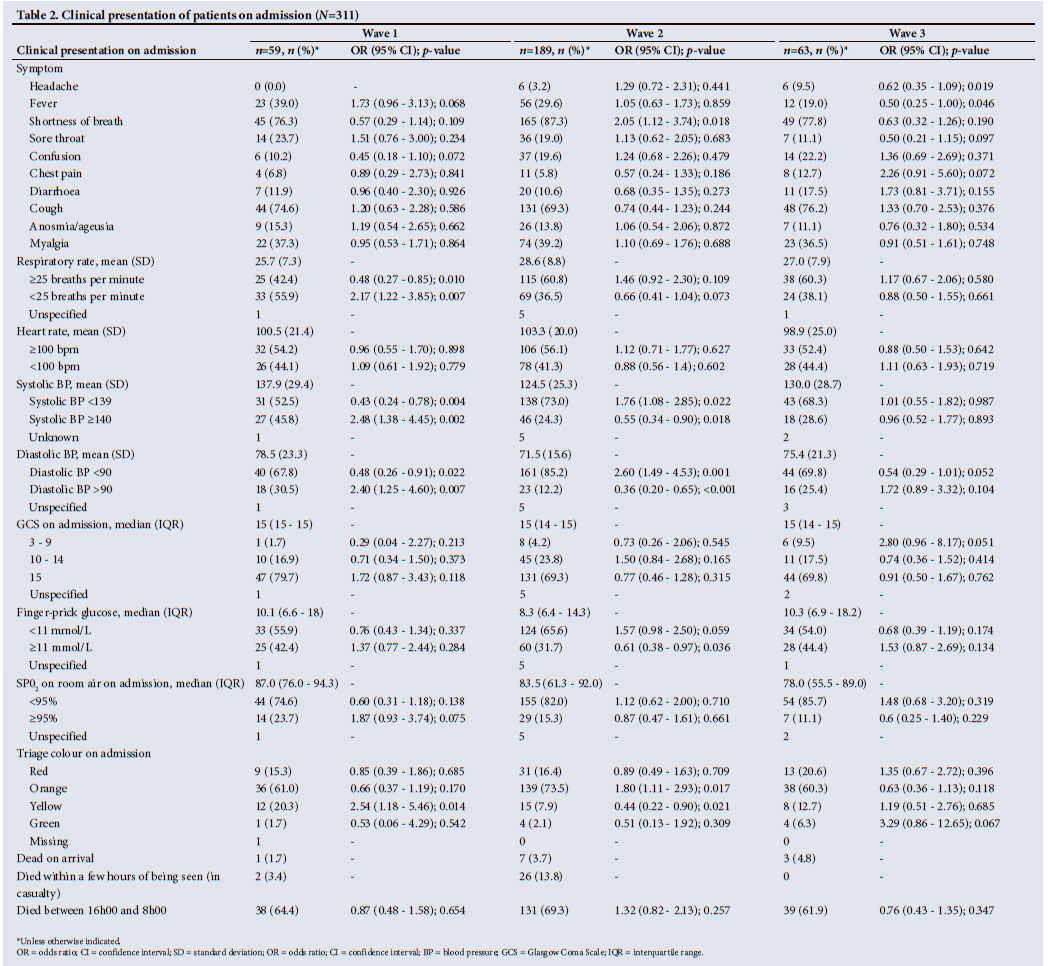
The most frequent presenting symptom across all three waves was shortness of breath, which was most prevalent during the second wave (OR 2.05; 95% CI 1.12 - 3.74; p=0.018) (Table 2). Headache (OR 0.62; 95% CI 0.35 - 1.09; p=0.019) and fever (OR 0.50; 95% CI 0.25 - 1.00; p=0.046) were significantly less prevalent in the third wave compared with the first and second waves. Tachypnoea (respiratory rate >25 breaths per minute) was considerably less prevalent in patients on admission in the first wave (OR 0.48; 95% CI 0.27 - 0.85; p=0.010) compared with the second and third waves. Tachycardia (heart rate of >100 bpm) was present in just over 50% of the patients across all three waves. A systolic blood pressure <139 mmHg (OR 1.76; 95% CI 1.08 - 2.85; p=0.022) and a diastolic blood pressure <90 mmHg (OR 2.6; 95% CI 1.49 - 4.53; p-value 0.001) were more common in the second wave. Most patients across all three waves had a normal Glasgow Coma Score on admission. Patients in the second wave were least likely to have a high finger prick glucose >11 mmol/L (OR 0.61; 95% CI 0.38 - 0.97; p=0.036) compared with the first and third waves. Most patients had <95% oxygen saturation on admission across all three waves. There were significantly more 'orange codes' present during the second wave (OR 1.80; 95% CI 1.11 - 2.93; p=0.017), and more 'yellow codes' present during the first wave (OR 2.54; 95% CI 1.18 - 5.46; p=0.014), as per the validated SA Triage Scale,[12] which categorises patients into red (emergency), orange (urgent), yellow (semi-urgent), green (not urgent) or blue (dead), based on various criteria. The highest proportion of patients who were DOA was during the third wave (n=3; 4.8%); however, the greatest proportion of patients to die within a few hours of being seen in casualty (before admission) was during the second wave (n=26; 13.8%). Most patients died outside of standard working hours (between 16h00 and 8h00) across all three waves.
Investigations
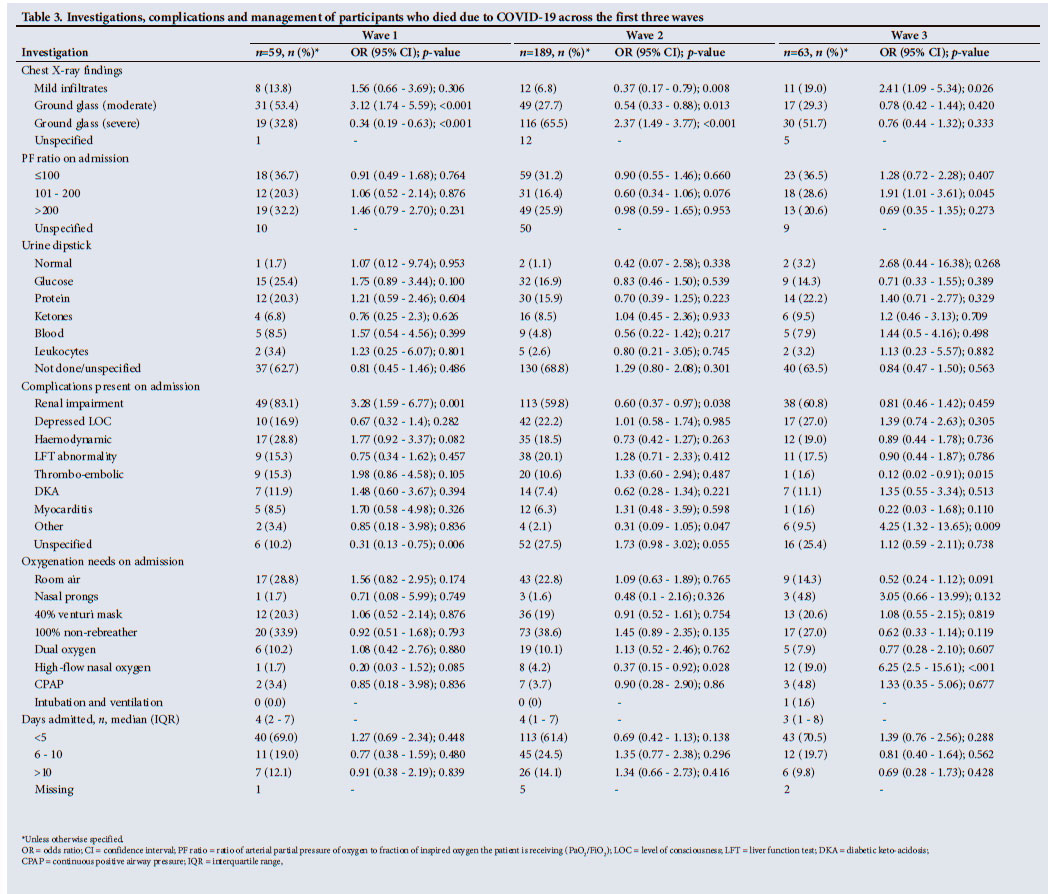
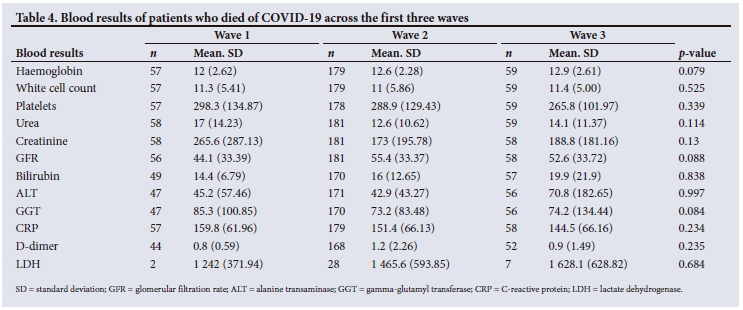
Mild infiltrates on chest radiograph appeared to be more frequent during the third wave (OR 2.41; 95% CI 1.09 - 5.34; p=0.026) compared with the first and second wave, moderate ground glass appearance was most common during the first wave (OR 3.12; 95% CI 1.74 - 5.59; p<0.001) compared with the other two waves, and severe ground glass appearance to be most common during the second wave (OR 2.37; 95% CI 1.49 3.77; p<0.001) compared with the other two waves (Table 3). The ratio of arterial partial pressure of oxygen to fraction of inspired oxygen the patient is receiving (PaO2/FiO2) (PF ratio) was most commonly <100 on admission across all three waves, indicating severe respiratory distress of patients on admission. More patients in wave three (OR 1.91; 95% CI 1.01 - 3.61; p=0.045) had a PF ratio between 100 and 200, compared with waves one and two. There were no significant differences in urine dipstick findings across the three waves. There were no statistically significant differences in blood results across the three waves; however, urea and creatinine were highest during the first wave, with the corresponding lowest glomerular filtration rate during the first wave (Table 4). D-dimer was highest in patients during the first wave. CRP and lactate dehydrogenase (LDH) were similarly elevated across all three waves.
Complications
Renal impairment was most common during the first wave (OR 3.28; 95% CI 1.59 - 6.77; p=0.001) and least common during the second wave (OR 0.6; 95% CI 0.37 - 0.97; p=0.038). Patients with 'no specified complications' documented were less frequent during the first wave (OR 0.31; 95% CI 0.13 - 0.75; p=0.006) compared with the other two waves. Thromboembolic phenomena were significantly less common during wave three (OR 0.12; 95% CI 0.02 - 0.91; p=0.015). 'Other' complications not described in this study were more common during the third wave (OR 4.25; 95% CI 1.32 - 13.65; p=0.009).
Management
The 100% non-rebreather mask was the most common oxygen requirement on admission for patients across all three waves (Table 3). High-flow nasal oxygen (HFNO) was most commonly used during the third wave (OR 6.25; 95% CI 2.5 - 15.61; p<0.001) compared with the other two waves. The average duration of admissions before death were 4, 4 and 3 days during the first, second and third waves, respectively.
Discussion
Main findings
The study compares mortality trends between the first three waves of C19 at a DH. The institutional crude and case fatality rates in wave two were the highest, highlighting increased mortality rates in wave two and increased virulence of the Beta variant.
Across the three waves, females aged >60 years were identified as most likely to die from C19. Mortality was most prevalent in black Africans across all three waves, particularly during the first wave. White, Asian and coloured patients contributed to more deaths during the second and third waves. Patients who died during the second wave had lower clinical frailty scores[9] than during the first and third waves. Hypertension had a similar prevalence across the first three waves. Diabetes mellitus and HIV were less prevalent during the second wave. Obesity was most prevalent during the second wave, and dyslipidaemia and IHD were most prevalent during the third wave. No patients were 'vaccinated fully,' defined as receiving initial and booster doses.
Shortness of breath was the most common presenting symptom across all three waves; however, it was approximately 10% more common in the second wave. Headache and myalgia were also more common features of the second wave. Fever, sore throat and loss of taste and smell were more common in the first wave. Confusion, chest pain and diarrhoea were more common features of the third wave. The second and third waves saw more severe consolidation on chest X-rays than the first wave. Approximately 80% - 90% of patients across all three waves required oxygen on admission. Elevated serum urea, creatinine, D-dimer and LDH levels were the most significant serological findings. Most patients died outside of regular working hours, likely due to understaffing of doctors (particularly senior specialist doctors), nurses, radiographers, laboratory technicians and other allied workers during these hours.
Comparison with other studies
The second wave was dominated by the Beta variant (501Y.V2 or B.1.351) and was characterised by rapid spread, as well as higher infection rates, admissions and mortality rates than the first wave.[13] The Beta strain of SARS-CoV-2 was first identified in SA in late 2020. It developed multiple mutations in its proteins, making the virus more virulent (increased infectivity and decreased neutralisation by existing vaccines).[14] The high crude and case fatality rates in the second wave may be due to increased virulence of the Beta variant, lack of vaccination among patients and the overburdened hospital and healthcare workers. These results are similar to those published by the NICD, which stated that 'compared with wave 1, there was an increased risk of mortality in wave 2 (adjusted OR 1.5; 95% CI 1.4 - 1.5) and wave 3 (adjusted OR 1.3, 95% CI 1.3 - 1.4).'[13] The Hospital Surveillance Report by the NICD estimated an overall facility case fatality rate of 22.5% across all four C19 waves in SA. Data published by the NICD - conducted on 666 facilities across the nine provinces of SA - concluded that factors associated with in-hospital mortality were older age and being of black African/ mixed/Indian race compared with white. Presence of comorbid hypertension, diabetes mellitus, chronic cardiac disease, chronic renal disease, malignancy, HIV, past and current tuberculosis, and obesity were also factors associated with mortality.[15]
Older age is widely documented as a risk factor for C19 death; however, a systematic review and meta-analysis conducted by Parohan et al[16] identified male sex as a risk factor for mortality (pooled OR 1.5; 95% CI 1.06 - 2.12). The increased mortality rate found in females in our study may be attributed to sex-based differences in access to healthcare across SA, with females forming a vulnerable part of the community and therefore presenting later and with more advanced disease progression. A recent intersectional analysis conducted in SA, Malawi and Nigeria reported a statistically significant decline in women's ability to see a healthcare provider during the pandemic but did not find this decline among men. This sex gap was more evident in those who did not have post-secondary education. SA women financially affected by the pandemic had a significant decline in seeking preventive care during the pandemic (OR 0.23, p=0.022).[17] As per the 2016 National Census, the population of KZN consists of 52.1% females and 47.9% males, with a larger proportion of females (62.30%) contributing to the age group >60 years compared with males.[18]Furthermore, Nglazi et al.[19] determined that 60% of women of childbearing age were overweight, and 35.2% were clinically obese. This could account for the gender differences seen in our study. The variation in mortality among racial groups could be attributed to race being an important determinant of health in SA. Historical differences in socioeconomic status and housing conditions render the black population in SA more vulnerable during a droplet-spread pandemic. Some further explanations for higher transmission rates and mortality in the black population include multigenerational households with more persons per area, decreased access to healthcare and decreased access to public health messaging regarding prevention, diagnosis, and treatment, resulting in delayed presentation.[19] Additionally, as stated by Mash et al.[8] 'poverty is also a major issue that impacts on access to healthcare as well as food security and malnutrition.' During the initial months of the pandemic, strict nationwide lockdown was implemented, resulting in a great deal of uncertainty regarding resumption of work and thus remuneration, leading to further financial strain and barriers to accessing healthcare services. The decreased prevalence of comorbidities during the second wave could indicate an increased virulence of the SARS-CoV-2 Beta strain. However, Parohan et al.[16] suggest that the reduced prevalence of comorbidities in the second wave could also be due to differences in clinician practice, survival bias or changing manifestations in individuals without underlying illness, or simply due to underreporting of comorbidities and other medical conditions at the peak of the second wave when hospitals were overburdened and understaffed. The higher prevalence of IHD in the third wave may be a combination of underlying cardiac disease and the cardiac effects of the Delta variant.[20-22] SARS-CoV-2 causes many cardiovascular disorders, including direct myocardial injury, arrhythmia, acute coronary syndrome, and venous thromboembolism. The higher incidence of chest pain in the third wave may be directly linked to the higher incidence of IHD in this wave.[22]
There was a lack of data regarding antigen testing, as this method of detecting C19 was only introduced at WWH during the second wave. Despite this, availability of the antigen test during waves two and three contributed significantly to the earlier detection of C19 infection, allowing for earlier directed clinical management and more effective quarantining protocols. SA's national vaccine rollout strategy commenced on 17 February 2021, only available to healthcare workers.[23] The first vaccine became available to people aged >60 on 17 May 2021, and available to those aged 50 - 59 years on 5 July 2021. Booster doses only became available on 10 November 2021. The relatively late implementation of a nationwide vaccination rollout strategy and poor help-seeking behaviour of patients eligible to receive the vaccine are likely to have had a pronounced effect on mortality rates - particularly in the first two waves. The initial lag in vaccination programme uptake could be attributed to stigmas and fears surrounding the vaccination and its side-effects.[23]
A study conducted in India revealed that shortness of breath increased by 6% from the first to the second wave.'241 This resulted in an increased demand for oxygen support and mechanical ventilation, and a subsequent mortality increase. Conflicting data from a study in Italy showed an increased incidence of early dyspnoea in the first wave compared with the second wave (13.4% v. 1.9%).[25] Differences in our findings may be explained by the fact that many of our patients presented late to health facilities due to socioeconomic challenges, fears of exposure to C19 and hypoxic unawareness,[26] which may account for the high death rate on arrival or shortly after the presentation to the facility.
Approximately 80% of C19 cases develop a mild fever, headache, sore throat and myalgia, and 15% develop severe disease characterised by dyspnoea, hypoxia and chest X-ray changes.[27] Only 5% become critically ill with acute respiratory distress syndrome (ARDS), shock and multiorgan failure. Because our patients consisted only of those who died from C19 infection, dyspnoea was the most common symptom of severity. Similarly, Portacci et al.[25] found a higher incidence of ageusia and fever in Italy's first wave of the SARS-CoV-2 epidemic. Headache and myalgia were found by Kumar et al.[24] to be more common in the second wave in patients in India. It is proposed that SARS-CoV-2 causes gastrointestinal symptoms by direct viral invasion and immune-mediated tissue injury.[27,28] Specific viral protein mutations in the Delta variant cause an increased binding affinity of the virus to ACE-2 receptors in both type 2 alveolar cells and epithelial cells throughout the gastrointestinal tract. This may be the mechanism behind the higher incidence of diarrhoea in the third wave; however, improved symptom reporting may also significantly contribute to such a finding.[28]
A cohort study conducted in Italy, describing the computed tomography chest findings of 461 patients across all four waves, found bilateral pulmonary disease in 100% of evaluated patients.[29] Typical patterns observed included 'ground glass' appearance, consolidation and subpleural and parenchymal bands. They found ground glass appearance to be the predominant pattern during the second (91.6%) and third (100%) waves. Furthermore, they found pleural effusions to be more prevalent during the first wave (41.4%) compared with the second (20.4%) and third waves (32.8%).[29] Pleural effusion was not commonly reported in our study. Oxygen requirements were similar across all three waves; however, WWH was better equipped with advanced oxygenation devices during the second and third waves to accommodate these increased oxygen requirements. After the first wave, WWH acquired many HFNO and continuous positive airway pressure (CPAP) machines, allowing patients to be treated at WWH. The acquisition of CPAP and HFNO devices at WWH was vital in the survival of patients, and positively impacted ARDS management during the second and third waves. Additionally, doctors' clinical knowledge and experience of C19 disease improved after the first wave, allowing for more prompt identification of ARDS and other C19-related complications, and better management of patients. The higher mortality rate seen during the second wave may be attributed to the overwhelmed healthcare system, shortage of healthcare workers, poor health literacy and misinformation surrounding the pandemic circulating on social media.
The cause of the renal impairment seen in patients in wave one was not well established. It may be a combination of acute kidney injury (AKI), underlying chronic kidney disease and acute -on-chronic kidney disease. A systematic review and meta-analysis of 31 studies found an overall AKI incidence of 26% in C19-infected patients.[30] The incidence was significantly higher in patients with concomitant ARDS (59%) compared with those without ARDS (6%). Mortality in C19 patients with AKI was also significantly higher than in those without AKI (risk ratio 4.46; 95% CI 3.31 - 6.00).[30] The potential mechanisms for kidney injury in C19 disease include cytokine-induced damage, systemic effects (including deranged fluid balance status, haemodynamic instability, rhabdomyolysis, metabolic acidosis and hyperkalaemia), as well as 'organ crosstalk', which denotes lung-kidney bidirectional damage as a result of cytokine overproduction.[31] Risk factors for the development of AKI include older age and comorbidities such as diabetes mellitus and hypertension, which contribute to underlying CKD and kidney vulnerability.[27,30] This may explain why the incidence of renal impairment was highest in the first wave, where the incidence of comorbidities (especially diabetes mellitus) was also the highest.
Elevated D-dimers are in keeping with the prothrombotic state demonstrated in critically ill C19 patients.[32] Despite the fact that platelet numbers remained normal across all three waves in our study, Zhang et al.[32] showed that patients with C19 have increased mean platelet volume and hyperactivity, with an associated decrease in overall platelet count. They showed that SARS-CoV-2 directly enhances platelet activation and facilitates the release of coagulation and inflammatory factors, promoting the formation of leukocyte-platelet aggregates and thereby enhancing thrombus formation.[32] Elevated LDH levels found across all three waves are likely the result of the direct effects of C19 on the liver, which is facilitated by the ACE-2 receptors in cholangiocytes, allowing for the retrograde transmission of the virus from the bile tree cells into the liver.[28] Furthermore, indirect causes of liver damage may result from certain drugs and the release of pro-inflammatory cytokines, causing tissue hypoxia and thrombosis, and thereby exacerbating underlying liver injury. Mild to moderate elevation of aminotransferases is a common finding, but severe liver injury is rare.[28]
Several studies looking at the knowledge, attitudes and practices (KAP) of healthcare workers during the C19 pandemic showed a general willingness to engage in correct SARS-CoV-2 infection prevention and control practices, commitment to C19 patient care, adequate knowledge related to C19 and good practices towards treating C19 disease.[33,34] No studies to our knowledge, however, compare healthcare workers' KAP between the different defined waves of C19 infection. One of the authors of our study oversaw the task team responsible for managing patients with C19 at WWH, where the behaviours and attitudes of the team members were noted to be dedicated, brave and in line with National Department of Health guidelines, which were updated regularly during the three waves of infection.
Although not a major focus of our study, mention must be made of the updates to treatment guidelines of C19 that occurred during the course of our study. During the first wave of infection, local protocols recommended the use of oxygen, therapeutic enoxaparin sodium (1 mg/kg 12-hourly subcutaneously), dexamethasone, vitamins C/D/B3, thiamine, zinc and ceftriaxone/azithromycin for secondary pneumonias.[34] Drug treatment during the second wave included dexamethasone, vitamin D, ceftriaxone/azithromycin if bacterial pneumonia was suspected, and therapeutic doses of enoxaparin sodium for all patients requiring high-intensity oxygen or with a D-dimer >1.5. This was based on recommendations from an early study conducted at a tertiary hospital in Cape Town.[1] By the third wave, this recommendation changed to indicate that only patients with clinical evidence of a venous thromboembolism/pulmonary embolism should be treated with therapeutic doses of enoxaparin sodium (all other patients were advised to be treated with prophylactic doses: 40 mg daily subcutaneously). Dexamethasone was limited to 10 days, and ceftriaxone/azithromycin remained recommended for secondary bacterial pneumonias. The SARS-CoV-2 vaccination became available in the third wave; however, in our study only 3.2% of patients in the third wave were vaccinated, likely not acting as a confounding factor. Regular training sessions were held at WWH throughout the period of our study. These were mostly conducted by senior clinicians from WWH as well as the tertiary facilities that supported WWH. Furthermore, regular audits were conducted on C19 management and outcomes. Therefore, despite minor changes in management protocols (based on global evidence-based research), patient quality of care remained constant across all three waves.
Perhaps the greatest influence on patient outcome across the three waves was patients' access to services. The influx of critically ill patients, particularly during the first and second waves, put pressure on services such as HFNO, CPAP and advanced ventilation -most of which were not available at WWH in the first wave. During the peak of the second wave, patients at WWH had limited access to functional HFNO and CPAP devices, but monitoring of these patients was a major problem, as the quality and availability of nursing and medical staff was compromised owing to staff being ill and not having the requisite competencies in managing critically ill ICU-level patients in a resource-limited DH setting. These patients required referral to an ICU facility at our referral hospital, for which there were long waiting lists.
Study strengths and limitations
Strengths of the study include the provision of a detailed comparison of the mortality rates, as well as the demographic and clinical profiles, of patients who died from C19, across the first three waves of the pandemic in a LMIC. Furthermore, we provide generalisable insights into the challenges faced by an overburdened, under-resourced primary healthcare facility in a LMIC.
Limitations of the study include paucity of some data due to a reliance on paper-based clinical records, which may have contributed to the under-reporting of certain findings. Of note is that obesity was under-reported in our study owing to poor documentation in clinical records, likely due to difficulties experienced by healthcare workers in weighing ill and immobile patients. Regardless, all patients with a documented weight had a body mass index >30, indicating a relatively high prevalence of this comorbidity. Furthermore, there is a possibility that false-positive C19 cases were included in the study owing to the clinical probability tool being used as an adjunct to the PCR test. Lastly, genomic sequencing was not done on patients to confirm infection with a specific C19 variant. However, each of the three waves included in this study had a predominant variant as described by multiple national epidemiological studies, which allowed for assumptions to be made about the dominant variant responsible for each defined wave of infection.
Conclusion
The Beta variant, which characterised the second wave, was the most virulent, as portrayed by the highest case and crude fatality rates found during this wave, as well as the characteristics of its victims: individuals with lower clinical frailty scores, fewer comorbidities and more severe clinical presentations. Our study provides an extensive analysis of mortality data across the first three waves of the C19 pandemic at a district-level hospital in SA. The crude and case fatality findings are similar to those seen in other facilities locally and internationally. Risk factors for severe disease and death are identical to those reported elsewhere. Our study provides essential information on the additional burden placed by C19 on a resource-constrained environment. This information could assist in the development of healthcare responses for similar healthcare facilities across the world. Recommendations include the development of an electronic record-keeping system, as well as further research into the wider socioeconomic impacts of C19 on health facilities across SA.
Declaration. This article was written in partial academic fulfilment of OH's MMedSci degree.
Acknowledgements. None.
Author contributions. OH designed the study. MN designed the data collection tool. OH and CP performed the study and collected the data. OH and CP performed the data analysis with the help of biostatisticians (Ms Cathy Connolly of the University of KZN and Dr Gill Hendry), and wrote the first draft. MN assisted with editing of the final article. OH and CP are responsible for the overall content as guarantors. The corresponding author attests that all listed authors meet authorship criteria and that no others meeting the criteria have been omitted.
Funding. None.
Conflicts of interest. None.
References
1. Mendelson M, Boloko L, Boutall A, et al. Clinical management of COVID-19: Experiences of the COVID-19 epidemic from Groote Schuur Hospital, Cape Town, South Africa. S Afr Med J 2020;110(10):973-981. https://doi.org/10.7196/SAMJ.2020.v110i10.15157 [ Links ]
2. Ejaz H, Alsrhani A, Zafar A, et al. Covid-19 and comorbidities: Deleterious impact on infected patients. J Infect Pub Health 2020;13(12):1833-1839. https://doi.org/10.1016/j.jiph.2020.07.014 [ Links ]
3. Pillay-van Wyk V, Bradshaw D, Groenewald P. COVID deaths in South Africa: 99 days since South Africa's first death. S Afr Med J 2020;110(11):1093. https://doi.org/10.7196/samj.2020.v110i11.15249 [ Links ]
4. Jassat W, Cohen C, Tempia S, et al. Risk factors for COVID-19-related in-hospital mortality in a high HIV and tuberculosis prevalence setting in South Africa: A cohort study. Lancet HIV 2021;8(9):e554-e567. https://doi.org/10.1016/S2352-3018(21)00151-X [ Links ]
5. Jassat W, Abdool Karim SS, Mudara C, et al. Clinical severity of COVID-19 in patients admitted to hospital during the Omicron Wave in South Africa: A retrospective observational study. Lancet Glob Health 2022;10(7):e961-e969. https://doi.org/10.1016/s2214-109x(22)00114-0 [ Links ]
6. Arnold-Day C, van Zyl-Smit RN, Joubert IA, et al. Outcomes of patients with COVID-19 acute respiratory distress syndrome requiring invasive mechanical ventilation admitted to an intensive care unit in South Africa. S Afr Med J 2021;27-33. https://doi.org/10.7196/samj.2022.v112i1.16115 [ Links ]
7. Nunes MC, Bailie VL, Kwatra G, et al. Severe acute respiratory syndrome coronavirus 2 infection among healthcare workers in South Africa: A longitudinal cohort study. Clin Infect Dis 2021;73(10):1896-1900. https://doi.org/10.1093/cid/ciab398 [ Links ]
8. Mash RJ, Presence-Vollenhoven M, Adeniji A, et al. Evaluation of patient characteristics, management and outcomes for COVID-19 at district hospitals in the Western Cape, South Africa: Descriptive observational study. BMJ Open 2021;11(1). https://doi.org/10.1136/bmjopen-2020-047016 [ Links ]
9. Church S, Rogers E, Rockwood K, Theou O. A scoping review of the clinical frailty scale. BMC Geriatr 2020;20(1). https://doi.org/10.1186/s12877-020-01801-7 [ Links ]
10. KwaZulu-Natal Department of Health. Referral system - levels of care. KZN Health. https://www.kznhealth.gov.za/Referral-system.h (accessed 3 January 2023). [ Links ]
11. National Institute for Communicable Diseases. Proposed definition of COVID-19 wave in South Africa. Pretoria: NICD, 2021. https://www.nicd.ac.za/wp-content/uploads/2021/11/Proposed-definition-of-COVID-19-wave-in-South-Africa.pdf (accesed 16 September 2022). [ Links ]
12. The South African Triage Scale (SATS). Emergency Medicine Society of South Africa, 2019. https://emssa.org.za/special-interest-groups/the-south-african-triage-scale-sats/ (accessed 11 March 2023). [ Links ]
13. Bekker L-G, Ntusi NA. Lessons from two SARS-COV-2 waves in South Africa. Lancet Glob Health 2021;9(9):e1177-e1178. https://doi.org/10.1016/s2214-109x(21)00313-2 [ Links ]
14. Forchette L, Sebastian W, Liu T. A comprehensive review of COVID-19 virology, vaccines, variants, and therapeutics. Curr Med Sci 2021;41(6):1037-1051. https://doi.org/10.1007/s11596-021-2395-1 [ Links ]
15. National Institute for Communicable Diseases. Covid-19 Hospital Surveillance Update: Week 22, 2022. Pretoria: NICD, 2022. https://www.nicd.ac.za/wp-content/uploads/2022/06/NICD-COVID-19-Weekly-Sentinel-Hospital-Surveilance-update-Week-22-2022.pdf (accessed 10 March 2022). [ Links ]
16. Parohan M, Yaghoubi S, Seraji A, Javanbakht MH, Sarraf P, Djalali M. Risk factors for mortality in patients with coronavirus disease 2019 (COVID-19) infection: A systematic review and meta-analysis of observational studies. The Aging Male 2020;23(5):1416-1424. https://doi.org/10.1080/13685538.2020.1774748 [ Links ]
17. Abdalla S, Katz EG, Hartley A, Darmstadt GL. Gender and the impact of covid-19 on demand for and access to health care: Intersectional analysis of before-and-after data from Kenya, Nigeria, and South Africa. J Glob Health 2022:12. https://doi.org/10.7189/jogh.12.05024 [ Links ]
18. Statistics South Africa. Census 2016. Pretoria: Stats SA, 2016. http://cs2016.statssa.gov.za/ (accessed 14 March 2023). [ Links ]
19. Nglazi MD, Ataguba JE-O. Overweight and obesity in non-pregnant women of childbearing age in South Africa: Subgroup regression analyses of survey data from 1998 to 2017. BMC Pub Health 2022;22(1):395. https://doi.org/10.1186/s12889-022-12601-6 [ Links ]
20. Navaratnam AV, Gray WK, Day J, Wendon J, Briggs TW. Patient factors and temporal trends associated with COVID-19 in-hospital mortality in England: An observational study using administrative data. Lancet Respir Med 2021;9(4):397-406. https://doi.org/10.1016/s2213-2600(20)30579-8 [ Links ]
21. Nalbandian A, Sehgal K, Gupta A, et al. Post-acute COVID-19 syndrome. Nature Med 2021;27(4):601-615. https://doi.org/10.1038/s41591-021-01283-z [ Links ]
22. Cenko E, Badimon L, Bugiardini R, et al. Cardiovascular disease and COVID-19: A consensus paper from the ESC Working Group on Coronary Pathophysiology and Microcirculation, ESC Working Group on thrombosis and the Association for Acute Cardiovascular Care (ACVC), in collaboration with the European Heart Rhythm Association (EHRA). Cardiovasc Res 2021;117(14):2705-2709. https://doi.org/10.1093/cvr/cvab298 [ Links ]
23. National Department of Health. What does South Africa's COVID vaccine roll-out plan say? Pretoria: NDoH, 2021 https://sacoronavirus.co.za/2021/01/12/what-does-south-africas-covid-vaccine-roll-out-plan-say/ (accessed 12 October 2022). [ Links ]
24. Kumar G, Mukherjee A, Sharma R, et al. Clinical profile of hospitalized COVID-19 patients in first and second wave of the pandemic: Insights from an Indian registry-based observational study. Indian J Med Res 2021;153(5):619. https://doi.org/10.4103/ijmr.ijmr_1628_21 [ Links ]
25. Portacci A, Carpagnano GE, Tummolo MG, et al. Covid-19 clinical phenotypes and short-term outcomes: Differences between the first and the second wave of pandemic in Italy. Expert Rev Respir Med 2021;15(12):1619-1625. https://doi.org/10.1080/17476348.2021.1960824 [ Links ]
26. Bhatnagar S, Sirohiya P, Elavarasi A, et al. Silent hypoxia in coronavirus disease-2019: Is it more dangerous? A retrospective cohort study. Lung India 2022;39(3):247. https://doi.org/10.4103/lungindia.lungindia_601_21 [ Links ]
27. Rahman S, Montero MT, Rowe K, Kirton R, Kunik F. Epidemiology, pathogenesis, clinical presentations, diagnosis and treatment of COVID-19: A review of current evidence. Expert Rev Clin Pharmacol 2021;14(5):601-621. https://doi.org/10.1080/17512433.2021.1902303 [ Links ]
28. Galanopoulos M, Gkeros F, Doukatas A, et al. Covid-19 pandemic: Pathophysiology and manifestations from the gastrointestinal tract. World J Gastroenterol 2020;26(31):4579-4788. https://doi.org/10.3748/wjg.v26.i31.4579 [ Links ]
29. Maggialetti N, Villanova I, Castri A, et al. Covid-19 in Italy: Comparison of CT findings from Time Zero to the Delta variant. Microorganisms 2022;10(4):796. https://doi.org/10.3390/microorganisms10040796 [ Links ]
30. Alenezi FK, Almeshari MA, Mahida R, Bangash MN, Thickett DR, Patel JM. Incidence and risk factors of acute kidney injury in COVID-19 patients with and without acute respiratory distress syndrome (ARDS) during the first wave of COVID-19: A systematic review and meta-analysis. Renal Failure 2021;43(1):1621-1633. https://doi.org/10.1080/0886022x.2021.2011747 [ Links ]
31. Ronco C, Reis T. Kidney involvement in COVID-19 and rationale for extracorporeal therapies. Nat Rev Nephrol 2020;16(6):308-310. https://doi.org/10.1038/s41581-020-0284-7 [ Links ]
32. Zhang S, Liu Y, Wang X, Yang L, Li H, Wang Y, et al. SARS-COV-2 binds platelet ACE2 to enhance thrombosis in COVID-19. J Hematol Oncol 2020 4;13(1). https://doi.org/10.1186/s13045-020-00954-7 [ Links ]
33. Nwagbara U, Osual E, Chireshe R, et al. Correction: Knowledge, attitude, perception, and preventative practices towards COVID-19 in sub-Saharan africa: A scoping review. PLoS ONE 2021;16(6). https://doi.org/10.1371/journal.pone.0253833 [ Links ]
34. Moodley SV, Zungu M, Malotle M, et al. A health worker knowledge, attitudes and practices survey of SARS-COV-2 infection prevention and control in South Africa. BMC Infect Dis 2021;21(1). https://doi.org/10.1186/s12879-021-05812-6 [ Links ]
 Correspondence:
O Hirachund
mishhirachund@gmail.com
Accepted 5 November 2023

