


Services on Demand
Article
 English (pdf)
 Article in xml format
 Article references
Indicators

Related links
-
 Cited by Google
 -
 Similars in Google
Share

 Permalink
SAMJ: South African Medical Journal
On-line version ISSN 2078-5135
Print version ISSN 0256-9574
SAMJ, S. Afr. med. j. vol.114 n.1 Pretoria Jan. 2024
http://dx.doi.org/10.7196/SAMJ.2024.v114i1.862
RESEARCH
Progress towards 90-90-90 and 95-95-95 strategy implementations and HIV positivity trends in the City of Johannesburg
J C Y NyasuluI, II; I MaposaIII
IPhD; Division of Health Systems and Public Health, Department of Global Health, Faculty of Clinical Medicine, Stellenbosch University, Cape Town, South Africa
IIPhD; Health Systems Strengthening, AFRIQUIP, Johannesburg, South Africa
IIIPhD; Division of Epidemiology and Biostatistics, Department of Global Health, Faculty of Clinical Medicine, Stellenbosch University, Cape Town, South Africa
ABSTRACT
BACKGROUND: The 95-95-95 strategy implementation is a positive initiative for moving the HIV tide towards elimination, with a focus on addressing the huge inequalities in existence in access to HIV services
OBJECTIVES: To establish performance towards the 90-90-90 and 95-95-95 targets and trends in HIV positivity rates since strategy implementation rollout in the City of Johannesburg (CoJ), South Africa
METHODS: This was a descriptive study, part of the bigger quasi-experimental study using the monthly District Health Information System during the implementation and rollout of the 90-90-90 strategy. HIV access trends were tracked and compared with the set strategy implementation targets. In addition, the HIV positivity rate was analysed to observe trends. A time trend analysis for aggregated data was performed on all the measured indicators to determine whether the decrease or increase was statistically significant. P<0.05 was used to indicate statistical significance
RESULTS: The study has shown that by March 2022, 15 months after December 2020, CoJ had reached 91-65-88. There were significant steady increases in the number of people who knew their HIV status (slope = 0.044, p<0.001) and initiating on antiretroviral therapy (ART) (slope = 0.001, p<0.001), and significant decreases for overall HIV positivity rate (slope = -0.016, p<0.001), adolescent positivity rate (slope = -0.0087, p<0.001) and antenatal care HIV positivity rate (slope = -0.013, p<0.001
CONCLUSION: This study has established positive progress made by the CoJ towards HIV testing, ART initiation, viral load suppression and HIV positivity rate. On the other hand, gaps in linkage to care after testing positive have been highlighted. It is therefore critical in the 95-95-95 strategy implementation era to focus on finding those missed during the 90-90-90 phase through revised and renewed innovative approaches
Globally by 2020, ~38 million people were living with HIV, and of these, 6.1 million did not know that they were HIV positive.[1] Globally, positive progress has been made towards elimination of HIV through implementation of the 90-90-90 strategy by 2020, which later evolved to the 95-95-95 strategy, meaning that 95% of people living with HIV (PLHIV) should know their HIV status, 95% of people who know their status will be on antiretroviral medication (ARVs) and 95% of all patients receiving antiretroviral therapy (ART) will be virally suppressed by 2025.[2] At the end of 2020, 84% (31.6 million) of HIV-positive individuals globally knew their HIV status, 73% (27.4 million) were on ART and 66% (24.8 million) were virally suppressed. Even though the set targets were missed, this was an outstanding achievement. There are huge inequalities that need to be addressed within subpopulations, including children, young people and men.[1]
In South Africa (SA), ~8.2 million people are HIV positive, with the largest and most high-profile HIV epidemic in the world, accounting for a third of all new HIV infections in southern Africa.[3] By 2018, positive progress was made in SA: of the 8.2 million HIV-positive individuals, 90% knew their status, 68% were initiated on ART and 86% were virally suppressed (90-68-86).[4-6] The City of Johannesburg (CoJ), with 19 other cities and metropolitan areas in SA, joined the global Paris Declaration to Fast-Track Cities, pledging to reach the 90-9090 strategy global targets by 2020.[2,7] The main SA cities have been making good progress towards the 90-90-90: for instance, according to the Thembisa 4.2 model, by 2018 the CoJ was at 87-59.5-84.5.[6]
By 2020 the CoJ strategy implementation data showed an improvement in HIV services uptake even though children have been shown to be less likely to access the services and virally suppress compared with their adult counterparts.[8] This calls for action to prioritise children by creating innovative ways to ensure access to HIV services in CoJ and globally.[9] Evidence has shown that ensuring that those who are HIV positive are initiated on ART and virally suppressed will contain the HIV pandemic and reduce transmission, a move towards HIV elimination.[10,11] In addition, the modelling predictions for reaching these targets by 2020 showed that CoJ would be at 89-72-90, with a decline in positivity rate.[6] However, since we are now long past 2020, it is important to document the actual CoJ performance towards reaching the 90-90-90 targets. Therefore, this article aims to establish performance towards the 90-90-90 targets and trends in HIV positivity rates since strategy implementation rollout in the CoJ.
Methodology
Study design
This is part of the larger quasi-experimental study that aims to establish the impact of the implementation of the 90-90-90 strategy on HIV testing, ART initiation, retention in care and viral suppression among PLWH in the CoJ. The main study aims to establish the processes involved in implementation of the 90-90-90 strategy and the impact it has on access to HIV services in the hub of the CoJ. This article focuses on the progress towards achieving the 95-9595 strategy implementation targets and HIV positivity rate trends for the CoJ over time. We used the SA District Health Information System (DHIS) monthly performance database between April 2016 and March 2022 to establish progress around HIV testing, ART initiation, ART retention and HIV positivity rates across the different age groups in the CoJ. To strengthen the internal validity of the study, other factors that would affect access to HIV services over the study period are explored and explained.
Study setting and participants
The study was conducted in the CoJ, Gauteng Province, SA, which has a population of ~5.6 million, accounting for ~10% of the national population. The CoJ is a metropolitan district with seven subdistricts, namely A, B, C, D, E, F.[12] We included all individuals recorded on the DHIS database who tested positive for HIV, initiated on ART and remained on ART between April 2016 and March 2022 in the CoJ. In line with the DHIS age categories, the cut-off point for children and adults was <15 years.
The 90-90-90 strategy intervention
SA introduced the 90-90-90 strategy implementation concept in mid-2015, and the CoJ started implementation in January 2016. The district implementation plan was developed with focus on four HIV cascade pillars, namely: (i) prevention; (ii) case identification; (iii) treatment initiation; and (iv) retention and success of treatment. The district strategy implementation plan set targets and means of tracking progress, and those indicators performing below target were described, together with their root causes. Activities were proposed to address the gaps in the 90-90-90 district strategy implementation plan (DIP). Responsible personnel and the measures required to track progress were identified.[13]
Data collection and outcome measures
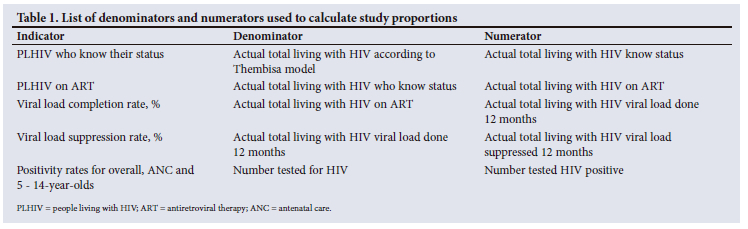
A data extraction tool was designed to solicit DHIS database information on all who tested for HIV, initiated on ART and were virally suppressed from April 2016 to March 2022 (74 months). In this study, our outcome measures included proportions of individuals who tested for HIV, initiated on ART and were virally suppressed during the study period. To generate these outcome measures, the following denominators and numerators were used (Table 1).
Table 1 highlights how the proportions were calculated. To estimate the number of people living with HIV in the district, we applied the Thembisa Model version 4.2. The Thembisa model is a mathematical model that has been developed to simulate the population-level impact of different HIV interventions in SA.[14] The positivity rate calculated in this study is not incidence, as some individuals may have been positive for years and decided to test at this point in time. Because we used public health system databases, we encountered missing data, and efforts were made to compare with database sources to ensure database completeness and address potential bias.
Statistical analysis
Data were prepared in Excel 2010 (Microsoft, USA), and a descriptive analysis was carried out to establish trends in HIV testing, ART initiation, viral load suppression and HIV positivity rate. These HIV access trends were tracked and compared with the set target, and the HIV positivity rate was analysed to measure whether there was an increase or decrease over the study period. To calculate the positivity proportion, we used the total number of those who tested for HIV each year as a denominator, and those who tested HIV-positive as a numerator. In addition, a time trend analysis for aggregated data was performed to ascertain significance of the increasing or decreasing trends in the tracked indicators. To indicate statistical significance levels, p<0.05 was used.
Ethical considerations
Ethics approvals to conduct this study was sought from the University of the Witwatersrand Human Ethics Committee ref. no. N22/06/067_ RECIP_WITS_M1806040. In addition, permission to use the CoJ ART data was sought, and granted by the SA National Department of Health. The database we used was not linked to patients' personal details, and as a result participant consent was not applicable.
Results
Progress towards reaching to 90-90-90 and 95-95-95 HIV implementation strategy in the CoJ between April 2016 and March 2022
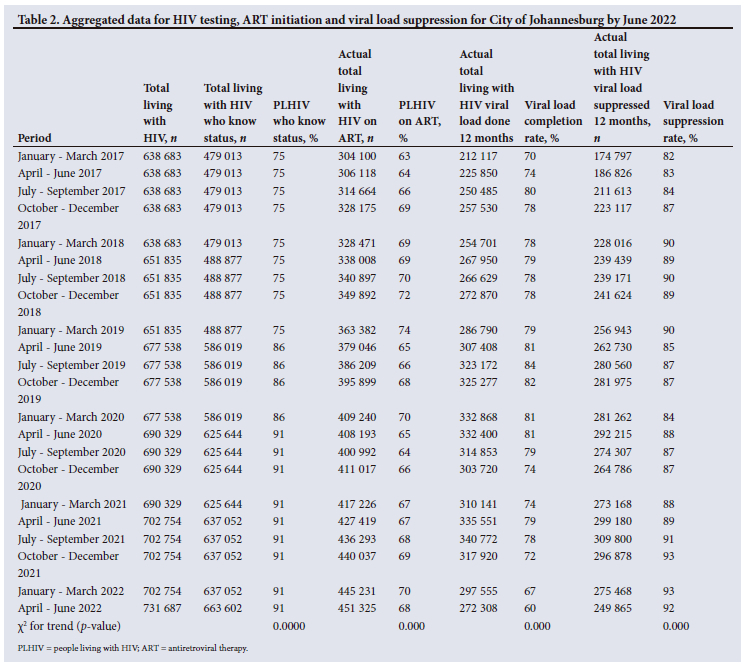
To determine the CoJ progress towards reaching the 90-90-90 and 95-95-95 targets we calculated quarterly proportions of (i) HIVpositive individuals who know their status; (ii) those who know their status initiated on ART; and (iii) those on ART who achieved sustained virologic suppression over the 6-year study period (Table 2).
Table 2 shows that by the April - June 2022 quarter, the CoJ was at 91-68-92 towards the set targets, meaning 91% of HIV-positive individuals knew their status, of whom 68% were initiated on ART and 92% were virally suppressed. The trend analysis for aggregated data over the period shows small but significant increases in HIV-positive individuals who know their status (b=0.01028; p<0.001), were initiated on ART (b=0.00056, p<0.001) and were virally suppressed (b=0.00296, p<0.001).
HIV positivity rate trends between April 2016 and March 2022 in CoJ Metropolitan municipality
To determine trends in positivity rate among different categories, we calculated positivity rate proportions and presented them in line graphs. As shown in Fig. 1, there is a significant decline in trends in HIV positivity rates over time across the groups in the CoJ.
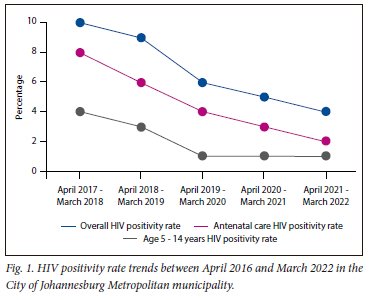
The overall HIV positivity rate among all who tested for HIV in the CoJ significantly declined from 10% in the first year (April 2017 - March 2018) to 4% in the last year (April 2021 - March 2022) (slope = -0.016; p<0.001).
ANC positivity rate: The HIV positivity rate among pregnant women attending antenatal care (ANC) services in the CoJ significantly declined from 8% in 2017 to 2% in 2022 (slope = -0.013; p<0.001).
HIV positivity rate 5 - 14 year-olds: The HIV positivity rate among 5 - 14-year-olds in the CoJ significantly declined from 4% in 2017 to 1% in 2022 (slope = -0.0087; p<0.001).
Discussion
This article is part of a larger quasi-experimental study that focused on establishing progress towards reaching the 90-90-90 strategy targets on HIV testing, ART initiation and retention in care among HIV-positive individuals in the CoJ using the DHIS database. Even though the CoJ did not reach the 90-90-90 targets by 2020, significant progress has been observed. In addition, a significant decline in HIV positivity rate among the different age categories is being observed in the CoJ.
Throughout the study period, the HIV positivity rate showed a significant decline in the CoJ, similar to the modelling predictions by Van Schalkwyk et al.[6] and other studies. The main goal of the 90-90-90 and 95-95-95 strategy implementation is to make sure that those who are HIV positive are virally suppressed and not transmitting HIV, in line with the Undetectable = Untransmittable (U=U) concept.[15] This would subsequently translate into a decline in new infections and general HIV positivity rates.[6] The decline in HIV positivity rate cannot be solely attributed to the increase in ART initiation and viral load suppression: other HIV prevention and control strategies such as male circumcision,[16,17] scale-up of the President's Emergency Plan For AIDS Relief (PEPFAR)-funded DREAMS programme (launched in 2015 to reduce new HIV infections and critical vulnerabilities such as gender-based violence in adolescent girls and young women) may play a part.[18,19] Consistent declines in HIV incidence in SA have been well documented in cohort studies.[20] Therefore, to ensure HIV elimination, it is critical to strengthen HIV prevention initiatives and find those not accessing ART and not virally suppressed, which is the focus for the 95-95-95 target.[1,18,19]
The results show that over the 6-year strategy implementation period, the CoJ has made huge progress towards reaching the strategy targets: that is, by March 2022, 91% of HIV-positive individuals knew their status, of whom 74% were initiated on ART, of whom 91% were virally suppressed. The CoJ progress is commendable and in line with the modelling predictions by Van Schalkwyk et al.[6] Van Schalkwyk et al. predicted that eThekwini would not be the only metro that would reach the target on the first 90%. On the other hand, the rest of the SA metros, namely Cape Town, Ekurhuleni, Johannesburg and Tshwane, could not reach all the 90-90-90 targets, with Ekurhuleni being the furthest from reaching them, with only 41.3% of PLHIV virally suppressed.[6] The concern is the discrepancy among different age groups, as reported in our previous publication, where children were less likely to be HIV tested and become virally suppressed in CoJ compared with their adult counterparts.[8,9] In addition, men have consistently been reported to lag behind in accessing HIV services over decades,[21,22] and several interventions and innovations to retain them in care have been tried and tested. There is need for more male and children-centred interventions, as they are so far limited.[9,23]
Of concern is the suboptimal proportion, ranging between 63% and 69%, of those who knew that they were HIV positive and were initiated on ART over the 6-study year period, meaning that 31 - 37% of those who tested HIV positive were not initiated on ART. Plausible reasons for this would be city mobility or movement of the individuals who tested positive before ART initiation.[24] In addition, these low ART initiation levels could be due to poor linkage to care, and health system delays in treatment initiation.[25] These have been shown to impede the clinical and public health benefits of ART including U=U.[15] To maximise the U=U benefits, the global World Health Organization and SA HIV guidelines have recommended ART initiation at the time of HIV diagnosis since January 2016.[26] However, these data highlight huge challenges to linkage to care between an HIV-positive test and ART initiation, which was in existence even before the test-and-treat era.[27,28] It is therefore time to focus on targeting those individuals with associated ART initiation delay risk factors, such as men, lack of disclosure and other issues, to ensure they are prioritised in linkage to care strategies.[27,28]
In addition, the study established the suboptimal proportion of viral load completion rate of about 70 - 82% in the study period. This means that not all HIV-positive individuals initiated on ART remain in care. Even though the viral suppression rate is currently >90%, those not retained in care are a concern, and prevent maximum benefits of the ART programme.[15] Risk factors to poor retention in care have been well documented over decades, and not much change has been observed. These include both healthcare delivery and patient-related (psychosocial, perceptual, sociodemographic) factors.[29,30] A concern is the fact that ART initiation on the same day an individual tests positive, as advocated in the test-and-treat policy, has been shown to negatively impact retention in care after ART enrolment.[29,31] It is therefore imperative to rethink how we can retain those at risk of being lost to care, including men, younger individuals, those experiencing stigma and those initiated on the same day of their HIV-positive diagnosis.
When anecdotal reports emerged of huge interruptions in patient adherence to ART in SA at the beginning of the COVID-19 pandemic,[32,33] calls were made to maintain essential services, including HIV treatment.[34] An inverse association between COVID-19 cases and ART initiations was reported in SA.[35] However, this study has shown no substantial negative effect of the pandemic on access to HIV services in the CoJ. Nevertheless, if it was not for the COVID-19 pandemic, the increases in HIV testing, ART initiation and viral suppression might have been much higher.[35] Our study finding is consistent with global data reported to the Joint United Nations Programme on HIV and AIDS (UNAIDS), which did not show substantial decreases in the first 6 months of the pandemic when countries had hard lockdowns.[36] Therefore, in this case, we applaud the SA health system for striking the balance in maintaining HIV services during the pandemic.[34]
The main limitation to this study is the use of the public health sector DHIS database, which is reported to have incomplete data sources, compromising the quality of the data used.[37] To address the limitations, where there were missing data or date discrepancies, efforts were made to compare with database sources to ensure database completeness and address potential bias.
Conclusion
This study highlights the positive progress made by the CoJ towards access to HIV services, and the steady decline in HIV positivity rate overall. On the other hand, delays or poor linkage to care between testing HIV positive and ART initiation have been shown. In the 95-95-95 strategy implementation phase, we recommend that the CoJ focuses on finding those not reached during the 90-90-90 strategy implementation phase. These may include children, youth and men. Therefore, revised and renewed innovative strategies are recommended to ensure linkage to care and universal access to the available HIV services.
Declaration. None.
Acknowledgements. We would like to thank the CoJ team permitting us to access data and information on the 90-90-90 strategy implementation progress, and Mr Prince Dulaze of ANOVA Health, the implementation partner, in accessing and understanding the database. In addition, we acknowledge financial support from the National Research Foundation for the financial resources used for data collection and analysis.
Author contributions. JCYN conceptualised the research project and drafted the first version of this article. IM and JCYN analysed the data and drafted the results section. Both authors read and revised the drafts, and approved the final manuscript. JCYN is the guarantor of the manuscript.
Funding. None.
Conflicts of interest. None.
References
1. Joint United Nations Programme on HIV and AIDS. Global AIDS update 2021, confronting inequalities: Lessons for pandemic responses from 40 years of AIDS. Geneva: UNAIDS, 2021. [ Links ]
2. Joint United Nations Programme on HIV and AIDS. Global AIDS update 2019: Communities at the centre: Defending rights, breaking barriers, reaching people with HIV services 2019. Geneva: UNAIDS, 2019. https://www.unaids.org/sites/default/files/media_asset/2019-global-AIDS-update_en.pdf (accessed 6 December 2023). [ Links ]
3. Statistics South Africa. Statistical release: Mid-year population estimates 2021. Pretoria: Stats SA, 2021. [ Links ]
4. Statistics South Africa. Statistical release: Mid-year population estimates 2019. Pretoria: Stats SA, 2019. [ Links ]
5. Joint United Nations Programme on HIV and AIDS. Ending the AIDS epidemic by 2030, program area: South Africa 2019. https://www.unaids.org/en/regionscountries/countries/southafrica (accessed 24 January 2023). [ Links ]
6. Van Schalkwyk C, Dorrington RE, Seatlhodi T, Velasquez C, Feizzadeh A, Johnson LF. Modelling of HIV prevention and treatment progress in five South African metropolitan districts. Sci Rep 2021;11(1):5652. [ Links ]
7. United Nations. Political declaration on HIV and AIDS: On the fast track to accelerating the fight against HIV and to ending the AIDS epidemic by 2030. Geneva: UN, 2019. [ Links ]
8. Nyasulu J, Maposa I, Sikhakhane B, Pandya H. Access to HIV services and viral load suppression among children during the 90-90-90 strategy implementation in South Africa: A time series analysis. South Afr J HIV Med 2021;22(1):8. https://doi.org/10.4102/sajhivmed.v22i1.1187 [ Links ]
9. Nyasulu J, Dunlop J, Pandya H, Slemming W, Fick C, Saloojee H. Children have been left behind during the HIV 90-90-90 strategy implementation in South Africa. S Afr Med J 2021;111(10):921. https://doi.org/10.7196/samj.2021.v111i10.15915 [ Links ]
10. Joint United Nations Programme on HIV and AIDS. Undetectable = untransmittable: Public health and HIV viral load suppression. Geneva: UNAIDS, 2018. [ Links ]
11. De Oliveira T, Kharsany AB, Gräf T, et al Transmission networks and risk of HIV infection in KwaZulu-Natal, South Africa: A community-wide phylogenetic study. Lancet HIV 2017;4(1):e41-e50. [ Links ]
12. Statistics South Africa. Statistical release: Midyear population estimates. Pretoria: Stats SA, 2019. [ Links ]
13. Health Systems Trust. City of Johannesburg district implementation plan (DIP). In: CoJ. 90-90-90 strategy district implementation plan. Volume 1. Durban: Health Systems Trust, 2016. [ Links ]
14. Johnson LF, Chiu C, Myer L, et al. Prospects for HIV control in South Africa: A model-based analysis. Glob Health Action 2016;9:30314. https://doi.org/10.3402/gha.v9.30314 [ Links ]
15. Eisinger RW, Dieffenbach CW, Fauci AS. HIV viral load and transmissibility of HIV infection: Undetectable equals untransmittable. JAMA 2019;321(5):451-452. https://doi.org/10.1001/jama.2018.21167 [ Links ]
16. Smith PJ, Oulo B, Wallace M, et al. Uptake and acceptability of medical male circumcision among young males in two culturally distinct settings in South Africa: A longitudinal, community-based study (the MACHO study). S Afr Med J 2020;110(10):1050-1055. https://doi.org/10.7196/samj.2020.v110i10.14110 [ Links ]
17. Korenromp EL, Bershteyn A, Mudimu E, et al. The impact of the program for medical male circumcision on HIV in South Africa: Analysis using three epidemiological models. Gates Open Res 2021;5:15. https://doi.org/10.12688%2Fgatesopenres.13220.1 [ Links ]
18. Birdthistle I, Schaffnit S, Kwaro D, et al. Evaluating the impact of the DREAMS partnership to reduce HIV incidence among adolescent girls and young women in four settings: A study protocol. BioMed Central Pub Health 2018;18:912. [ Links ]
19. Saul J, Bachman G, Allen S, Toiv N, Cooney C, Beamon T. The DREAMS core package of interventions: A comprehensive approach to preventing HIV among adolescent girls and young women. PLoS ONE 2018;13(12):e0208167. https://doi.org/10.1371/journal.pone.0208167 [ Links ]
20. Vandormael A, Akullian A, Siedner M, de Oliveira T, Bärnighausen T, Tanser F. Declines in HIV incidence among men and women in a South African population-based cohort. Nature Communic 2019;10(1):5482. [ Links ]
21. Muwanguzi M, Lugobe HM, Ssemwanga E, et al. Retention in HIV care and associated factors among youths aged 15 - 24 years in rural southwestern Uganda. BMC Public Health 2021;21(1):1489. [ Links ]
22. Zanoni BC, Archary M, Buchan S, Katz IT, Haberer JE. Systematic review and meta-analysis of the adolescent HIV continuum of care in South Africa: the Cresting Wave. BMJ Glob Health 2016;1(3):e000004. https://doi.org/10.1136/bmjgh-2015-000004 [ Links ]
23. Kusemererwa S, Akena D, Nakanjako D, et al. Strategies for retention of heterosexual men in HIV care in sub-Saharan Africa: A systematic review. PLoS One 2021;16(2):e0246471. https://doi.org/10.1371/journal.pone.0246471 [ Links ]
24. Ginsburg C, Norris S, Richter L, Coplan D. Patterns of Residential Mobility Amongst Children in Greater Johannesburg-Soweto, South Africa: Observations from the Birth to Twenty Cohort. Urban Forum 2009;20:397-413. [ Links ]
25. Fuge TG, Tsourtos G, Miller ER. Risk factors for late linkage to care and delayed antiretroviral therapy initiation among adults with HIV in sub-Saharan Africa: A systematic review and meta-analyses. Int J Infect Dis 2022;122(037):885-904. https://doi.org/10.1016/j.ijid.2022.07.037 [ Links ]
26. National Department of Health. National consolidated guidelines for the prevention of mother-to-child transmission of HIV (PMTCT) and the management of HIV in children, adolescents and adults. Pretoria: NDoH, 2015. [ Links ]
27. Nyasulu J. Pre-ART program service delivery at a PHC facility level: Access and retention of patients in care in the city of Johannesburg, South Africa. PhD thesis. Johannesburg: University of the Witwatersrand, 2016. [ Links ]
28. Maughan-Brown B, Harrison A, Galarraga O, et al. Factors affecting linkage to HIV care and ART initiation following referral for ART by a mobile health clinic in South Africa: Evidence from a multimethod study. J Behav Med 2019;42(5):883-897. https://doi.org/10.1007/s10865-018-0005-x [ Links ]
29. Van Wyk B, Kriel E, Mukumbang F. Retention in care for adolescents who were newly initiated on antiretroviral therapy in the Cape Metropole in South Africa. South Afr J HIV Med 2020;21(1):1-8. https://doi.org/10.4102/hivmed.v21i1.1077 [ Links ]
30. Boyles TH, Wilkinson LS, Leisegang R, Maartens G. factors influencing retention in care after starting antiretroviral therapy in a rural South African programme. PLoS ONE 2011;6(5):e19201. 2011. https://doi.org/10.1371/journal.pone.0019201 [ Links ]
31. Mugenyi L, Nanfuka M, Byawaka J, et al. Effect of universal test and treat on retention and mortality among people living with HIV-infection in Uganda: An interrupted time series analysis. PLoS ONE 2022;17(5):e0268226. https://doi.org/10.1371%2Fjournal.pone.0268226 [ Links ]
32. MedicalBrief. Right to Care: Coronavirus in SA: HIV-positives are skipping treatment and drastic drop in testing. Africa Medical Media Digest, 29 April 2020. [ Links ]
33. Madhi SA, Gray GE, Ismail N, et al. COVID-19 lockdowns in low- and middle-income countries: Success against COVID-19 at the price of greater costs. S Afr Med J 2020;110(8):724-726. [ Links ]
34. Nyasulu J, Pandya H. The effects of coronavirus disease 2019 pandemic on the South African health system: A call to maintain essential health services. Afr J Prim Health Care Fam Med 2020;12(1):2480. [ Links ]
35. Benade M, Long L, Rosen S, Meyer-Rath G, Tucker J-M, Miot J. Reduction in initiations of HIV treatment in South Africa during the COVID pandemic. BMC Health Serv Res 2022;22(1):428. [ Links ]
36. Joint United Nations Programme on HIV and AIDS. Confronting inequalities: Lessons for pandemic responses from 40 years of AIDS. Geneva: UNAIDS, 2021. [ Links ]
37. Garrib A, Stoops N, McKenzie A, et al. An evaluation of the District Health Information System in rural South Africa. S Afr Med J 2008;98(7):549-552. [ Links ]
 Correspondence:
J C Y Nyasulu
jnyasulu@sun.ac.za
Accepted 5 November 2023

