


Services on Demand
Article
 English (pdf)
 Article in xml format
 Article references
Indicators

Related links
-
 Cited by Google
 -
 Similars in Google
Share

 Permalink
SAMJ: South African Medical Journal
On-line version ISSN 2078-5135
Print version ISSN 0256-9574
SAMJ, S. Afr. med. j. vol.114 n.1 Pretoria Jan. 2024
http://dx.doi.org/10.7196/SAMJ.2023.v114i1.810
RESEARCH
Evaluation of the impact of PEPFAR transition on retention in care in South Africa's Western Cape Province
J ChilizaI; R LaingII, III; F G FeeleyIV; A T BrennanV, VI, VII
IDrPH, MSc; Department of Global Health, School of Public Health, Boston University, USA
IIMBChB, MSc; Department of Global Health, School of Public Health, Boston University, USA
IIIMBChB, MSc; School of Public Health, University of the Western Cape, Cape Town, South Africa
IVJD, BS; Department of Global Health, School of Public Health, Boston University, USA
VPhD, MPH; Department of Global Health, School of Public Health, Boston University, USA
VIPhD, MPH; Department of Epidemiology, School of Public Health, Boston University, USA
VIIPhD, MPH; Health Economics and Epidemiology Research Office, Faculty of Health Sciences, University of the Witwatersrand, Johannesburg, South Africa
ABSTRACT
BACKGROUND: Research on the impact of the US President's Emergency Plan for AIDS Relief (PEPFAR) transition in South Africa (SA) in 2012 found varying results in retention in care (RIC) of people living with HIV (PLWH
OBJECTIVES: To investigate the factors that impacted RIC during the PEPFAR transition in Western Cape Province, SA, in 2012
METHODS: We used aggregate data from 61 facilities supported by four non-governmental organisations from 2007 to 2015. The main outcome was RIC 12 months after antiretroviral therapy initiation for two periods - during PEPFAR and post PEPFAR. We used adjusted quantile regression to estimate the effect of the PEPFAR pull-out on RIC
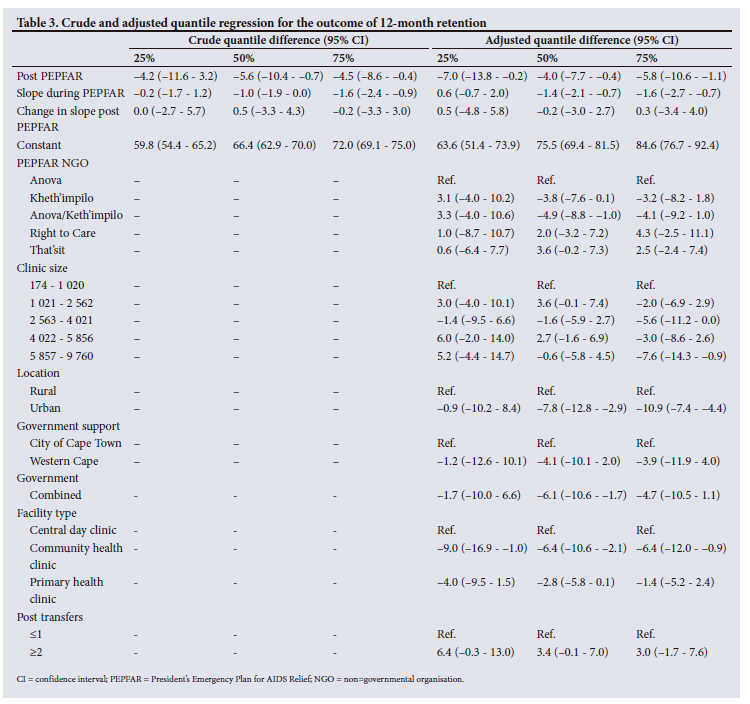
RESULTS: Regression models (50th quantile) for 12-month RIC showed a 4.0% (95% CI -7.7 - -0.4%) decline in RIC post-direct service. Facilities supported by Anova/Kheth'impilo fared worst post PEFPAR, with a decline in RIC of -4.9% (95% CI -8.8 - -1.0%), while TB, HIV/AIDS, Treatment Support, and Integrated Therapy (that'sit) fared best (3.6% increase in RIC; 95% CI: -0.2 - 7.3%). There was a decrease in RIC when comparing urban with rural areas (-7.8%; 95% CI -12.8 - -2.9%). City of Cape Town combined with Western Cape Government health facilities showed a substantial decrease (-6.1%; 95% CI -10.6 - -1.7%), while community health clinic (v. central day clinics) declined (-6.4; 95% CI -10.6 - -2.1%) in RIC. We observed no RIC difference by facility size and a slight increase when two or more human resources transitioned from PEPFAR to the government
CONCLUSIONS: When PEPFAR funding decreased in 2012, there was a decrease in RIC. To ensure the continuity of HIV care when a major funder withdraws sufficient and stable transition resources, investment in organisations that understand the local context, joint planning and co-ordination are required
Since 2003, the President's Emergency Plan for AIDS Relief (PEPFAR) has been the USA's most ambitious initiative to combat the global burden of HIV/AIDS and tuberculosis. PEPFAR is the largest contributor to global HIV/AIDS efforts.[1] From 2004 to 2016, PEPFAR invested USD72.7 billion globally in HIV and TB, including contributions to the Global Fund.[2] PEPFAR has increased the number of people receiving HIV treatment globally,[3] and decreased HIV-related mortality by 10.5% when compared with non-PEPFAR-supported countries.[4,5]
South Africa (SA) is the country with the highest number of people living with HIV (PLWH) globally (7.5 million).[6] By the end of 2017/2018, with 4.1 million adults on treatment,[7] SA was running the largest HIV treatment programme in the world.[8] Owing to the high burden of HIV/AIDS, SA was one of the first PEPFAR focus countries. In 2004, when PEPFAR began working in SA, the HIV prevalence among adults was 20%[9] and was a death sentence owing to the lack of access to free care and treatment in public sector health facilities.
Initial PEPFAR funds were emergency funds spent on antiretroviral (ARV) treatment, using US organisations based in SA (i.e. Population Services International, Family Health International) and private doctors[10] to roll out HIV treatment outside of the public health system.[9] As time progressed during the direct service phase (2007 -2012), PEPFAR supported local non-governmental organisations (NGOs) that employed health workers to work within the public health system to strengthen HIV services. In May 2009, the SA government (SAG)[11] adopted World Health Organization (WHO) treatment guidelines to start patients on treatment early (at a CD4 count of 350 rather than 200),[12] boosted the HIV budget by R1.7 million and rolled out an ambitious testing campaign that reached 14.7 million South Africans in 1 year.[12] During this time, PEPFAR strengthened its relationship with the SAG. Most PEPFAR funds in SA were distributed to NGOs that work within state health facilities to strengthen HIV/AIDS care and treatment programmes. In addition, many local NGOs were subcontracted to various other organisations, resulting in PEPFAR partnering with 120 NGOs in SA by the end of 2013.[8]
PEPFAR transition in South Africa
The SAG has been the main financial contributor to national HIV efforts. In 2012, to allow the SAG to take greater financial responsibility for the SA HIV epidemic, the US government (USG) along with the SAG developed the Partnership Framework, which outlined an annual 48% funding decrease in PEPFAR funds (USD483 million to USD250 million) by 2017.[13] The framework also outlined the transition of PEPFAR resources to the SAG and the USG's strategic shift from direct service (i.e. ARV rollout, purchasing ARVs and placing staff in SAG health facilities) to a focus on health systems strengthening, technical assistance and sustaining health outcomes.[14,15] In the Western Cape Province, human resource transition was a formalised process led by the Western Cape Government Health (WCGH) with input from health facilities. This resulted in the absorption of 78 HIV posts across the province.[16]
There were multiple changes and challenges associated with this transition. Due to a change in PEPFAR leadership, the Partnership Framework did not develop as originally planned. PEPFAR's budget increased by 71%, from USD259 million in 2015 to USD443 million in 2016. The transition focused solely on care and treatment, and there was no plan for other PEPFAR-funded activities (i.e. prevention). Since the transition was negotiated at the national level, there was a lack of capacity at the provincial level to absorb PEPFAR-supported patients.[17]
Literature on the impact of the PEPFAR transition in SA has found varying outcomes. Lince-Deroche et al.[18] looked at HIV service delivery post PEPFAR in three clinics in Johannesburg and found no reduction in service delivery post PEPFAR, while Cloete et al.[14] found 20% loss to follow-up (LTFU) of patients transferred from private to government health facilities. Katz et al.'s[17] qualitative study found that patients who were transferred to the public system were frustrated owing to long queues and missed work opportunities, and decreased quality of care, highlighting disrespectful staff, 'low quality communication' and lack of holistic care.[14] Kavanagh[8] speculates that ~50 000 - 200 000 PLWH were adversely affected by the PEPFAR transition. This high LTFU was a major concern owing to lack of adherence and possible increase of drug-resistant strains of the virus.
Retention in care (RIC) in SA (broadly defined as a patient's regular engagement with medical care at a healthcare facility after initial entry into the system) is a key indicator that demonstrates the long-term sustainability of antiretroviral therapy (ART) programmes. In 2015, the average RIC in sub-Saharan Africa aligned with global RIC rates (74% RIC at 24 months).[19] More recent research using SA's National Health Laboratory Service database showed that HIV care retention was substantially higher (63.3%) when viewed from a national perspective than from a facility perspective (29%).[20] These results suggest that traditional clinical cohorts underestimate retention, supporting the idea that failure to account for patient movement between clinics (sometimes referred to as a 'silent transfer') can make estimates of RIC seem worse than they really are. To the best of our knowledge, there has been no formal evaluation of the PEPFAR transition in SA and its impact on RIC. As such, our study sought to assess the impact of PEPFAR transition´on RIC in 2012.
Methods
Data
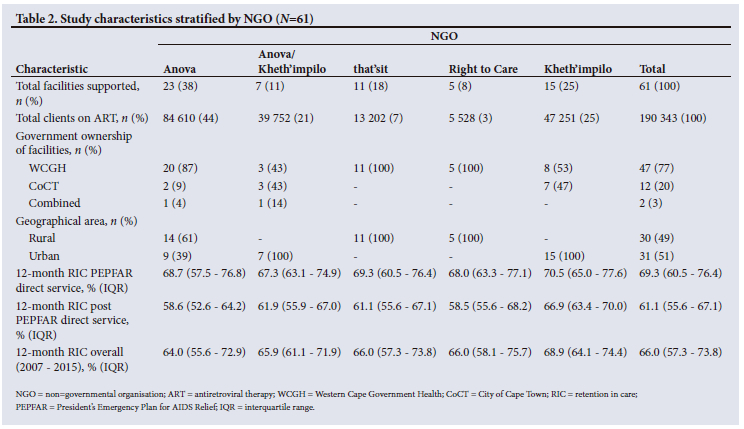
The aggregate data used for this study were retrieved from the WCGH's HIV data system, Tier.net.[21] The primary purpose of Tier.net is to manage the HIV programme at a facility level. Data from Tier.net aggregated at the facility level were collected for 61 health facilities supported by four local PEPFAR treatment NGOs from to 2007 to 2015:[1] Kheth'impilo (n=15); Anova Health Institute (Anova) (n=23); Right to Care (n=5); and TB, HIV/AIDS, Treatment Support, and Integrated Therapy (that'sit) (n=11). There was a fifth category in our analysis of Anova/Kheth'impilo, as these two NGOs overlapped in their support of seven health facilities in the study sample. Raw RIC data per health facility were provided for the cohort initiated on ART each year. A cohort was defined by the WCGH as the number of new HIV patients (including transfers in) initiating ART treatment at a particular facility in a specific year (January 1 - December 31) from 2007 to 2015.
PEPFAR NGOs
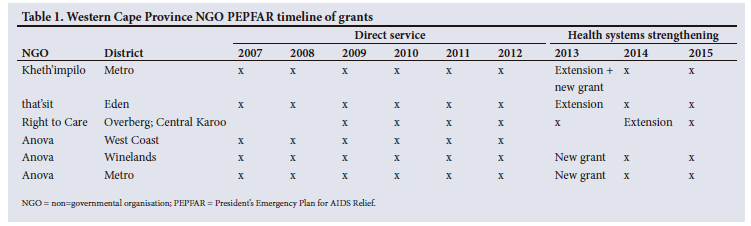
The four NGOs used in this study were the main NGOs working in the Western Cape that received PEPFAR funding to support comprehensive HIV/AIDS care and treatment services at government facilities from 2007 to 2012 (Table 1). Note that Right to Care's timeline was slightly later, from 2009 to 2014. During this time, funding was used to scale up, support and expand access to HIV services, including HIV testing and counselling, treatment, prevention of mother-to-child transmission, combination prevention and screening, and treatment of tuberculosis. In 2013, that'sit, Right to Care and Kheth'impilo received extension funds to close out projects and phase out direct service support starting in 2013 through 2015, while Anova and Kheth'impilo received new PEPFAR grants to support the Western Cape from 2013 to 2017 in the Metro and Winelands regions. Each NGO worked in a specific geographic region in the province. As noted, Anova and Kheth'impilo both worked in the Metro District, supporting seven of the same health facilities.
Study variables
The main outcome of interest was RIC at 12 and 24 months after ART initiation in each health facility from 2007 to 2015. RIC was analysed for two separate time periods:[1] PEPFAR direct service (2007 to 2012) and post-PEPFAR direct service (2013 to 2015). The study definition for RIC among adults (age >15 years) is as follows:
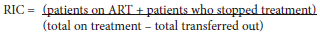
Total on treatment includes HIV clients who are transferred to the health facility via a formal or silent transfer. Mortality was included in patients who stopped treatment. We conducted a sensitivity analysis by adding death to the definition, and the results did not change. Retention was calculated across the 9-year period (2007 -2015) for each clinic. Other covariates of interest were patient volume for each clinic (stratified into quintiles), location (urban v. rural), number of job posts transferred from PEPFAR NGOs to government (categorised as <1 and >2), facility type (central day clinic (CDC), community health clinic (CHC) and primary health clinic (PHC)) and government (City of Cape Town (CoCT), Western Cape Government (WCG) and a combination where they both overlapped) and NGO (Anova, Anova/Kheth'impilo, Kheth'impilo, that'sit and Right to Care). RIC for each health facility supported by Anova, that'sit and Kheth'impilo were calculated at 12 and 24 months for the two time periods, 2007 to 2012 (during PEPFAR direct service), and 2013 to 2015 (post-PEPFAR direct service). Since Right to Care became active 2 years later, the average RIC cut-off was 2009 - 2012 (PEPFAR direct service) and 2013 - 2015 (post-PEPFAR direct service).
Simple descriptive statistics were used to report the characteristics of the study sample and were stratified by NGO. We graphically displayed trends in 12- and 24-month retention, LTFU (defined as clients who have not visited the health facility for >90 days) and total clients starting treatment at the start and end of the cohort by year overall and stratified by NGO.
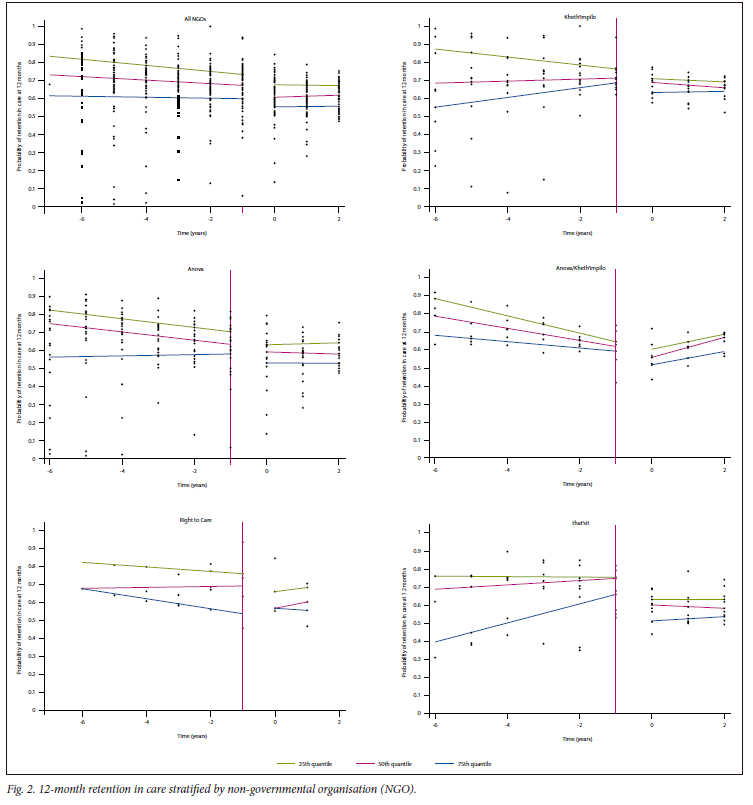
Quantile regression was used to estimate the associations between PEPFAR pull-out and changes in 12-month RIC at the 25th, 50th and 75th quantiles, adjusted for covariates. The models contain the dependent variable (12-month retention), conditional on time (years), plus an indicator variable for PEPFAR pull-out (set to 0 for each year during PEPFAR funding and set to 1 for years post PEPFAR), an interaction term between these two variables to display trends over time, and additional covariates (i.e. clinic volume, government, NGO, transfer in human resource posts, facility type, and location). The coefficient for the indicator variable for PEPFAR pullout can be interpreted as the quantile difference in retention between the PEPFAR and post-PEPFAR periods for the 25th, 50th and 75th quantiles of our study sample. We graphed the crude predicted results from the quantile regression models and overlaid scatter plots of retention by clinic overall and stratified by each NGO to show the intercept shift and trends in retention during and post PEPFAR. We conducted quantile regression on 24-month retention as well, but focused the main results of this study on 12-month retention because they did not differ greatly, and displayed 24-month retention as supplementary tables and figures (appendix: https://www.samedical.org/file/2155). Stata 16 (StataCorp,. USA) and Excel 2016 (Microsoft, USA) were used to analyse the data.
Results
Characteristics of the study sample
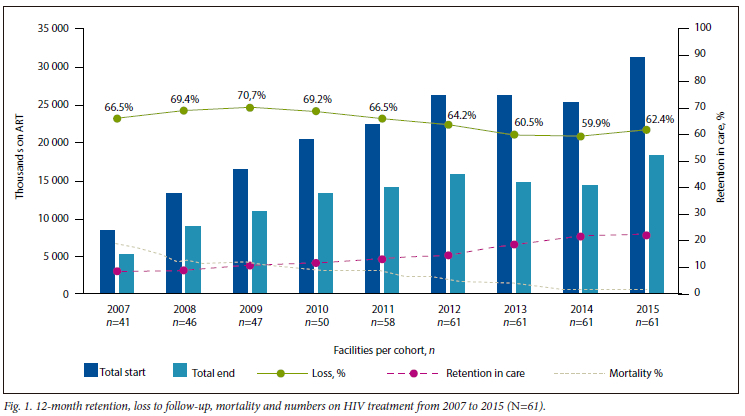
The 61 health facilities included in the study sample were predominately WCGH owned (77%), with a total of 190 343 patients, and equally split between rural and urban areas (Table 2). The majority of the clinics were supported by Anova (n=23, 38%) and Kheth'impilo (n=15, 25%), while Right to Care had the lowest number (n=5, 8%). ART cohorts gradually increased in size, though in 2015 there was an increase in the number of HIV clients on treatment (Fig. 1).
Trends of retention over time
When assessing the trends in 12-month retention overall, our results show an increase in the number of people starting ART, from 8 338 in 2007 to 31 260 in 2015 (Fig. 1), with Anova having the greatest increase in patients during that time period and Right to Care having the smallest (appendix Fig. 1A - E). The overall 12-month retention of the study sample was 69.3% (interquartile range (IQR) 60.5 -76.4%) during PEPFAR and 61.1% (IQR 55.6 - 67.1%) post PEPFAR (Table 2). Retention for each NGO decreased post PEPFAR direct service. Overall, the graphs for each NGO showed a decrease in RIC in 2012/2013 (appendix Fig. 1A - E). The mortality rate of the study sample decreased post the PEPFAR transition, falling from 3.8% in 2007 to 0.7% in 2015 (post PEPFAR) (Fig. 1). This is most likely due to a delay in reporting of mortality, as previous research shows that 50% of LTFU is due to mortality.[22]
Quantile regression
We report the results for the 50th quantile for all models here in the text, as the 25th and 75th percentiles are displayed in the tables and figures. The median RIC for the 50th percentile was 66.0% (IQR) 57.3 - 73.8%). We observed a decline of 4.0% (quantile difference (QD) -7.7 - -0.4%) in 12-month RIC post PEPFAR compared with during PEPFAR (Table 3 and Fig. 2). Additionally, there was a slight decline in RIC in the PEPFAR era and a plateau in the post-PEFAR period (indicated in the direction of the slopes), as shown in Table 3 and Fig. 2. It is also important to note that health facilities supported by Anova/Kheth'impilo fared worst with regard to RIC post PEFPAR (50th QD: -4.9%; 95% confidence interval (CI) -8.8 - 1.0%), while that'sit fared best (50th QD 3.6%; 95% CI -0.2 - 7.3%) when compared with Anova. We observed a larger decline post PEPFAR in 24-month RIC (50th QD -7.0%; 95% CI -10.2 - -3.9%) and all other NGOs performing slightly better post PEPFAR when compared with Anova (appendix Table 1 and Fig. 2A - 2F).
We also saw a large decrease of -7.8% (95% CI -12.8 - -2.9%) for the 50th quantile in 12-month RIC in urban health facilities when compared with rural areas, while CoCT combined with WCGH had a substantial drop (50th QD -6.1%; 95% CI -10.6 - -1.7%) in RIC when compared with CoCT alone, while CHCs (50th QD-6.4%; 95% CI -10.6 - -2.1%) and PHCs (50th QD -2.8%; 95% CI-5.8 - 0.1%) had a larger decline in RIC when compared with CDCs (Table 3 and Fig. 2). We saw an increase of RIC in health facilities that had >2 posts transferred from PEPFAR to government (50th QD 3.4%; 95% CI: -0.1 - 7.0%) compared with those that had <1. There was no clear trend in RIC when assessing the relationship between health facility size, measured by total clients on ART, and RIC. With regard to the 24-month RIC, we saw a slight decline in RIC as health facility size increased, while trends in all other variables were consistent with the 12-month RIC (appendix Table 1 and Fig. 2A - 2E).
Discussion
In this assessment of RIC post PEPFAR in SA's Western Cape Province, we found a 12-month retention decline in the post-PEPFAR era. For all NGO-supported clinics, RIC during PEPFAR was a 4.0 percentage point decrease from the PEPFAR direct service period. There are several explanations for these results. One explanation for the decline from 2012 could be the direct effect of PEPFAR, moving from direct service support to a focus on health systems strengthening. This change meant a decrease in human resources, supported by the local healthcare system. Much of PEPFAR's support was for HIV-specific community health workers, tracers and data capturers, who were key for high performance and sustained HIV outcomes, particularly retention. The Western Cape PEPFAR transition did not prioritise the absorption of PEPFAR-supported community posts, which meant that in 2012/2013, the province lost 418 community posts supported by PEPFAR.[16]
Our findings are consistent with Kavanagh's[8] report on the SA transition. Owing to PEPFAR's transition strategy, health facilities lost close ties with the community, and HIV retention and prevention efforts fell off the priority list. If the government had made the decision to transition to more staff in smaller health facilities and prioritise community staff in the transition, they would have been more likely to see sustained retention in smaller health facilities. Another alternative explanation could be the 2010 change in HIV treatment policy, which increased the CD4 eligibility threshold for ART from 200 to 350 cells/mm3.[23] The increase in eligibility threshold would have resulted in more patients accessing the healthcare system for monitoring and treatment of the HIV disease, adding stress to the health system and beginning ART in more patients who were not yet seriously symptomatic. Research from Cape Town, SA, showed that LTFU and the risk of virological failure increased when the ratio of patients per health worker increased.[24] One explanation for this could be the increase in ARV treatment sites over time, and the fact that patients were able to move between facilities, but would be recorded as LTFU in the original health facility where they were enrolled on treatment.
When stratifying our results by NGO, we showed that overall RIC at health facilities supported by Kheth'impilo was the highest, while Anova supported health facilities with the lowest RIC. Kheth'impilo support was localised to urban areas, and even with high ART patient volumes, they were able to maintain high RIC throughout the transition. Kheth'impilo was also able to retain the largest number of PEFPAR posts compared with the other NGOs.
Sustaining former PEPFAR human resources in the health system likely facilitated high RIC.[25]
The CoCT RIC performance was better than that of WCGH. CoCT may have performed better than WCGH health facilities because post Apartheid or post 1994 they inherited a relatively strong health system that provided HIV services for longer than the WCGH and spent more funding per patient than WCGH.[27] Pre 1994 and prior to PEPFAR, HIV care and treatment were not available. HIV treatment was initially rolled out in the Metro District, leaving the rural areas of the Western Cape with little access to HIV services. Additionally, because CoCT provides services in an urban area, there is easier access to healthcare services, allowing patients to stay on their treatment. HIV patients living in rural areas often lack transport and resources and fear loss of confidentiality, while rural health systems suffer more medication stockouts, which affect RIC.[27]
Anova/Kheth'impilo were impacted more, with as high as a 7.5% decline in RIC post PEPFAR in the 75th quantile v. Anova alone, while Right to Care was the least impacted, with as high as a 7.7% increase post PEPFAR in the 75th quantile v. Anova alone. We recently published a qualitative analysis of this work[25] that showed that established NGOs with a history of working in the Western Cape supported facilities with higher RIC. Anova and Kheth'impilo had been working in the Western Cape for many years, understood the health system gaps, had longstanding relationships with local officials and produced high sustainability results. Qualitative data highlighted that stable staff and the consistency of patient/provider relationships were important for sustaining RIC. It is important that patients trust and feel understood by health facility staff. If donors flood the local health system with additional staff, withdrawing them will result in less sustainable outcomes.[25]
Our results should be considered, in addition to their limitations. First, our data are from government health facilities and NGOs operating in SA's Western Cape Province, which had the lowest estimated prevalence of HIV among 15 - 49-year-olds (9.4%) in 2013, compared with other provinces, such as KwaZulu-Natal (26.8%).[28] Therefore, our results may not be generalisable to other provinces and/or other sub-Saharan African countries where PEPFAR has been implemented. Second, our data were aggregate data provided by Tier.net, a government-owned HIV electronic patient management system. As such, we run the risk of possible loss of information and are vulnerable to the ecological fallacy, resulting in false inferences about individual behaviour on the basis of population-level data. However, our estimates of retention are consistent with previously published literature on retention in ART programmes in the Western Cape during PEPFAR (74.2%)[29] and post PEFAR (54.3%) at 36 months follow-up that used individual patient-level data in their analysis.[29] Third, we could have unmeasured confounding owing to the inability to control for potential confounders due to missing information at the facility level (i.e. transfers, employee turnover rate). We attempted to minimise confounding by type of health facility by including only primary healthcare facilities (i.e. clinics, community day centres and community health centres) in our study.
Conclusion
Our results show that when donor funding decreased, there was a decline in RIC of patients in HIV care post PEPFAR compared with the PEPFAR direct service era. To ensure that RIC is high, the system needs to minimise loss to follow-up. Support from different government bodies and the size of health facilities had no effect on RIC, although additional human resources in the system and support from NGOs with a history in the province assisted in sustaining retention. Although it is unlikely that there would ever be as large a programme as PEPFAR to support HIV care and treatment in the future, it would be valuable for donors working in government health facilities to allocate funding to support health facilities and NGOs as they transition out. These funds would help maintain quality patient care and sustain clinical outcomes during the transition. In conclusion, future donor transitions should prioritise close planning with local governments, together with stable human and financial resources, to ensure sustained health outcomes.
Declaration. This study was completed as part of JC's PhD degree.
Acknowledgements. None.
Author contributions. ATB conducted the analysis. JC and ATB wrote the initial draft of the paper. JC, ATB, RL, and FGF contributed to and approved the final draft.
Funding. ATB was funded by the National Institute of Diabetes and Digestive and Kidney Diseases (NIDDK), ref. no. 1K01DK116929-01A1. The authors of this article are solely responsible for the content.
Conflicts of interest. None.
References
1. Institute of Medicine. PEPFAR evaluation. The National Academies Press, 2013. https://nap.nationalacademies.org/catalog/18256/evaluation-of-pepfar (accessed 7 September 2016). [ Links ]
2. amfAR. PEPFAR Country/Regional Operational Plans (COPs/ROPs) Database. https://copsdata.amfar.org/ (accessed 3 July 2016). [ Links ]
3. Wools-Kaloustian K, Kimaiyo S, Musick B, et al. The impact of the Presidents Emergency Plan for AIDS Relief on expansion of HIV care services for adult patients in western Kenya. AIDS 2009;23(2):195-201. https://doi.org/10.1097/QAD.0b013e32831cc0e6 [ Links ]
4. Bendavid E, Bhatttacharya J. The President's Emergency Plan for AIDS Relief in Africa: an evaluation of outcomes. Ann Intern Med 2009;150(10):688-695. https://doi.org/10.7326/0003-4819-150-10-200905190-00117 [ Links ]
5. Bendavid E, Holmes CB, Bhattacharya J, Miller G. HIV development assistance and adult mortality in Africa. JAMA 2012;307(19):2060-2067. https://doi.org/10.1001/jama.2012.2001 [ Links ]
6. Joint United Nations Programme on HIV and AIDS. South Africa Country Facts. UNAIDS, 2019. https://www.unaids.org/en/regionscountries/countries/southafrica (accessed 22 April 2021). [ Links ]
7. Health Systems Trust. District Health Barometer 2017/18: Section 11. HST: Westville, 2019. https://www.hst.org.za/publications/Pages/DHB20172018.aspx (accessed 4 June 2019). [ Links ]
8. Kavanagh MM. The politics of transition & the economics of HIV-AIDS & PEPFAR in South Africa. Health-e, 2014. http://www.health-e.org.za/wp-content/uploads/2014/01/Politics-of-Transition-Report-AIDS-South-Africa.pdf (accessed 5 July 2016). [ Links ]
9. Katz IT, Bassett IV, Wright AA. PEPFAR in transition - implications for HIV care in South Africa. N Engl J Med 2013;369(15):1385-1387. https://doi.org/10.1056/NEJMp1310982 [ Links ]
10. Kavanagh MM. The politics and epidemiology of transition: PEPFAR and AIDS in South Africa. J Acquir Immune Defic Syndr 2014;65(3):247-250. http://europepmc.org/abstract/MED/24346642 (accessed 6 December 2023). [ Links ]
11. Simelela NP, Venter WD. A brief history of South Africa's response to AIDS. S Afr Med J 2014;104(3 Suppl 1):S249-S251. https://doi.org/10.7196/samj.7700 [ Links ]
12. Brundage S. Terra Nova: How to achieve a successful PEPFAR transition in South Africa. A Report of the CSIS Global Health Policy Center. Center for Strategic and International Studies. A Report of the CSIS Global Health Policy Center. Center for Strategic and International Studies, March 2013. https://www.hst.org.za/publications/NonHST%20Publications/130313_Morrison_SouthAfricaHIV_Web.pdf (accessed 21 July 2018). [ Links ]
13. President's Emergency Plan for AIDS Relief. Partnership framework implementation plan in support of South Africa's National HIV, STI & TB response between the Government of the Republic of South Africa and the Government of the United States of America. PEPFAR, 2012. https://www.state.gov/countries-areas/south-africa/ (accessed 18 October 2016). [ Links ]
14. Cloete C, Regan S, Giddy J, Govender T, et al. The linkage outcomes of a large-scale, rapid transfer of HIV-infected patients from hospital-based to community-based clinics in South Africa. Open Forum Infect Dis 2014;1(2):ofu058. https://doi.org/10.1093/ofid/ofu058 [ Links ]
15. President's Emergency Plan for AIDS Relief. Country operational plan strategic direction summary. PEPFAR, 2015. https://www.state.gov/countries-areas/south-africa/ (accessed 30 November 2017). [ Links ]
16. Chiliza J. Life after PEPFAR's direct service support: Program sustainability among South African HIV/ AIDS organizations funded by PEPFAR. https://hdl.handle.net/2144/39529 (accessed 6 December 2023). [ Links ]
17. Katz IT, Bogart LM, Cloete C, Crankshaw TL, et al. Understanding HIV-infected patients' experiences with PEPFAR-associated transitions at a Centre of Excellence in KwaZulu Natal, South Africa: A qualitative study. AIDS Care 2015;27(10):1298-1303. https://doi.org/10.1080/09540121.2015.1051502 [ Links ]
18. Lince-Deroche N, Leuner R, Meyer-Rath G, Pillay Y, Long L. When donor funding leaves: An interrupted time-series analysis of the impact of integrating direct HIV care and treatment into public health services in a region of Johannesburg. Cost Eff Resour Alloc 2019;17:24. https://10.1186/s12962-019-0192-5 [ Links ]
19. Fox MP, Rosen S. Retention of adult patients on antiretroviral therapy in low- and middle-income countries: Systematic review and meta-analysis 2008-2013. J Acquir Immune Defic Syndr 2015;69(1):98-108. https://doi.org/10.1097/QAI.0000000000000553 [ Links ]
20. Fox MP, Bor J, Brennan AT, MacLeod WB, Maskew M, Stevens WS, Carmona S. Correction: Estimating retention in HIV care accounting for patient transfers: A national laboratory cohort study in South Africa. PLoS Med 2018;15(8):e1002643. https://doi.org/10.1371/journal.pmed.1002643. Erratum for: PLoS Med 2018;15(6):e1002589. [ Links ]
21. University ofWashington. Paper health registers project case study: South Africa's 3-tiered antiretroviral treatment monitoring system country profile. www.Tech-21.org, 2014. http://uwstartcenter.org/wp-content/uploads/2015/12/START_43_HR_SouthAfricaCaseStudy_FINAL_2014-06-05.pdf (accessed 8 July 2016). [ Links ]
22. Fox MP, Brennan A, Maskew M, MacPhail P, Sanne I. Using vital registration data to update mortality among patients lost to follow-up from ART programmes: Evidence from the Themba Lethu Clinic, South Africa. Trop Med Int Health 2010;15(4):405-413. https://doi.org/10.1111/j.1365-3156.2010.02473.x [ Links ]
23. National Department of Health, South Africa. The South African Antiretroviral Treatment Guidelines 2010. Pretoria: South African National AIDS Council, 2010. https://sahivsoc.org/Files/Summary_The_South_African_Antiretroviral_Treatment_2010.pdf (accessed 1 September 2016). [ Links ]
24. Nglazi MD, Lawn SD, Kaplan R, et al. Changes in programmatic outcomes during 7 years of scale-up at a community-based antiretroviral treatment service in South Africa. J Acquir Immune Defic Syndr 2011;56(1):e1-8. https://doi.org/10.1097/QAI.0b013e3181ff0bdc [ Links ]
25. Chiliza J, Laing R, Feeley FG III, Borba CPC. Program sustainability post PEPFAR direct service support in the Western Cape, South Africa. PLoS One 2021;16(5):e0251230. https://doi.org/10.1371/journal.pone.0251230 [ Links ]
26. Gilson L, Pienaar D, Brady L, et al. Development of the health system in the Western Cape: Experiences since 1994. S Afr Health Rev 2017;2017:59-69. https://www.hst.org.za/publications/South%20African%20Health%20Reviews/6_Development%20of%20the%20health%20system%20in%20the%20Western%20Cape_experiences%20since%201994.pdf (accessed 6 December 2023). [ Links ]
27. Julien A, Anthierens S, Van Rie A, et al. Health care providers' challenges to high-quality HIV care and antiretroviral treatment retention in rural South Africa. Qual Health Res 2021;31(4):722-735. https://doi.org/10.1177/1049732320983270 [ Links ]
28. Johnson L, Dorrington RE, Moolla H. HIV epidemic drivers in South Africa: A model-based evaluation of factors accounting for inter-provincial differences in HIV prevalence and incidence trends. South Afr J HIV Med 2017;18(1):695. https://doi.org/10.4102/sajhivmed.v18i1.695 [ Links ]
29. Bengtson A, Colvin C, Kirwa K, Cornell M, Lurie MN. Estimating retention in HIV care accounting for clinic transfers using electronic medical records: Evidence from a large antiretroviral treatment programme in the Western Cape, South Africa. Trop Med Int Health 2020;5(8):936-943. https://doi.org/10.1111/tmi.13412 [ Links ]
 Correspondence:
A Brennan
abrennan@bu.edu
Accepted 8 November 2023

