


Services on Demand
Article
 English (pdf)
 Article in xml format
 Article references
Indicators

Related links
-
 Cited by Google
 -
 Similars in Google
Share

 Permalink
SAMJ: South African Medical Journal
On-line version ISSN 2078-5135
Print version ISSN 0256-9574
SAMJ, S. Afr. med. j. vol.113 n.1 Pretoria Jan. 2023
http://dx.doi.org/10.7196/SAMJ.2023.v113i1.16768
IN PRACTICE
ISSUES IN PUBLIC HEALTH
A critical analysis of Discovery Health's claims-based risk adjustment of mortality rates in South African private sector hospitals
R N RodsethI, II; D SmithIII; C MasloIV; A LaubscherIII, V; L ThabaneVI
IMB ChB, PhD; Netcare Ltd, Johannesburg, South Africa
IIMB ChB, PhD; Department of Anaesthesiology and Critical Care, College of Health Sciences, Nelson R Mandela School of Medicine, University of KwaZulu-Natal, Durban, South Africa
IIIMB ChB, MBA; Netcare Ltd, Johannesburg, South Africa
IVMD, PhD; Netcare Ltd, Johannesburg, South Africa
VMB ChB, MBA; Gordon Institute of Business Science, University of Pretoria, Sandton, South Africa
VIMSc (Statistics), PhD Department of Health Research Methods, Evidence and Impact, Faculty of Health Sciences, McMaster University, Hamilton, Ont., Canada; Biostatistics Unit, St Joseph's Healthcare Hamilton, Ont., Canada
ABSTRACT
In 2019, Discovery Health published a risk adjustment model to determine standardised mortality rates across South African private hospital systems, with the aim of contributing towards quality improvement in the private healthcare sector. However, the model suffers from limitations due to its design and its reliance on administrative data. The publication's aim of facilitating transparency is unfortunately undermined by shortcomings in reporting. When designing a risk prediction model, patient-proximate variables with a sound theoretical or proven association with the outcome of interest should be used. The addition of key condition-specific clinical data points at the time of hospital admission will dramatically improve model performance. Performance could be further improved by using summary risk prediction scores such as the EUROSCORE II for coronary artery bypass graft surgery or the GRACE risk score for acute coronary syndrome. In general, model reporting should conform to published reporting standards, and attempts should be made to test model validity by using sensitivity analyses. In particular, the limitations of machine learning prediction models should be understood, and these models should be appropriately developed, evaluated and reported.
In 2019, Discovery Health[1] published an article in the South African Medical Journal describing its use of service claims data to determine standardised mortality rates, across hospital systems, for specific clinical conditions (i.e. acute myocardial infarction, coronary artery bypass graft (CABG) surgery, pneumonia and acute stroke). The publication sought to transparently examine variations in care across hospitals in order to 'support improvement efforts in the reduction of preventable deaths associated with acute inpatient care'. This publication was the first of its kind in South Africa (SA), and represents an important step towards driving quality improvement in SA's private healthcare sector.
In this article, we conduct a critical analysis of the methodology and reporting used in the Discovery Health publication. The critique seeks to contribute towards improving the methodology, reporting and transparency of such risk adjustment models, and to widen discussion on the strengths and limitations of risk adjustment models based on service claims data. As more SA private sector medical funders explore their use, it is important that the quality of the models be improved.
Background
Risk stratification and prediction is an integral part of clinical medicine and is used for a variety of reasons. First, risk stratification and benchmarking can be used to evaluate the health outcomes of individual patients, clinicians, hospitals, systems or even countries, and becomes a powerful tool with which to improve healthcare quality. Second, for the clinician, it is useful in directing further patient investigation and treatment, as well as providing a framework against which clinical outcomes can be measured. Was the death of this patient expected? Is my rate of heart failure readmissions comparable to that of my peers? And finally, it allows patients to make informed decisions about possible treatment options. For example, is the 0.5% chance of dying during the placement of my endovascular stent outweighed by the 5% chance of having my aortic aneurysm rupture during the next year? It is, however, important to note that population-derived scores should generally not be used to assign individual risk. Rather, these scores are used to risk stratify patients into risk categories.
The more accurately the current state of a patient can be described, the more accurate prediction becomes.[2] A prediction model that uses a 'history of coronary heart disease' as a risk factor to predict death from an acute myocardial infarction (AMI) is always going to be inferior to a model that uses 'current admission to hospital for AMI' as a risk factor. However, risk factors that capture the degree of end-organ damage sustained from the current AMI, such as N-terminal B-type natriuretic peptide or troponin elevations, or the use of inotropes during admission, are much more powerful and accurate predictors than admission to hospital alone.[2,3] Similarly, in a patient with cardiac failure, an echocardiogram done at the time of hospital admission is of much greater predictive value than one done a month prior to the admission. Closer patient proximity, in terms of time and assessment of clinical condition, will generally dramatically improve the predictive ability of a risk factor.[2] To build an accurate risk model, it is therefore important to explore as many patient-proximate risk factors as possible.
However, patient proximity is not the only important factor in choosing possible risk factors. Candidate risk predictors should be determined by their clinical relevance. There should be a logical rationale, based on prior evidence or on theory, for choosing potential predictive factors on which to base risk models. These risk factors should then be statistically tested, with insignificant variables being discarded. Risk models should also seek to avoid redundancy and aim for parsimony in the variables used.[4,5]
These principles highlight the problems inherent to using administrative data for the prediction or risk stratification of patient outcomes. Administrative data are not as patient proximate as clinical data and are generally unable to capture the severity of a patient's clinical condition accurately. The relationship between commonly available administrative data points and clinical outcomes is often not as clear as that of clinical data. As a result, risk models that only use administrative data underperform risk models based on clinical data alone, as well as risk models that combine administrative and clinical data.[6-9]
The Discovery Health model methodology
Table 1 lists the factors used in risk adjustment in the model published by Discovery Health in 2019.[1]
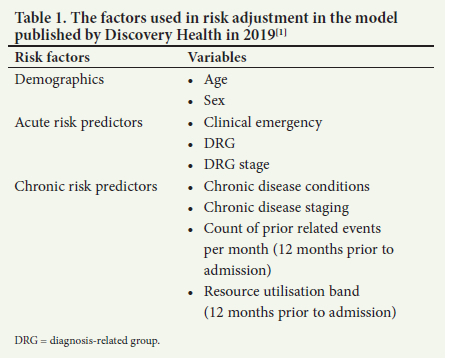
As expected, patient sex and age are included in the model. The most patient-proximate risk factor is the presence of a clinical emergency, as identified by provider billing codes. The next most proximate risk factor is the admission's base diagnosis-related group (DRG) and clinical severity, or staging. A DRG categorises patients with similar clinical diagnoses and is used to control hospital costs and determine reimbursement. Within each of these DRGs, patients are then staged according to their disease severity. To generate a picture of the patient's clinical risk history, the model uses all the patient's validated chronic conditions, along with their specific disease staging. In addition, it uses the number of prior related events and the patient's resource utilisation band for the 12 months before the admission. Using these factors, the adjusted risk for each individual patient is estimated, using a gradient-boosting machine (GBM) family of models.
The above is a common approach to building clinical risk adjustment models when only having administrative data to draw from. In this model, there are three sets of candidate risk variables that reflect proximate patient risk (i.e. clinical emergency, DRG and DRG stage), and four sets provide candidate risk variables to capture a patient's chronic risk. The article does not report on the rationale for choosing these four data sets. Furthermore, it does not explore possible redundancy between these variables, as the presence and severity of chronic disease conditions should be directly correlated to the number of times a patient would seek help for those conditions. Similarly, predicted resource utilisation would be determined by the same chronic conditions and the severity of the conditions. This raises the possibility that the poor generalised linear model (GLM) performance may be a result of variable collinearity.
A second concern is that there does not seem to be any clear hierarchy or clinical risk weighting used for the chronic predictors. Both the DRG classification system and the resource utilisation bands are designed to predict cost, as opposed to mortality risk. This approach contrasts with other risk assignment tools that are fundamentally orientated and weighted towards predicting clinical risk (i.e. the Charlson Comorbidity Index, the Elixhauser Comorbidity Index, and the Hierarchical Condition Categories (HCC) developed by the Centers for Medicare and Medicaid Services (CMS)). Interestingly, the predictive advantage of using a clinically orientated risk score has been shown in an analysis where the incorporation of DRGs into the CMS HCC risk adjustment model found that DRGs contributed 'less than a percentage point' improvement.[10]
A third concern is the model's assumptions around the effect of the individual hospital systems. After adjusting for patient risk, individual hospitals are added to the model, under the assumption that the hospital system effect 'determined by the model] represents the underlying risk of mortality at the hospital, after accounting for patient clinical risk'.'1- The results of this second analytical step are then used to classify hospitals as performing above, at, or below expected levels. As has been shown, the addition of patient-proximate clinical data significantly improves the performance of models based only on administrative data.[6-9] The assumption that patient clinical risk has been accounted for by the model is therefore incorrect. The incompleteness of the clinical risk adjustment is further highlighted by the model's heavy weighting toward chronic risk predictors that are not clinically weighted.
There are structural differences between hospitals that drive differences in patient case-mixtures. Certain hospitals offer specialised services (e.g. cardiac catheterisation, extracorporeal membrane oxygenation, trauma services, and neuro-interventions for stroke patients), making them more likely to see patients with conditions of higher acuity and complexity. These hospitals will also often serve as referral centres for patients requiring higher levels of care, and will then receive patients who have been transported by ambulance or aeromedical services. Likewise, more rural hospitals may have patients with poorer baseline health and different patterns of disease presentation.[11,12] To adjust for these factors, some models include hospital complexity as a variable, or report adjusted hospital mortality within peer-ranked categories based on size or services offered.[13] Both resource availability and geographical location are important factors to consider when attempting to compare mortality rates between SA hospitals.
Shortcomings in reporting
Discovery Health's aim of facilitating transparency is unfortunately undermined by its reporting shortcomings. The article does not provide the rationale behind the choice of variables to include into the risk models. It does not report the number of DRGs used in the model, or the range of severity represented by the Truven disease Staging groupers. The article does not identify the software used to conduct these analyses, or report the type of GBM model used, the data assumptions used in modelling the data, the choice of model hyperparameters, or the approach to hyperparameter tuning.
The article fails to report any performance metrics for any of the models. There are a range of options with which to report prediction model performance: F1 statistics for precision-recall graphs, C statistics, positive predictive value, negative predictive value, accuracy, area under the receiver operating characteristic curve, or variable importance plots. The need for such reporting is highlighted by the pneumonia precision-recall graph, which visually seems to perform worse than the other models. Without the performance metrics, these models cannot be compared meaningfully. Results should be reported with 95% confidence intervals so that the reader is able to understand their precision. Furthermore, no formal test results are presented of the comparison between the derivation and validation models. The article does not report any statistics to quantify the performance of the GBM model against the GLM. No calibrations between actual and predicted model performances are reported.
Towards building better risk prediction models
Principles of variable selection
Risk adjustment models should be parsimonious and avoid redundancy. They should aim to include candidate risk factors that have a proven association with the outcome or with a strong basis in theory. When using administrative data as a source for these factors, the first step is to include patient age and sex.
After this, factors such as the number of chronic conditions that the patient has been diagnosed with, as well as the severity of these conditions, are added to the model. In administrative models, ICD-10 codes are used to identify comorbidities and the primary and secondary admission diagnoses. As there are more than 68 000 ICD-10 codes, it is impractical to use them directly in risk models. ICD-10 codes are further limited in that they do not assign a clinical risk weighting to a diagnosis. A diagnosis of metastatic cancer is associated with a much higher chance of death than a diagnosis of an ingrown toenail, but ICD-10 codes do not capture this difference in risk. To adjust for these shortcomings, risk assignment tools have been developed.[14] These tools group key patient comorbidities into clusters and weigh diagnoses that are associated with a higher risk of death. The Charlson Comorbidity Index assigns risk points for 17 - 19 comorbidities to determine a patient's estimated 10-year chance of survival.[15] Similarly, the Elixhauser Comorbidity Index uses 30 comorbidities to predict 1-year mortality. Thus, the diagnosis of any severe liver disease will contribute 3 points to the Charlson risk score, while uncomplicated diabetes mellitus will contribute 1 point. The Elixhauser Comorbidity Index, used as a simple or weighted score, has generally been shown to outperform the Charslon Comorbidity Index.[16-18]
Models should seek to include patient-proximate variables that have a sound theoretical or proven association with the outcome of interest. These should include the reason for, and the severity of, the acute admission. The addition of key condition-specific clinical data points at the time of hospital admission would add significant value to any administrative risk model. Ideally, these would be summary risk prediction scores such as the EUROSCORE II for CABG surgery or the GRACE risk score for acute coronary syndrome (ACS). Alternatively, standardised baseline clinical data (e.g. heart rate, systolic blood pressure, electrocardiograph characteristics)[19] or general scores such as the sequential organ failure assessment score[20] could be used. Engaging with physician societies to identify key variables or risk scores to be included in minimal clinical data sets would be valuable and would greatly contribute towards meaningful and transparent outcome reporting.
Structural differences (resource availability, geographical location) between SA hospitals are an important driver of patient mortality, and should be reflected either in model development or in reporting of results.
Reporting risk prediction models
Reporting of clinical risk models should conform to published reporting standards.[5,21,22] For machine-based learning models, the following have been proposed: Transparent Reporting of a Multivariable Prediction Model for Individual Prognosis or Diagnosis (TRIPOD), Minimum Information for Medical AI Reporting (MINIMAR), and Recommendations for Reporting Machine Learning Analyses in Clinical Research.[5,21-23] The limitations of clinical risk adjustment models developed using administrative data should be clearly understood, as should the limitations of using machine learning prediction models in clinical medicine.[23] Hung et al.,[24] in their article titled 'Explainable machine learning-based risk prediction model for in-hospital mortality after continuous renal replacement initiation', provide an excellent example of how to present the development and reporting of machine learning-based predictive models.
Testing risk prediction models
A sensitivity analysis is an attractive way of testing the validity of predictive models. A sensitivity analysis tests the robustness of a model by conducting analyses under a plausible but different set of assumptions about the primary modelling process. In a GBM modelling process, as used in the Discovery Health model, rerunning an analysis excluding one of the chronic risk variable sets will therefore inform the predictive value of that variable, while also testing model robustness. Similarly, the impact of adding a variable representing hospital complexity or geographical distribution could be tested in the model.
Conclusion
The publication of the Discovery Health model to determine standardised mortality rates across SA private hospital systems aimed to contribute towards quality improvement. However, the model suffers from limitations due to its design and its reliance on administrative data. Its aim to facilitate transparency is unfortunately undermined by reporting shortcomings.
When designing a risk prediction model, patient-proximate variables with a sound theoretical or proven association with the outcome of interest should be used. The addition of key condition-specific clinical data points at the time of hospital admission will dramatically improve model performance, and this could be further improved by using summary risk prediction scores such as the EUROSCORE II for CABG surgery or the GRACE risk score for ACS. In general, model reporting should conform to published reporting standards and attempts should be made to test model validity by using sensitivity analyses. In particular, the limitations of machine learning prediction models should be understood, and these models should be appropriately developed, evaluated and reported.[23]
Declaration. None.
Acknowledgements. None.
Author contributions. RNR, DS and AL conceptualised the analysis, and RNR, DS and AL drafted the first version of the manuscript with input from CM, and LT. Further analytical input was then provided by CM and LT. The final version was reviewed and approved by all authors.
Funding. None.
Conflicts of interest. Netcare Ltd owns hospitals rated by the Discovery Health risk adjustment model being critiqued in this article.
References
1. Moodley Naidoo R, Timothy GA, Steenkamp L, Collie S, Greyling MJ. Measuring quality outcomes across hospital systems: Using a claims data model for risk adjustment of mortality rates. S Afr Med J 2019;109(5):299-305. https://doi.org/10.7196/SAMJ.2019.v109i5.13775 [ Links ]
2. Biccard BM, Rodseth RN. Utility of clinical risk predictors for preoperative cardiovascular risk prediction. Br J Anaesth 2011;107(2):133-143. https://doi.org/10.1093/bja/aer194 [ Links ]
3. Rodseth RN, Biccard BM, Le Manach Y, et al. The prognostic value of pre-operative and post-operative B-type natriuretic peptides in patients undergoing noncardiac surgery: B-type natriuretic peptide and N-terminal fragment of pro-B-type natriuretic peptide: A systematic review and individual patient data meta-analysis. J Am Coll Cardiol 2014;63(2):170-180. https://doi.org/10.1016/j.jacc.2013.08.1630 [ Links ]
4. Leisman DE, Harhay MO, Lederer DJ, et al. Development and reporting of prediction models: Guidance for authors from editors of respiratory, sleep, and critical care journals. Crit Care Med 2020;48(5):623-633. https://doi.org/10.1097/CCM.0000000000004246 [ Links ]
5. Collins GS, Reitsma JB, Altman DG, Moons KGM; members of the TRIPOD group. Transparent Reporting of a Multivariable Prediction Model for Individual Prognosis or Diagnosis (TRIPOD): The TRIPOD Statement. Eur Urol 2015;67(6):1142-1151. https://doi.org/10.1016/j.eururo.2014.11.025 [ Links ]
6. Shahian DM, Silverstein T, Lovett AF, Wolf RE, Normand SL. Comparison of clinical and administrative data sources for hospital coronary artery bypass graft surgery report cards. Circulation 2007;115(12):1518-1527. https://doi.org/10.1161/CIRCULATIONAHA.106.633008 [ Links ]
7. Subramanian MP, Hu Y, Puri V, Kozower BD. Administrative versus clinical databases. J Thorac Cardiovasc Surg 2021;162(4):1173-1176. https://doi.org/10.1016/j.jtcvs.2020.03.183 [ Links ]
8. Hanchate AD, Stolzmann KL, Rosen AK, et al. Does adding clinical data to administrative data improve agreement among hospital quality measures? Healthc (Amst) 2017;5(3):112-118. https://doi.org/10.1016/j.hjdsi.2016.10.001 [ Links ]
9. Rhee C, Wang R, Song Y, et al. Risk adjustment for sepsis mortality to facilitate hospital comparisons using Centers for Disease Control and Prevention's Adult Sepsis Event criteria and routine electronic clinical data. Crit Care Explor 2019;1(10):e0049. https://doi.org/10.1097/CCE.0000000000000049 [ Links ]
10. Pope GC, Kautter J, Ingber MJ, Freeman S, Sekar R, Newhart CN. Evaluation of the CMS-HCC Risk Adjustment Model. https://www.cms.gov/Medicare/Health-Plans/MedicareAdvtgSpecRateStats/downloads/evaluation_risk_adj_model_2011.pdf (accessed 5 August 2022). [ Links ]
11. Heathcote K, Devlin A, McKie E, et al. Rural and urban patterns of severe injuries and hospital mortality in Australia: An analysis of the Australia New Zealand Trauma Registry: 2015 - 2019. Injury 2022;53(6):1893-1903. https://doi.org/10.1016/j.injury.2022.03.044 [ Links ]
12. Fleet R, Bussieres S, Tounkara FK, et al. Rural versus urban academic hospital mortality following stroke in Canada. PLoS ONE 2018;13(1):e0191151. https://doi.org/10.1371/journal.pone.0191151 [ Links ]
13. Ben-Tovim D, Woodman R, Harrison JE, Pointer S, Hakendorf P. Measuring and reporting mortality in hospital patients. Cat. No. HSE 69. Canberra: Australian Institute of Health and Welfare, 2009. https://www.safetyandquality.gov.au/sites/default/files/migrated/Me asuring-and-reporting-hospital-mortality-in-patients.pdf (accessed 5 August 2022). [ Links ]
14. Austin SR, Wong YN, Uzzo RG, Beck JR, Egleston BL. Why summary comorbidity measures such as the Charlson Comorbidity Index and Elixhauser score work. Med Care 2015;53(9):e65-e72. https://doi.org/10.1097/MLR.0b013e318297429c [ Links ]
15. Charlson ME, Carrozzino D, Guidi J, Patierno C. Charlson Comorbidity Index: A critical review of clinimetric properties. Psychother Psychosom 2022;91(1):8-35. https://doi.org/10.1159/000521288 [ Links ]
16. Sharma N, Schwendimann R, Endrich O, Ausserhofer D, Simon M. Comparing Charlson and Elixhauser comorbidity indices with different weightings to predict in-hospital mortality: An analysis of national inpatient data. BMC Health Serv Res 2021;21:13. https://doi.org/10.1186/s12913-020-05999-5 [ Links ]
17. Chang HJ, Chen PC, Yang CC, Su YC, Lee CC. Comparison of Elixhauser and Charlson methods for predicting oral cancer survival. Medicine (Baltimore) 2016;95(7):e2861. https://doi.org/10.1097/MD.0000000000002861 [ Links ]
18. Zhang F, Chiu Y, Ensor J, Mohamed MO, Peat G, Mamas MA. Elixhauser outperformed Charlson comorbidity index in prognostic value after ACS: Insights from a national registry. J Clin Epidemiol 2022;141:26-35. https://doi.org/10.1016/j.jclinepi.2021.08.025 [ Links ]
19. Johnston TC, Coory MD, Scott I, Duckett S. Should we add clinical variables to administrative data? The case of risk-adjusted case fatality rates after admission for acute myocardial infarction. Med Care 2007;45(12):1180-1185. https://doi.org/10.1097/MLR.0b013e318148477c [ Links ]
20. Aoyama D, Morishita T, Uzui H, et al. Sequential organ failure assessment score on admission predicts long-term mortality in acute heart failure patients. ESC Heart Fail 2020;7(1):244-252. https://doi.org/10.1002/ehf2.12563 [ Links ]
21. Hernandez-Boussard T, Bozkurt S, Ioannidis JPA, Shah NH. MINIMAR (MINimum Information for Medical AI Reporting): Developing reporting standards for artificial intelligence in health care. J Am Med Inform Assoc 2020;27(12):2011-2015. https://doi.org/10.1093/jamia/ocaa088 [ Links ]
22. Stevens LM, Mortazavi BJ, Deo RC, Curtis L, Kao DP. Recommendations for reporting machine learning analyses in clinical research. Circ Cardiovasc Qual Outcomes 2020;13(10):e006556. https://doi.org/10.1161/CIRCOUTCOMES.120.006556 [ Links ]
23. Collins GS, Moons KGM. Reporting of artificial intelligence prediction models. Lancet 2019;393(10181):1577-1579. https://doi.org/10.1016/S0140-6736(19)30037-6 [ Links ]
24. Hung PS, Lin PR, Hsu HH, Huang YC, Wu SH, Kor CT. Explainable machine learning-based risk prediction model for in-hospital mortality after continuous renal replacement therapy initiation. Diagnostics (Basel) 2022;12(6):1496. https://doi.org/10.3390/diagnostics12061496 [ Links ]
 Correspondence:
R N Rodseth
reitze.rodseth@netcare.co.za
Accepted 29 August 2022.

