


Serviços Personalizados
Artigo
 Inglês (pdf)
 Artigo em XML
 Referências do artigo
Indicadores

Links relacionados
-
 Citado por Google
 -
 Similares em Google
Compartilhar

 Permalink
SAMJ: South African Medical Journal
versão On-line ISSN 2078-5135
versão impressa ISSN 0256-9574
SAMJ, S. Afr. med. j. vol.112 no.2 Pretoria Fev. 2022
http://dx.doi.org/10.7196/SAMJ.2022.v112i2.15797
RESEARCH
Guiding equitable piioiitisation of COVID-19 vaccine distribution and strategic deployment in South Africa to enhance effectiveness and access to vulnerable communities and prevent waste
W OvensI; S TomescuII; E HarrisonIII; T CromptonIV; A de NooyV; W JassatVI; S BanooVII, VIII; P PisaIX, X; I SanneXI
IBSocSc, MTRP; Right to Care, Centurion, Pretoria, South Africa
IIBSocSc, MTRP; Right to Care, Centurion, Pretoria, South Africa
IIIBSc, MB BChir; Right to Care, Centurion, Pretoria, South Africa
IVBSc, MSc; Right to Care, Centurion, Pretoria, South Africa
VBEngSc, BSc (Eng); Right to Care, Centurion, Pretoria, South Africa
VIMB BCh, MMed (PHM); National Institute for Communicable Diseases, National Health Laboratory Service, Johannesburg, South Africa
VIIBPharm, PhD; Right to Care, Centurion, Pretoria, South Africa
VIIIBPharm, PhD; Department of Pharmacy and Pharmacology, School of Therapeutic Sciences, Faculty of Health Sciences, University of the Witwatersrand, Johannesburg, South Africa
IXBSc, PhD; Right to Care, Centurion, Pretoria, South Africa
XBSc, PhD; Department of Human Nutrition and Dietetics, School of Healthcare Sciences, Faculty of Health Sciences, University of Pretoria, South Africa
XIMB BCh, PhD; Right to Care, Centurion, Pretoria, South Africa
ABSTRACT
BACKGROUND. In South Africa (SA), >2.4 million cases of COVID-19 and >72 000 deaths were recorded between March 2020 and 1 August 2021, affecting the country's 52 districts to various extents. SA has committed to a COVID-19 vaccine roll-out in three phases, prioritising frontline workers, the elderly, people with comorbidities and essential workers. However, additional actions will be necessary to support efficient allocation and equitable access for vulnerable, access-constrained communities.
OBJECTIVES. To explore various determinants of disease severity, resurgence risk and accessibility in order to aid an equitable, effective vaccine roll-out for SA that would maximise COVID-19 epidemic control by reducing the number of COVID-19 transmissions and resultant deaths, while at the same time reducing the risk of vaccine wastage.
METHODS. For the 52 districts of SA, 26 COVID-19 indicators such as hospital admissions, deaths in hospital and mobility were ranked and hierarchically clustered with cases to identify which indicators can be used as indicators for severity or resurgence risk. Districts were then ranked using the estimated COVID-19 severity and resurgence risk to assist with prioritisation of vaccine roll-out. Urban and rural accessibility were also explored as factors that could limit vaccine roll-out in hard-to-reach communities.
RESULTS. Highly populated urban districts showed the most cases. Districts such as Buffalo City, City of Cape Town and Nelson Mandela Bay experienced very severe first and second waves of the pandemic. Districts with high mobility, population size and density were found to be at highest risk of resurgence. In terms of accessibility, we found that 47.2% of the population are within 5 km of a hospital with >50 beds, and this percentage ranged from 87.0% in City of Cape Town to 0% in Namakwa district.
CONCLUSIONS. The end goal is to provide equal distribution of vaccines proportional to district populations, which will provide fair protection. Districts with a high risk of resurgence and severity should be prioritised for vaccine roll-out, particularly the major metropolitan areas. We provide recommendations for allocations of different vaccine types for each district that consider levels of access, numbers of doses and cold-chain storage capability.
As of 1 August 2021, 15 months after the first COVID-19 infections in South Africa (SA), the country had recorded 2 447 454 cases and 72 013 deaths.[1] The pandemic experience has varied across the nine provinces, with each province demonstrating different dynamics and challenges in the face of the virus. Eastern Cape Province, for example, with 11.3% of the country's population, has contributed 12.8% of all cases nationwide but 22.2% of all deaths. Most districts in North West and Northern Cape provinces, on the other hand, demonstrated shorter and less dramatic first and second pandemic waves than districts in other provinces[1]
SA districts and provinces also vary significantly with regard to levels of urbanisation, settlement types in deep rural areas, population density, transport infrastructure, and socioeconomic and medical insurance status. These factors can affect resource allocation and access to healthcare, specialised emergency services and other basic services.[2-4] Furthermore, urban settings were associated with an increased risk of diabetes in persons aged >50 years,[5l and, unsurprisingly, lifestyle-related conditions were found to be more common among the poor.[6]
Combined, these factors raise questions as to how COVID-19 vaccines should be distributed to ensure equitable access for all, while also having the greatest impact on the pandemic spread. However, good-quality health systems data are not always available, in which case indicators of socioeconomic and demographic deprivation can become useful in guiding the equitable allocation of resources.[2]
All things considered, a tailored yet effective and efficient vaccine strategy and roll-out plan for SA will be critical in achieving epidemic control.
SA is implementing the vaccine roll-out in three phases, based on the vulnerability of the population, and aimed to vaccinate 67% of the population by the end of 2021. Phase 1 of the vaccine roll-out was targeted at healthcare workers, to compensate for the increased exposure to infected people and the higher risk of contracting the virus; phase 2 targeted essential workers and persons aged >60 years, or >18 years with comorbidities including TB and HIV, because these factors were independently associated with higher COVID-19 lethality;[7,8] and phase 3 accommodates all persons aged >18 years.[9]
Initially, the Oxford AstraZeneca vaccine (AZ) was to be used, which has the advantage of easily manageable cold-chain requirements and a reasonable shelf life (6 months refrigerated),[10] making it an ideal vaccine for a resource-constrained country such as SA. However, the vaccine was demonstrated to have limited efficacy against the 501Y.V2 (B.1.351) variant,[11-13] which emerged with the second wave in Nelson Mandela Bay to rapidly become the most prevalent variant in SA.[141 Considering this limited efficacy, the National Department of Health decided not to proceed with the AZ vaccine,[15] opting instead to roll out the Johnson & Johnson (J&J) and Pfizer-BioNTech (Pfizer) vaccines in the short term.[16,17] Although the J&J vaccine is a spike protein vaccine, it has vaccine efficacy of 52% (prevent infection), 64% (prevent severe disease) and 100% (prevent mortality) at a 95% confidence interval for onset after vaccination of at least 14 days and at least 28 days, respectively.[18] In the absence of better efficacy, J&J may be the best option for SA for now.[19]
The J&J vaccine, as an alternative to the AZ vaccine, with improved variant protection,[18] has similar cold-chain requirements as well as the added benefit of being a single-dose vaccine. While the vaccine remains stable at temperatures between -25°C and -15°C for up to 2 years, it may also be stored at routine refrigeration temperatures of 2 - 8°C for a maximum of 3 months, allowing for simpler distribution and storage at vaccination sites. The vaccine should not be re-frozen if distributed at temperatures of 2 - 8°C. Punctured vials are required to be used within 6 hours if stored at 2 - 8°C or within 2 hours if stored at room temperature.[20] The Pfizer vaccine requires more complex cold-chain management. The vaccine is stable for up to 6 months if stored in an ultra-cold freezer at temperatures between -90°C and -60°C. Furthermore, recent regulatory label updates, based on additional stability data, enable the vaccine to be stored at standard freezer temperatures of -25°C to -15°C for a maximum period of 2 weeks, potentially offering vaccination sites greater flexibility in managing and maintaining vaccine distribution and supply.[21] The undiluted vaccine vials may also be stored at vaccination sites for a further 31 days at 2 - 8°C. Dilution with saline is required and, once mixed, the vaccine can be left at room temperature for up to 6 hours.[22] At the time of writing (April 2021), SA had procured 30 million doses of the J&J vaccine and 30 million doses of the Pfizer vaccine.[16,17,23] SA is therefore likely to administer multiple vaccine types from phase 2 onwards to reach herd immunity across the population, and this approach creates both opportunities and challenges. Each vaccine's storage requirements and deployment logistics, as well as dose schedules and planned dosing intervals, will differ and will require significant effort and co-ordination between national and provincial governments along with the private sector to ensure the effective implementation of the vaccine roll-out strategy with minimal wastage.
Mathematical modelling for the prioritisation of vaccines in low- to middle-income countries is largely in favour of using a short supply of vaccines to target vulnerable populations such as the elderly and/or those with comorbidities putting them at risk. When a supply of vaccines is larger, targeting epicentres key to transmission of disease is a more protective approach to vulnerable populations, although indirect.[24] However, the elderly was not the risk population targeted for vaccination in some countries such as Indonesia, which targeted people aged <60 years.[25] Local studies have addressed the need to prioritise risk groups specific to SA, such as individuals with TB and HIV, alongside the internationally accepted criteria of old age, hypertension and diabetes.[7,26] Further concerns regarding vaccination hesitancy in SA were addressed as well.[27] Nevertheless, the geographical partitioning and distribution of vaccines above the scope of vulnerable or exposed populations remain largely unexplored.
Assessing the impact of the COVID-19 pandemic on each of the districts of SA to identify pandemic patterns across the country helps identify districts that are epicentres. With this information, the prioritisation of vaccine distribution to fast-track herd immunity in epicentres, where more lives could be protected, pandemic spread reduced and vulnerable populations protected indirectly, becomes increasingly possible. International studies have described the principal components of the pandemic as they occurred by hierarchical clustering to identify patterns of the pandemic across geographical areas, both chronologically and by indicator[28,29]
Objectives
In this article, we analyse the factors for consideration when determining vaccine type and distribution strategy for a particular demographic, socioeconomic condition, and geography at district level in SA, based on hierarchical clustering. This approach provides an alternative method for geographical prioritisation of vaccination that is complementary to the targeting of vaccination to risk groups. Our objective is to explore various determinants to enhance an equitable, effective and efficient vaccine roll-out for SA, and thereby to maximise COVID-19 epidemic control by reducing the number of COVID-19 transmissions and resultant deaths. In the 'Methods' section, we reference specific districts, data and analyses that serve as proxies for the COVID-19 pandemic. Similar methodology could be suitable for use in countries in sub-Saharan Africa with similar vulnerability profiles.
Methods
Study design
This study explored the propagation of COVID-19 cases and patterns of the pandemic in SA at district level, along with social vulnerability and accessibility using ranking to mathematically model the data, to help formulate the roll-out plan for vaccines across the country's 52 districts. The ability to distinguish and predict differences at district level regarding the risk of infection resurgence and the severity of pandemic impact can help strategise for the effective and equitable deployment of the appropriately selected vaccines across SA. The ability to identify districts at high risk of resurgence and/or severity of COVID-19 impact could allow the targeting of epicentres for vaccination, alongside the constant revision and allocation of resources to help improve local health services. Several indicators have been included in this study to appraise COVID-19 infection levels and the severity of the infections in each of the districts to inform vaccine strategy.
Data sources
Data related to COVID-19 cases were provided by the National Institute for Communicable Diseases (NICD) weekly case report, while hospital admissions and hospital-based deaths were acquired from the NICD through the DATCOV National Hospital Surveillance system.
Mobility data for the 52 districts of SA were provided by IRL Consulting (https://irlconsult.com/). Mobility data were aggregated from 1 September 2020 to 30 December 2020 for network analysis to represent overall mobility inside and outside each district. The social vulnerability index (SVI) was developed based on several indicators and is described further on in the 'Methods' section.
Ethical considerations
The study posed minimal risk to participants, as the information is publicly available, anonymised and aggregated to a district level. Ethics approval for DATCOV hospital data was obtained from the University of the Witwatersrand Human Research Ethics Committee (ref. no. M2010108 MED20-10-093).
Approach and analysis
Fifteen indicators were assessed for correlation with COVID-19 cases during the first (before 1 October 2020) and second (after 1 October 2020) waves of the pandemic in SA, listed in the 'Indicator' column of Table 1. Indicators such as numbers of cases, hospital admissions and deaths (hospital bed deaths), mobility inside district and mobility outside district were also standardised by 100 000 population, generating 11 indicators which are listed in the 'Standardised per 100 000 population' column of Table 1. Overall, 26 indicators were selected for this study. Population size and density were obtained from GeoTerralmage.[30] The indicators presented in this study have been used in the literature to model and identify patterns of transmission of the COVID-19 pandemic. Clinical and demographic indicators such as those related to COVID-19 cases, hospitalisations and deaths, population size and density have been used, not always together, at a global level and locally in SA.[7,28,31-33] Social vulnerability is widely accepted to be associated with disparate COVID-19 impact in communities,[34,35] resembling the historical association with death caused by infections in general.[36] Social vulnerability is also an important consideration in vaccination.[37,38] Mobility has been used to indicate that mass gatherings can act as key events resulting in global spread, and similarly, at granular level, some key points of interest associated with shopping and religious settings act as 'superspreader events' for COVID-19 transmission for a majority of cases at the beginning of outbreaks.[39-41]

The indicators were normalised by ranking among the 52 districts of SA. Normalisation by ranking was the method of choice because, firstly, the data were not normally distributed and indicator ranges were very diverse, and secondly, normalisation allows equitable consideration of districts based on ranking of severity and infection level, allowing equitable prioritising of epicentres in SA.
Ranked indicators were then grouped according to hierarchical clusters and averaged to represent either COVID-19 severity or resurgence risk. Indicator choice grouping was assisted by hierarchical clustering using the 'pheatmap' package[42] in R 4.0.4.[43] Hierarchical clustering was used for correlating indicators with COVID-19 cases and clustering districts with similar ranks for the indicators used. Hierarchical clustering begins with treating each observation as a single cluster and then merging individual observations into larger clusters based on the shortest pairwise distance/difference between observations. Iterations continue until the distance between the formed clusters does not improve. The length of the branches of the dendrograms represent the pairwise distance between observations and clusters.
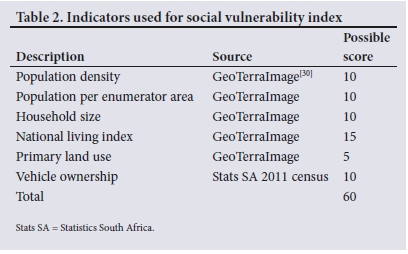
The SVI is weighted at enumerated area (EA) by population size, population density, household size, economic status (National Living Index), and reliance on public transport (Table 2). Each EA was given a ranking based on the decile that it fell within for each indicator. The total scores were then adjusted to fall within the range of 0 to 1, with a low SVI score indicating higher social vulnerability.
To determine the areas where a vaccine that requires -20°C storage would be optimally suited, we assumed that areas that have a hospital with >50 beds (68% of hospitals) would serve as good proxies for cold-chain storage capacity. We further calculated the combined catchment population within 5 km of these hospitals to determine the population that could be reached by vaccines with stricter cold-chain requirements and a multi-dose schedule such as the Pfizer vaccine. The population reachable was calculated as the populations of EAs that have a centroid within 5 km of the healthcare facilities that could have capacity (>50 beds) to vaccinate surrounding communities.
Results
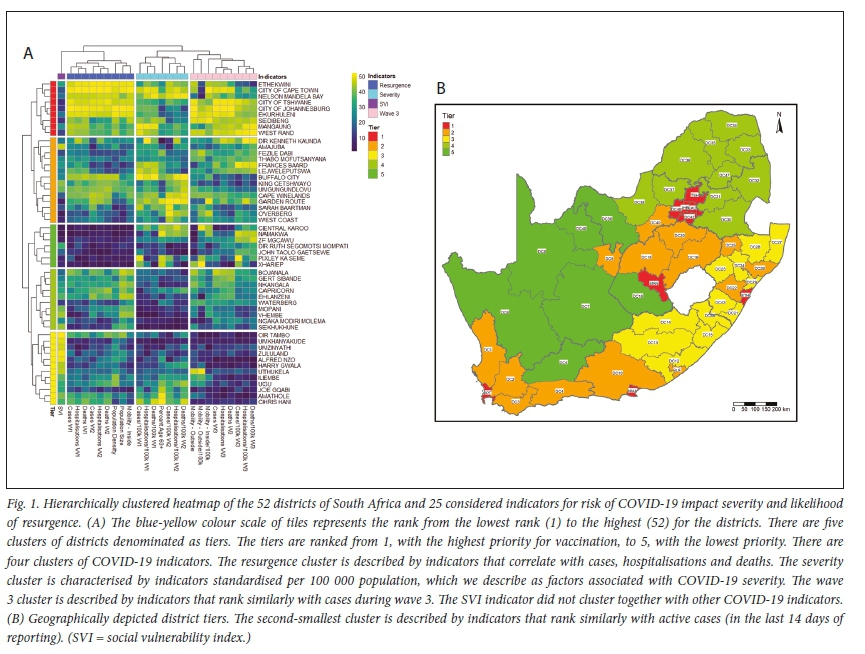
Cumulative cases, hospitalisations and deaths, standardised per 100 000 population, for the first and second wave of the pandemic were hierarchically clustered together and were selected as indicators representative of the severity of the pandemic (Fig. 1). On the other hand, cumulative cases, hospitalisations and deaths for the first and second waves were clustered together with mobility inside of district, population size and population density (Fig. 1). These indicators were selected to indicate risk of resurgence of the pandemic. The average rank for the indicators for severity and resurgence are shown in Fig. 2A and B. The 52 districts formed 5 distinct hierarchical clusters, denominated as tier 1 to tier 5 districts. The 9 districts in the top cluster (tier 1) rank highly across most indicators, including population size and COVID-19 cases, as well as when standardised by 100 000 population. The second tier (tier 2) is characterised by cases and severity during all three waves of the pandemic, at a lower overall rank than tier 1. The third tier is characterised by low resurgence for waves 1 and 2 with elevated severity, while for wave 3, resurgence and severity indicators rank considerably higher. The fourth tier is characterised by medium ranking resurgence with low severity. The lowest tier (tier 5) is more sparsely populated, and similarly, the numbers of COVID-19 cases are lower and outside mobility is also low, although when standardised per 100 000 population, some of the districts rank higher for the COVID-19 clinical indicators, cumulative cases, hospitalisations and deaths for the first and second waves of the pandemic.

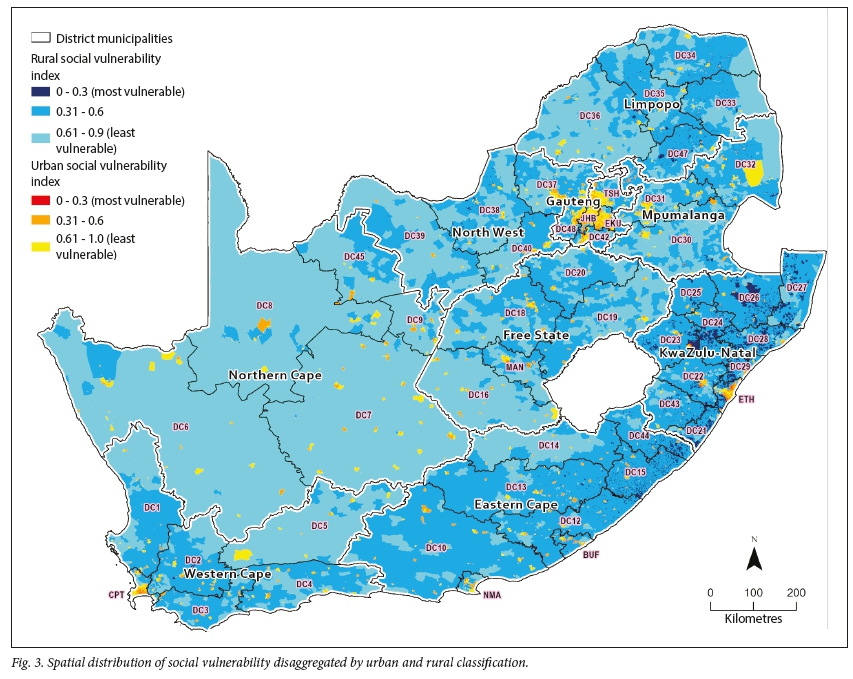
As an additional and yet critical factor, social vulnerability was calculated and disaggregated for urban and rural areas, given that in urban areas, most of the population lives within 5 km of a healthcare facility and/or residents can easily access public transport and get to a healthcare facility. In rural areas, many residents fall outside the 5 km distance to a healthcare facility, and reliance on public transport is increased (Fig. 3). The map in Fig. 3 shows that there is urban and rural variability across the districts in SA, with the metropolitan municipalities showing the highest proportion of urban populations. Secondly, the map highlights the variation within districts across urban/rural spread and social vulnerability.
The risk of severity and resurgence, population size, vaccination tier, and the proportion of the population that could be reached with vaccines with stricter cold-chain requirements and multi-dose schedules such as the Pfizer vaccine ('Pfizer, %') for each district are described in Table 3. The most severely affected districts were Buffalo City, Nelson Mandela Bay, Garden Route, City of Cape Town, eThekwini and West Rand. The districts most at risk of resurging with numerous cases were City of Johannesburg, Ekurhuleni, eThekwini, City of Tshwane, City of Cape Town and West Rand. The top five districts for resurgence risk are urban, and they are also the five most populated districts of SA. A resurgence risk provides a priority-based cueing system for vaccine distribution in the event that vaccines are not readily available to be distributed simultaneously. In Table 3, the tiers are representative of hierarchical clusters in Fig. 1, and further classified by urban/rural status.
Distribution of single-dose and multi-dose vaccines
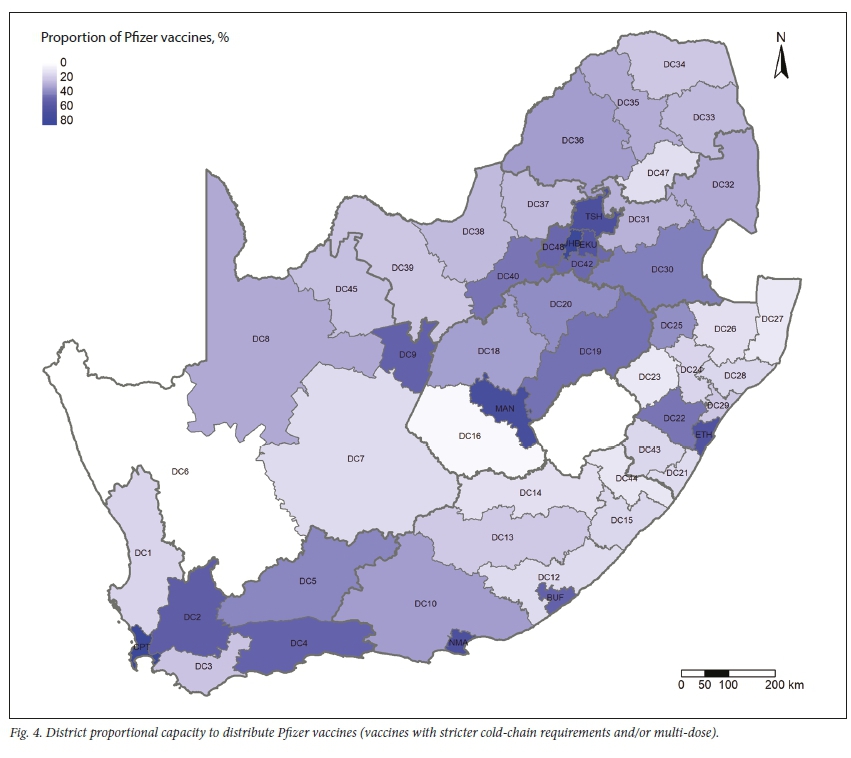
Over 27 million people live within 5 km of a hospital with >50 beds, which equates to 47.2% of the population. This proportion of Pfizer allocation ranges from City of Cape Town, which is the district with the highest proportion (86%), to Namakwa district (0%), which is suggested to only handle vaccines which require a cold chain that is easier to accommodate and are single dose, such as the J&J vaccine. The eight urban metropolitan municipalities have the highest proportion of Pfizer allocation and are suggested to receive the majority of the Pfizer vaccines. Interestingly, there are some non-metropolitan districts with relatively high proportions of Pfizer allocation, such as Garden Route and Cape Winelands (55% and 51%, respectively).
Discussion
Beyond simple choice of vaccine based on variant sensitivity, choice of vaccines is of great importance in resource-constrained settings such as those that exist in SA, given the inherent logistics and distribution challenges, cold-chain storage requirements and short shelf-life constraints. These factors need to be borne in mind, in addition to variant protection, and would require additional infrastructure and human resource investments to ensure that equal and equitable distribution can be achieved. In this article we provide a novel approach to consider how vaccines can be equitably distributed in resource-constrained settings such as SA. We showed that COVID-19 data can be used to prioritise districts for vaccine roll-out and used geographical accessibility to highlight districts that should receive two-dose vaccines.
We found that COVID-19 severity risk, COVID-19 resurgence risk, urban and rural vulnerability, and geographical accessibility were all important factors to consider when determining how to guide equitable access to the two available vaccine types across districts in SA.
The data examined here provide several insights into the co-ordination of vaccine roll-out and general pandemic management across SA going forward. Firstly, the number of cases correlates with the population size and density of the district, with most cases having been recorded among the urban districts with the largest population sizes (Fig. 1 and Table 3). While this finding is not surprising, it does give a reason for equal distribution of vaccines per capita, in that the proportion of vaccines distributed to districts should be proportional to the population size of the districts. Further, population density on its own was not considered a risk factor, as found in another study.[33] However, we found that the districts with the highest ranking prevalence have both high-ranking population size and density, suggesting that in highly populated areas with high population density, COVID-19 prevalence ranks high as well. In our findings we also present tiers of districts for vaccine prioritisation apart from the pandemic indicators.
Severity risk highlights which districts coped poorly with the first and second waves, flagging them for intervention for improvements in the healthcare system. The timing and severity of the COVID-19 impact differed significantly between districts and provinces across the country. For example, many of the districts in Western Cape, Eastern Cape and KwaZulu-Natal provinces, near the coastline of SA, experienced severe COVID-19 impact during the first and second waves (Fig. 2A). In the short term, disease surveillance systems, contact tracing, communication strategies, infrastructure and quality of healthcare improvement, in addition to vaccination strategies, need to be implemented with diligence. Thirdly, resurgence indicators showed which districts are at most risk of a third wave, considering that the same districts had high-ranking outbreaks for the first and second waves of the pandemic. These should be targeted for priority roll-out to reduce spread and minimise losses (Fig. 2). Third-wave indicators, a wave that was ongoing at the time of writing, were hierarchically clustered with mobility outside a district, probably indicating that COVID-19 cases initiate in districts with elevated travel outside.
However, cases build up in greater part as a result of mobility inside districts, as observed by the clustering of indicators of complete waves with mobility inside districts (Fig. 1). In the current situation there are insufficient vaccines and vaccinators available to cover an entire district at the same time. To make the best use of available resources, the methodology presented here could be extended to investigate within a district so that higher-priority areas can start vaccinations first using the most appropriate type of vaccine.
Then, in addition to population size, severity and resurgence risk within each district, particularly at the more granular level, and social vulnerability and health facility access should be considered when determining the vaccine type. Single-dose vaccines may be more appropriate for vulnerable populations that cannot easily get access to a second dose. In rural areas, many residents fall outside the 5 km distance to a healthcare facility, and the reliance on public transport is increased together with social vulnerability. In those rural areas, mobile vaccination sites and transport adequate for unpaved roads would need to be provided to vaccinate communities that are hard to reach. In the end, a combination of official vaccination sites and ad hoc vaccination sites at schools, stadiums and other large venues that are generally easy to access will have to be implemented[44]
In terms of ease of vaccine roll-out, with regard to cold-chain requirements, there are only 8 urban districts in South Africa, mostly classified in tier lu, and an additional 3 districts with >50% proportion of Pfizer allocation. In these districts, the vaccines with strict cold-chain requirements or those requiring multiple doses should be distributed, like Pfizer which requires storage at -20°C for a maximum of 2 weeks and is viable for only 5 days when stored at standard refrigeration temperatures[10,21] (Fig. 4). While 44 of the districts are classified as rural, in most districts there is still estimated capacity for some Pfizer vaccines, for example in Z F Mgcawu (DC8) and Umkhanyakude (DC27) (Figs 3 and 4). This capacity of rural districts to accommodate the administration of vaccines with strict cold-chain requirements and two-dose schedules may allow more of these vaccines to be rolled out in the accessible areas of rural districts, which may be transmission hotspots because they attract numerous individuals in concentrated areas[45]
Ultimately, Pfizer vaccines should be distributed according to the proportion of the population that has good access to potential vaccine sites, allowing for minimal wastage and accessibility of the second dose for the surrounding population. Even in urban areas, good vaccine logistics and supply chain co-ordination are necessary to enhance optimal utilisation at sites, as even these districts have some areas with more vulnerable individuals with limited access to vaccination sites.[19]
In summary, we have presented several factors to consider when determining equal and equitable vaccine roll-out to districts in SA based on numerous COVID-19 indicators and accessibility. These approaches can guide national and provincial governments on how to determine the optimal allocation of vaccines based on COVID-19 risk, vaccine type, dose number and cold-chain storage requirements to ensure minimal wastage and prevent the most deaths.
Study limitations
Regarding data availability, a limitation of this study is that we did not have information on which vaccine sites would be used by each district, and what each site's cold-chain storage capacity was. Once districts have suggested potential sites and conducted facility cold-chain capacity audits, further work can be done to determine a more precise allocation of vaccine types. A further limitation is that we did not have access to seroprevalence data that could be factored into the resurgence risk calculation, as some level of herd immunity may decrease a district's resurgence risk. Nevertheless, new variants have been shown to replace the old ones systematically, and to our knowledge the location and time of emergence of new variants cannot be predicted yet. Concern is already mounting over the emergence of variants with resistance to the immunity provided by vaccines, with possibly increased virulence and transmissibility.[46]
The DATCOV data have a noted limitation, as not all hospitals report completely accurately and timeously on the system, affecting data on the reported hospital admissions and hospital-based deaths.
The methodology presented in this study applies mathematical modelling to risk ranking and estimation of cold-chain capability, which means that a general output is not predicted per se. However, we are describing the factors that rank high together with cases and deaths. This methodology is also limited by the occurrence of cases in districts during the first waves, i.e. if cases did not develop during the first waves, the risk ranking reflected low risk, regardless of later developments. This limitation is unavoidable, as the pandemic did not start everywhere simultaneously while analysis had to have a start date, but must still be borne in mind when considering the risk ranking of those regions that were relatively unaffected by the first wave. In light of this, the methodology here may produce more accurate risk ranking with more data from future pandemic waves.
Conclusions
Equal distribution of vaccines proportional to district populations will provide fair protection across SA. Districts with a high risk of resurgence and severity should be equitably prioritised for vaccination under limited vaccine availability. We found that indicators such as cases, hospitalisations and deaths alongside population size and density can identify the districts more prone to resurge. Districts that experienced severe impact from the COVID-19 pandemic, without high prevalence, need support to improve the accessibility and quality of healthcare in addition to vaccination. Using resurgence and severity indicators, this study was able to apply these risk factors to rank or prioritise districts for vaccine distribution. Vaccine types should be allocated to districts based on their levels of accessibility to vaccine sites with appropriate cold-chain storage requirements.
Declaration. None.
Acknowledgements. None.
Author contributions. WO conceptualised the study. ST, EH and TC were involved with analyses, visual production and manuscript preparation. AdN provided analyses and visuals that built up to the finalisation of the study. WJ, SB, PP and IS were involved in manuscript review and planning.
Funding. This study was made possible by the generous support of the American people through the United States Agency for International Development (USAID), EQUIP No. AID-OAA-A-15-00070. The contents have been prepared by and are the responsibility of Right to Care and do not necessarily reflect the views of USAID or the US Government. The information provided in this article is not official US government information and does not necessarily reflect the views or positions of the US President's Emergency Plan for AIDS Relief (PEPFAR), the US Agency for International Development, or the US Government. We are grateful to Right to Care for covering the salaries of WO, ST, EH, TC, AdN, PP and IS.
Conflicts of interest. None.
References
1. National Department of Health, South Africa. COVID-19 Online Resource and News Portal. https://sacoronavirus.co.za/ (accessed daily from 8 March 2020 to 3 July 2021). [ Links ]
2. McIntyre D, Muirhead D, Gilson L. Geographic patterns of deprivation in South Africa: Informing health equity analyses and public resource allocation strategies. Health Policy Plan 2003;17(Suppl):30-39. https://doi.org/10.1093/heapol/17.suppl_1.30 [ Links ]
3. Harris B, Goudge J, Ataguba JE, et al. Inequities in access to health care in South Africa. J Public Health Policy 2011;32(Suppl 1):S102-S123. https://doi.org/10.1057/jphp.2011.35 [ Links ]
4. Geduld H, Hynes EJC, Wallis LA, Reynolds T. Hospital proximity does not guarantee access to emergency care. Lancet Glob Health 2018;6(7):e731. https://doi.org/10.1016/S2214-109X(18)30235-3 [ Links ]
5. Peltzer K, Phaswana-Mafiiya N, Pengpid S. Rural-urban health disparities among older adults in South Africa. Afr J Prim Health Care Fam Med 2019;11(1):e1-e6. https://doi.org/10.4102/phcfm.v11i1.1890 [ Links ]
6. Mukong AK, van Walbeek C, Ross H. Lifestyle and income-related inequality in health in South Africa. Int J Equity Health 2017;16(1):103. https://doi.org/10.1186/s12939-017-0598-7 [ Links ]
7. Boulle A, Davies M-A, Hussey H, et al. Risk factors for COVID-19 death in a population cohort study from the Western Cape Province, South Africa. Clin Infect Dis 2021;73(7):e2002-e2015. https://doi.org/10.1093/cid/ciaa1198 [ Links ]
8. National Academies. National Academies release framework for equitable allocation of a COVID-19 vaccine for adoption by HHS, state, tribal, local, and territorial authorities. 2 October 2020. https://www.nationalacademies.org/news/2020/10/national-academies-release-framework-for-equitable-allocation-of-a-covid-19-vaccine-for-adoption-by-hhs-state-tribal-local-and-territorial-authorities (accessed 16 July 2021). [ Links ]
9. South African Government. COVID-19 Coronavirus vaccine strategy. 2021. https://www.gov.za/covid-19/vaccine/strategy (accessed 12 April 2021). [ Links ]
10. Holm MR, Poland GA. Critical aspects of packaging, storage, preparation, and administration of mRNA and adenovirus-vectored COVID-19 vaccines for optimal efficacy. Vaccine 2021;39(3):457-459. https://doi.org/10.1016/j.vaccine.2020.12.017 [ Links ]
11. Wang P, Nair MS, Liu L, et al. Antibody resistance of SARS-CoV-2 variants B.1.351 and B.1.1.7. Nature 2021;593:130-135. https://doi.org/10.1038/s41586-021-03398-2 [ Links ]
12. Wibmer CK, Ayres F, Hermanus T, et al. SARS-CoV-2 501Y.V2 escapes neutralisation by South African COVID-19 donor plasma. Nature Med 2021;27:622-625. https://doi.org/10.1038/s41591-021-01285-x [ Links ]
13. Zhou D, Dejnirattisai W, Supasa P, et al. Evidence of escape of SARS-CoV-2 variant B.1.351 from natural and vaccine-induced sera. Cell 2021;184(9):2348-2361. https://doi.org/10.1016/j.cell.2021.02.037 [ Links ]
14. Tegally H, Wilkinson E, Giovanetti M, et al. Emergence and rapid spread of a new severe acute respiratory syndrome-related coronavirus 2 (SARS-CoV-2) lineage with multiple spike mutations in South Africa. medRxiv 2020 (epub 22 December 2020). https://doi.org/10.1101/2020.12.21.20248640 [ Links ]
15. Mahase E. Covid-19: Novavax vaccine efficacy is 86% against UK variant and 60% against South African variant. BMJ 2021;372:n296. https://doi.org/10.1136/bmj.n296 [ Links ]
16. South African Government News Agency. SA secures 30 million Johnson & Johnson vaccines. 29 March 2021. https://www.sanews.gov.za/south-africa/sa-secures-30-million-johnson-johnson-vaccines (accessed 9 April 2021). [ Links ]
17. South African Government News Agency. SA signs deal with Pfizer for 20 million vaccines. 7 April 2021. https://www.sanews.gov.za/south-africa/sa-signs-deal-pfizer-20-million-vaccines (accessed 9 April 2021). [ Links ]
18. Food and Drug Administration. Vaccines and Related Biological Products Advisory Committee Meeting February 26, 2021. FDA Briefing Document: Janssen Ad26.COV2.S vaccine for the prevention of COVID-19. https://www.fda.gov/media/146217/download (accessed 4 January 2021). [ Links ]
19. Wouters OJ, Shadlen KC, Salcher-Konrad M, et al Challenges in ensuring global access to COVID-19 vaccines: Production, affordability, allocation, and deployment. Lancet 2021;397( 10278): 1023-1034. https://doi.org/10.1016/S0140-6736(21)00306-8 [ Links ]
20. Centers for Disease Control and Prevention. Janssen COVID-19 vaccine (Johnson & Johnson): Storage and handling summary. 24 August 2021. https://www.cdc.gov/vaccines/covid-19/info-by-product/janssen/downloads/janssen-storage-handling-summary.pdf (accessed 4 January 2021). [ Links ]
21. US Food and Drug Administration. Fact sheet for healthcare providers administering vaccine (vaccination providers). Emergency use authorisation (EUA) of the Pfizer-BioNTech COVID-19 vaccine to prevent coronavirus disease 2019 (COVID-19). 2021. https://www.fda.gov/media/153713/download (accessed 1 December 2021). [ Links ]
22. World Health Organization. Job aid for COVID-19 vaccine administration. Pfizer-BioNTech COVID-19 vaccine, BNT162b2. Updated version 7 July 2021. http://apps.who.int/iris/bitstream/handle/10665/343080/WHO-EURO-2021-1834-41585-59310-eng.pdf?sequence=1&isAllowed=y (accessed 1 August 2021). [ Links ]
23. South African Government News Agency. More Pfizer vaccines for SA. 14 April 2021. https://www.sanews.gov.za/south-africa/more-pfizer-vaccines-sa (accessed 29 April 2021). [ Links ]
24. Hogan AB, Winskill P, Watson OJ, et al. Within-country age-based prioritisation, global allocation, and public health impact of a vaccine against SARS-CoV-2: A mathematical modelling analysis. Vaccine 2021;39(22):2995-3006. https://doi.org/10.1016/j.vaccine.2021.04.002 [ Links ]
25. Lloyd-Sherlock P, Muljono P, Ebrahim S. Ageism in Indonesia's national covid-19 vaccination programme. BMJ 2021;372:n299-n299. https://doi.org/10.1136/bmj.n299 [ Links ]
26. Davies M-A. HIV and risk of COVID-19 death: A population cohort study from the Western Cape Province, South Africa. medRxiv 2020 (epub 3 July 2021). https://doi.org/10.1101/2020.07.02.20145185 [ Links ]
27. Dzinamarira T, Nachipo B, Phiri B, Musuka G. COVID-19 vaccine roll-out in South Africa and Zimbabwe: Urgent need to address community preparedness, fears and hesitancy. Vaccines 2021;9(3):250. https://doi.org/10.3390/vaccines9030250 [ Links ]
28. Maugeri A, Barchitta M, Basile G, Agodi A. Applying a hierarchical clustering on principal components approach to identify different patterns of the SARS-CoV-2 epidemic across Italian regions. Sci Rep 2021;11(1):7082. https://doi.org/10.1038/s41598-021-86703-3 [ Links ]
29. Rios RA, Nogueira T, Coimbra DB, Lopes TJS, Abraham A, de Mello RF. Country transition index based on hierarchical clustering to predict next COVID-19 waves. Sci Rep 2021;11(1):15271. https://doi.org/10.1038/s41598-021-94661-z [ Links ]
30. GTI. GeoTerraImage. 2019. https://geoterraimage.com/ (accessed 4 April 2021). [ Links ]
31. Patel U, Malik P, Mehta D, et al. Early epidemiological indicators, outcomes, and interventions of COVID-19 pandemic: A systematic review. J Glob Health 2020;10(2):020506. https://doi.org/10.7189/jogh.10.020506 [ Links ]
32. Garba SM, Lubuma JM-S, Tsanou B. Modeling the transmission dynamics of the COVID-19 pandemic in South Africa. Math Biosci 2020;328:108441. https://doi.org/10.1016/j.mbs.2020.108441 [ Links ]
33. Khavarian-Garmsir AR, Sharifi A, Moradpour N. Are high-density districts more vulnerable to the COVID-19 pandemic? Sustain Cities Soc 2021;70:102911. https://doi.org/10.1016/j.scs.2021.102911 [ Links ]
34. Karaye IM, Horney JA. The impact of social vulnerability on COVID-19 in the U.S.: An analysis of spatially varying relationships. Am J Prev Med 2020;59(3):317-325. https://doi.org/10.1016/j.amepre.2020.06.006 [ Links ]
35. Gaynor TS, Wilson ME. Social vulnerability and equity: The disproportionate impact of COVID-19. Public Adm Rev 2020;80(5):832-838. https://doi.org/10.1111/puar.13264 [ Links ]
36. Fineberg HV. Social vulnerability and death by infection. https://doi.org/10.1056/NEJM199603283341311 [ Links ]
37. Hughes MM, Wang A, Grossman MK, et al. County-level COVID-19 vaccination coverage and social vulnerability - United States, December 14, 2020 - March 1, 2021. MMWR Morb Mortal Wkly Rep 2021;70(12):431-436. https://doi.org/10.15585/mmwr.mm7012e1 [ Links ]
38. Bibbins-Domingo K, Petersen M, Havlir D. Taking vaccine to where the virus is - equity and effectiveness in coronavirus vaccinations. JAMA Health Forum 2021;2(2):e210213-e210213. https://doi.org/10.1001/jamahealthforum.2021.0213 [ Links ]
39. Che Mat NF, Edinur HA, Abdul Razab MKA, Safuan S. A single mass gathering resulted in massive transmission of COVID-19 infections in Malaysia with further international spread. J Travel Med 2020;27(3):taaa059. https://doi.org/10.1093/jtm/taaa059 [ Links ]
40. Badr HS, Du H, Marshall M, Dong E, Squire MM, Gardner LM. Association between mobility patterns and COVID-19 transmission in the USA: A mathematical modelling study. Lancet Infect Dis 2020;20(11):1247-1254. https://doi.org/10.1016/S1473-3099(20)30553-3 [ Links ]
41. Chang S, Pierson E, Koh PW, et al. Mobility network models of COVID-19 explain inequities and inform reopening. Nature 2021;589(7840):82-87. https://doi.org/10.1038/s41586-020-2923-3 [ Links ]
42. Kolde R. Package 'pheatmap'. 4 January 2019. https://cran.r-project.org/web/packages/pheatmap/pheatmap.pdf (accessed 22 April 2021). [ Links ]
43. R Core Team. R A language and environment for statistical computing. Version 4.0.4. 15 February 2021. https://cran.r-project.org/doc/manuals/r-release/fullrefman.pdf (accessed 15 March 2021). [ Links ]
44. Goralnick E, Kaufmann C, Gawande AA. Mass-vaccination sites - an essential innovation to curb the Covid-19 pandemic. N Engl J Med 2021;384:e67. https://doi.org/10.1056/NEJMp2102535 [ Links ]
45. Benavides J, Walsh PD, Meyers LA, Raymond M, Caillaud D. Transmission of infectious diseases en route to habitat hotspots. PLoS ONE 2012;7(2):e31290. https://doi.org/10.1371/journal.pone.0031290 [ Links ]
46. Krause PR, Fleming TR, Longini IM, et al. SARS-CoV-2 variants and vaccines. N Engl J Med 2021;385(2):179-186. https://doi.org/10.1056/NEJMsr2105280 [ Links ]
 Correspondence:
W Ovens
wendy.ovens@righttocare.org
Accepted 5 November 2021.

