


Services on Demand
Article
 English (pdf)
 Article in xml format
 Article references
Indicators

Related links
-
 Cited by Google
 -
 Similars in Google
Share

 Permalink
SAMJ: South African Medical Journal
On-line version ISSN 2078-5135
Print version ISSN 0256-9574
SAMJ, S. Afr. med. j. vol.112 n.1 Pretoria Jan. 2022
http://dx.doi.org/10.7196/SAMJ.2022.v112i1.15968
RESEARCH
Underdiagnosis of hypertension and diabetes mellitus in South Africa
P Kamerman
BSc Hons, PhD Brain Function Research Group, School of Physiology, Faculty of Health Sciences, University of the Witwatersrand, Johannesburg, South Africa
ABSTRACT
BACKGROUND. Hypertension and diabetes mellitus (DM) are major causes of natural death in South Africa (SA). Underdiagnosis of these treatable diseases would hamper efforts to improve their management and hence reduce morbidity and mortality. Objectives. To assess the level of underdiagnosis of hypertension and DM in SA.
METHODS. Data from adult participants (>15 years) in the 2016 South African Demographic and Health Survey, which draws a nationally representative sample of the population, was used. Using these data, the prevalence of hypertension and DM was assessed at the time of the study using objective criteria (hypertension: systolic blood pressure >140 mmHg and/or diastolic blood pressure >90 mmHg; DM: glycated haemoglobin (HbAlc) >6.5%), and disease prevalence based on participant recall of having ever received a diagnosis of hypertension or DM from a healthcare professional. The difference between the objectively measured prevalence of the diseases and the prevalence based on recall was used to assess the level of underdiagnosis.
RESULTS. Of 10 336 adult participants who answered the question on the recall of a diagnosis, 8 092 had their blood pressure measured, and 6 740 had HbA1c assessed. The prevalence of hypertension based on recall was 18.9% (95% confidence interval (CI) 17.7 - 20.1), while the prevalence using blood pressure measurements was 37.1% (95% CI 35.3 - 38.9). Therefore, 49% of cases of hypertension are likely to be undiagnosed (~7.1 million people). The prevalence of DM based on recall was 4.5% (95% CI 3.9 - 5.1), and 11.4% (95% CI 10.4 - 12.4) based on HbA1c values. Therefore, 61% of cases of DM are likely to be undiagnosed (~2.7 million people).
CONCLUSIONS. There is significant underdiagnosis of hypertension and DM in SA. The underdiagnosis of these two treatable conditions, which have high morbidity and mortality, has major population health implications.
Diabetes mellitus (DM) and hypertension are major causes of mortality and morbidity globally and in South Africa (SA).[1-3] Indeed, the 2017 death statistics for SA report that DM was the second most common cause of death in the country (5.7% of deaths), while hypertensive diseases were the sixth leading cause of death (4.5% of deaths).[4] Both these diseases are treatable, and their early identification is therefore important in order to reduce morbidity and mortality.
There have been two reports in the past decade on the burden of disease for DM and hypertension in SA, the South African National Health and Nutrition Examination Survey (SANHANES-1) of 2012[5] and the South African Demographic and Health Survey of 2016 (SADHS 2016).[6] Both studies used nationally representative samples of the adult population (>15 years), and included self-reported presence of DM and hypertension, and objective measures of DM (glycated haemoglobin (HbA1c) >6.5%) and hypertension (systolic blood pressure >140 mmHg and/or diastolic blood pressure >90 mmHg). Despite both subjective and objective measures of hypertension and DM prevalence being measured in SANHANES-1, the two measures were never directly compared. In the SADHS 2016 report, it does briefly state that 'The percentage of respondents who self-reported that they have been diagnosed with high blood pressure ... is much lower than the hypertension prevalence as measured in the survey' and 'The prevalence of diabetes in women and men based on self-reports . is lower than the prevalence indicated by HbA1c testing' However, there was no systematic description of the difference in prevalence between objectively and subjectively sourced outcomes, or of the effect any underdiagnosis may have on treatment.
Objectives
Using the SADHS 2016 data, I describe and contrast the prevalence of hypertension and DM in South Africans based on recall of receiving a disease diagnosis and on objective measures of disease presence. As a secondary objective, I describe the treatment, for both diseases, depending on the diagnosis status (objective diagnosis v. subjective recall).
Methods
Ethical clearance and permissions
The survey protocol was approved by the South African Medical Research Council Ethics Committee (ref. no. EC008-2/2015). Permission to use the data for the purposes of this study was obtained from the DHS Program (https://dhsprogram.com).
Survey design
The survey design is described in detail elsewhere.[6] Briefly, the study had a stratified two-stage sampling design, with the Statistics South Africa Master Sample Frame used as the sampling frame. This sampling frame consisted of the enumeration areas (EAs, small geographical areas with clearly distinguishable boundaries) used in the 2011 population census for SA. The primary sampling unit (PSU), the first unit sampled in the design, consisted of EAs of manageable size. Where neighbouring EAs were small, they were pooled to form new PSUs, and large EAs were split into smaller conceptual PSUs. In total, 750 PSUs were selected in the survey, using probability proportional to size sampling. The second unit selection was dwelling units (DUs) within PSUs, and DUs could consist of one or more households. Twenty DUs per PSU were systematically sampled, and all households within a selected DU were eligible for interviews. In even-numbered DUs only, all men and women aged >15 years, and who were either permanent residents of the household or had stayed in the household the night before the interview, were eligible to be administered either the full or parts of the Adult Health Questionnaire (containing questions on whether a diagnosis of hypertension or DM had been received - see below for details) and were eligible for biomarker collection (including the measurement of blood pressure and HbAlc - see below for details).
Stratification was based on location, with strata for urban, farm and traditional areas within each province. In total, there were 26 sampling strata across the 9 provinces (Western Cape Province does not have any areas designated as traditional areas, and so only has two substrata).
To account for over-sampling, under-sampling and refusals, sampling weights were calculated to achieve a nationally representative sample. The design of the study (probability sampling and application of sampling weights) allows the results to be generalised to the population of SA.
Survey questions, measurements, and statistical analysis
For the objective assessment of whether hypertension was present, blood pressure was measured in consenting participants using an automatic blood pressure device (Omron HBP-1300 digital blood pressure monitors; Omron Healthcare Inc., SA). For each consenting participant, the appropriate cuff size was selected based on the arm circumference midway on the upper arm of one of the participant's arms, and then three measurements of blood pressure were taken. At least 3 minutes passed between measurements. For analysis purposes, the systolic pressure and diastolic pressure were calculated using the values recorded on the second and third blood pressure recordings. Hypertension was classified according to the criteria specified in the 2014 South African hypertension practice guideline,!71 namely a systolic blood pressure >140 mmHg and/or a diastolic blood pressure >90 mmHg. No grading of hypertension severity was undertaken. Unlike in the SADHS 2016 report, normotensive individuals who recalled having been prescribed antihypertensive medication were classified as normotensive and not hypertensive, so the prevalence of hypertension based on objective measurement reflects the prevalence of uncontrolled hypertension.
For the subjective assessment of whether participants recalled having received a diagnosis of hypertension, all participants were asked, 'Has a doctor, nurse or health worker told you that you have or have had high blood pressure?' Possible answers were 'yes', 'no' or 'don't know'.
For the objective assessment of whether participants had DM, each consenting participant had the HbAlc percentage quantified from a single finger-prick blood specimen collected on a filter paper card and dried overnight. The sample was stored at -20°C until analysed. Analysis involved the measurement of total haemoglobin concentration using a colourimetric method monitoring change in absorbance at 410 nm, while HbAlc concentration was measured by a turbidimetric immunoinhibition method monitoring change in absorbance at 340 nm. HbAlc concentration was then expressed as a percentage of the total haemoglobin concentration. Because a dried blood specimen was used, and not the typical fresh venous blood specimen, a correction factor was applied to the percentage HbAlc value:  .
.
The correction factor has not been empirically tested. A diagnosis of DM was given based on an HbAlc level of >6.5%[9] Individuals with DM who were being successfully treated would therefore be classified as being non-diabetic, so the case definition only identified cases of uncontrolled DM.
For the subjective assessment of whether participants recalled having received a diagnosis of DM, all participants were asked, 'Has a doctor, nurse or health worker told you that you have or have had diabetes or blood sugar?' Possible answers were 'yes', 'no' or 'don't know'.
To investigate the relationship between diagnosis and treatment, data on treatment for hypertension and DM were obtained from those participants who completed the biomarker questionnaire. In that questionnaire, information on participants' prescription medications was requested: 'Please show me all the prescribed medicines that you take regularly or daily' If a participant was on prescription medication, and they accepted the request, all prescription medications were recorded and classified according to the Anatomical Therapeutic and Chemical (ATC) classification system. The system allowed the systematic recording of medications for the treatment of hypertension and DM.[l0]
The analysis is entirely descriptive. Crude estimates of population prevalence are reported as percentages (95% confidence interval (Cl)). Continuous biomarker data are summarised using the five-number summary format of: minimum, 25th percentile, median, 75th percentile, and maximum. Sample sizes are reported as raw counts of observed individuals.
For all subjective assessments (personal recall) of disease diagnosis and treatment, the answer options included a 'don't know or don't know/don't remember' option. For all of these questions, 'don't know or don't know/don't remember' answers constituted < 1 % of responses and were re-coded as a response of 'no'.
All results factored in study design (i.e. clustering, stratification and weighting), and were generated in the R statistical environment (R v4.0.4; R Foundation for Statistical Computing, Vienna) using the survey package (v4.0).[13]" All clean data and analysis scripts are available at https://github.com/kamermanpr/diabetes-and-hypertension.git and from Zenodo (https://doi.org/10.5281/zenodo.5091668). Original Adult Health Questionnaire and biomarker data are available on request through the DHS Program.[14] A Docker image containing the R environment for running all data cleaning and analysis scripts is available (https://hub.d0cker.c0m/r/kamermanpr/diabetes-and-hypertension).
Results
The adult health questionnaire was completed by 10 336 participants aged >15 years (n=6 126 women and 4 210 men). This questionnaire included the questions on whether participants recalled having received a diagnosis of hypertension or DM. Of these participants, 8 092 had blood pressure data available, while 6 740 had HbAlc data available. Of 4 028 participants who were on prescription medication, 1 641 allowed their medicines to be assessed.
Table 1 summarises systolic and diastolic blood pressures and HbAlc percentages obtained from adults who had biomarker data available. Overall, the median systolic (126 mmHg) and diastolic (84 mmHg) blood pressures were below the 140 mmHg (systolic) and 90 mmHg (diastolic) thresholds for the diagnosis of hypertension. The same was true when the cohort was divided according to sex. When divided by age group, only median systolic blood pressure in the >65 years group was above the 140 mmHg threshold. Across the age range, the median diastolic pressure was below the 90 mmHg threshold. For the full cohort and the cohort divided according to sex and age group, HbAlc percentage was below the diagnostic threshold f 6.5% for DM.
Disease prevalence
Fig. 1 shows the percentage of participants who recalled receiving a diagnosis of hypertension or high blood pressure v. a diagnosis of hypertension based on blood pressure measurements taken during the course of the study. Data for the full cohorts (n=10 336 for the adult health questionnaire answers and n=8 092 for the biomarker measurements) and the cohorts divided according to sex and age group are shown in the figure. For all three of the scenarios, the prevalence of hypertension based on the biomarker data (an objective measure) was greater than the prevalence based on questionnaire data (subjective recall). For the full cohort, there was on average an 18 percentage point difference between the two methods of diagnosis (18.9% (95% CI 17.7 - 20.1) based on the questionnaire, 37.1% (95% CI 35.3 - 38.9) based on the measured blood pressure). Similarly, when looking at the data divided according to sex, females had a much greater prevalence of hypertension when using a diagnosis based on measurements rather than questionnaire-based recall (22.9% (95% CI 21.5 - 24.4) on the questionnaire, 36.3% (95% CI 34.3 - 38.3) on the measured blood pressure), while males had a prevalence of hypertension of 13% (95% CI 11.6 - 14.4) based on the questionnaire and 38.3% (95% CI 35.7 - 40.8) based on the measured blood pressure. When divided according to age, there was a clear positive relationship between increasing age and the prevalence of hypertension with both methods of diagnosis. However, the large gap between recall-based estimation and measurement-based estimation of the prevalence of hypertension was still present across all age groups. The questionnaire-based estimation of the prevalence of hypertension ranged from 2.3% (95% CI 1.5 - 3) for the youngest group (15 - 24 years) to 55.2% (95% CI 51.6 - 58.9) for the oldest group (>65 years), while the measurement-based estimation ranged from 15.2% (95% Cl 13.1 - 17.4) for the youngest age group to 64.5% (95% Cl 60.1 - 68.9) for the oldest age group.
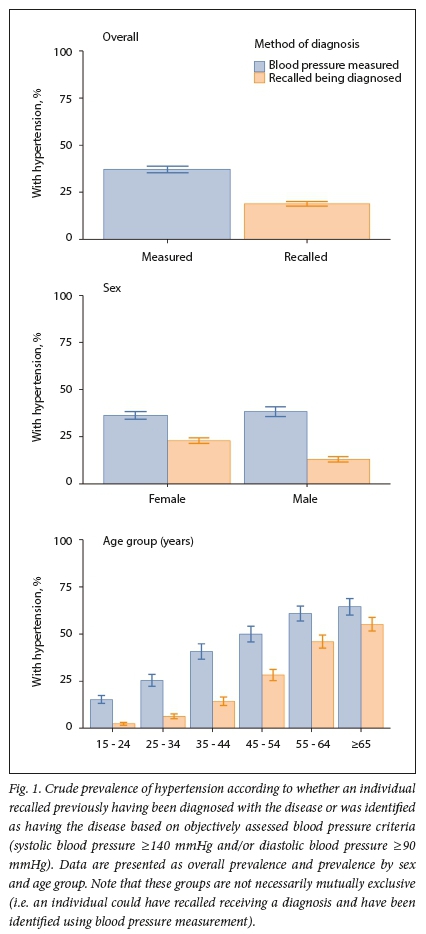
Fig. 2 shows the results of cross-tabulating whether hypertension was present or not based on the diagnostic method (self-report or measured blood pressure). In total, 8 092 participants had data from both sources. In participants without hypertension based on measured blood pressure, 87.8% (95% Cl 86.5 - 89.1) also reported never having been diagnosed with hypertension, while 12.2% (95% Cl 10.9- 13.5) reported having been told that they were hypertensive at some time in the past. More importantly, two-thirds (66.4% (95% Cl 64.0 - 68.7)) of participants who had a measured blood pressure in the hypertensive range reported having never been told that they had high blood pressure at some point in the past.
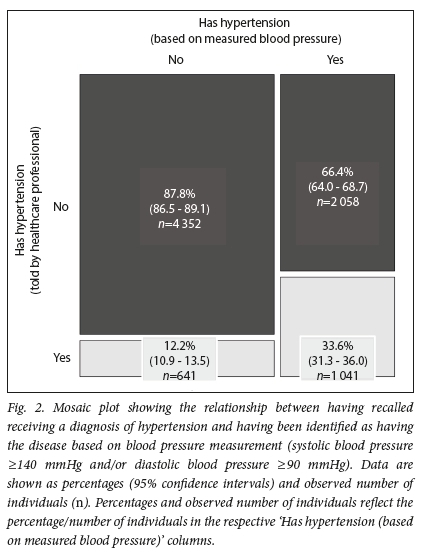
Fig. 3 shows the percentage of participants who recalled receiving a diagnosis of DM v. having a diagnosis of the disease based on measurement of HbAlc using blood taken during the course of the study. Data for the full cohorts (;i=io 336 for the adult health questionnaire answers and ;i=6 740 for the biomarker measurements) and the cohorts divided according to sex and age group are shown in the figure. For all three of the scenarios, the prevalence of DM based on the biomarker data was at least double the prevalence based on the questionnaire data. For the full cohort, the prevalence of DM was 4.5% (95% Cl 3.9 5.1") based on the questionnaire and 11.4% (95% Cl 10.4 12.4 ") based on HbAlc values. Similarly, when looking at the data divided according to sex, females had more than double the prevalence of DM when using a diagnosis based on HbAlc measurements rather than questionnaire-based recall (5.1% (95% Cl 4.3 5.8 ") on the questionnaire, 13.3% (95% Cl 11.9 14.6 ") on HbAlc values), and males had double the prevalence (3.7% (95% Cl 2.9 4.4 ") based on the questionnaire, 8.4% (95% Cl 7 9.7 ") based on HbAlc values). When divided according to age, there was a clear positive relationship between increasing age and the prevalence of DM, irrespective of the diagnostic method. However, the large gap between recall-based estimation and measurement-based estimation of the prevalence of hypertension was still present across all age groups; indeed, the gap widened across the age groups.
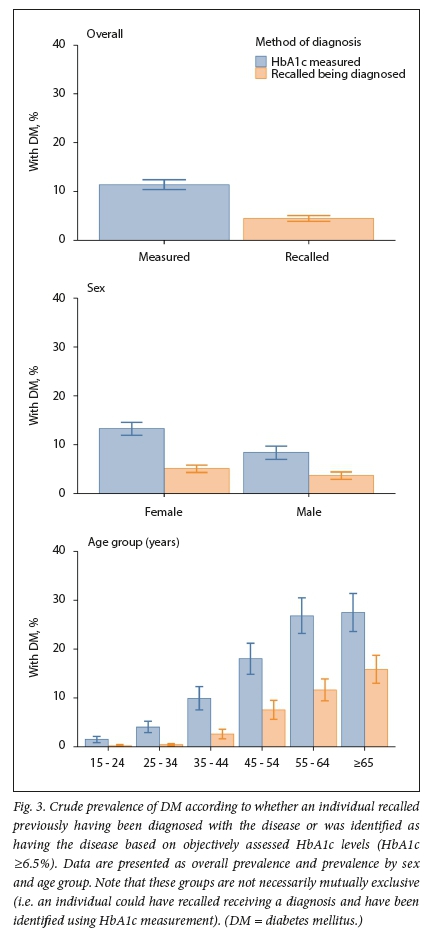
The questionnaire-based estimation of the prevalence of DM ranged from 0.2% (95% Cl 0 - 0.4) for the youngest group (15 - 24 years) to 15.8% (95% Cl 13 - 18.7) for the oldest group (>65 years), while the measurement-based estimation ranged from 1.5% (95% Cl 0.8 - 2.1) for the youngest age group to 27.5% (95% Cl 23.6 - 31.4) for the oldest age group.
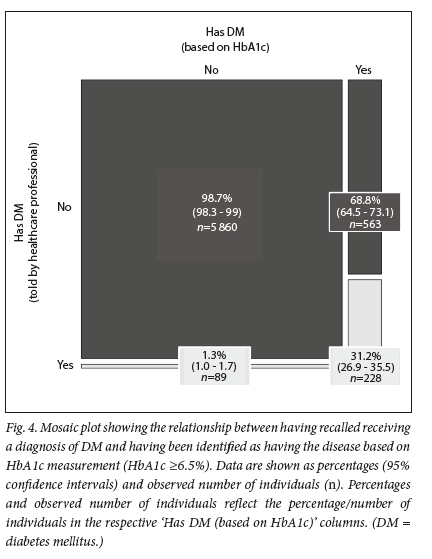
Fig. 4 shows the results of cross-tabulating whether DM was present or not based on the diagnostic method (self-report or HbAlc). In total, 6 740 participants had data from both sources. In participants without DM based on HbAlc, 98.7% (95% Cl 98.3 - 99.0) also reported never having been diagnosed with DM, while 1.3% (95% CI 1.0 - 1.7) reported having been told that they were diabetic at some time in the past. More importantly, more than two-thirds (68.8% (95% CI 64.5 - 73.1)) of participants who had an HbAlc percentage indicative of DM reported having never been told that they had DM at some point in the past.
Treatment
In terms of the treatment of hypertension, 1 606 participants had the combination of prescription data, data on self-reported hypertension diagnosis, and data on hypertension diagnosis based on blood pressure measurement (Table 2). Using these data, 92.6% (95% CI 89.4 - 95.8) of participants who recalled being diagnosed with hypertension, but who did not have hypertension (based on measurement) at the time of the study, were on some form of antihypertensive therapy. Of those participants who did not recall receiving a diagnosis of high blood pressure, but who did have hypertension (based on measurement), 45.0% (95% CI 37.0 53.0 ") were receiving antihypertensive medication. For those participants who recalled being diagnosed with hypertension and had hypertension based on blood pressure measurement, 92.2% (95% CI 89.4 95.0 ") were on antihypertensive treatment. In all cases, estimates show low levels of precision (wide CIs), reflecting the small sample size.
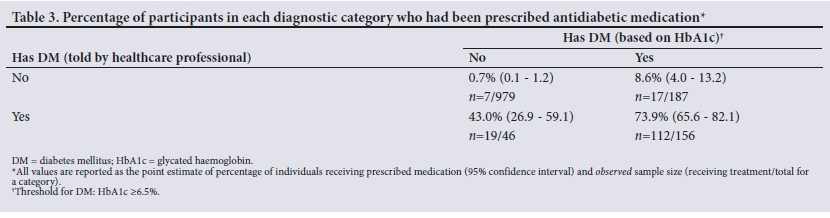
For the treatment of DM, 1 368 participants had the combination of prescription data, data on self-reported DM diagnosis, and DM diagnosis based on HbAlc percentage (Table 3). Using these data, 43.0% (95% CI 26.9 59.1 ") of participants who recalled being diagnosed with DM, but who did not have DM (based on measurement) at the time of the study, were on some form of antidiabetic therapy. Of those participants who did not recall receiving a diagnosis of DM, but who did have DM (based on measurement), 8.6% (95% CI 4.0 13.2 ") were receiving antidiabetic medication. For those participants who recalled being diagnosed with DM and had DM based on HbAlc percentage, 73.9% (95% CI 65.6 82.1 ") were on antidiabetic treatment. In all cases, estimates show low levels of precision (wide CIs), reflecting the small sample size.
Discussion
I investigated the relationship between subjective recall of having received a diagnosis of hypertension or DM and objective assessment for the presence of these diseases, with the aim of describing and quantifying the underdiagnosis of the two diseases. These analyses were performed using data from the SADHS 2016, a representative sample of the SA population. Compared with the objective measures, self-report was associated with systematic and gross under-identification of hypertension and DM across the full sample, by sex, and by age (Figs 1 and 3). Indeed, when looking at the full sample, ~66% of participants with objectively defined hypertension did not recall ever receiving a diagnosis of hypertension (Fig. 2). For DM, ~69% of participants with objectively defined DM did not recall ever receiving a diagnosis (Fig. 4).
As a secondary aim, I investigated the relationship between disease treatment, subjective recall of a disease diagnosis, and objective evidence of disease. For both diseases, almost all participants who did not have the disease based on objective measures, but who did recall being told that they had the disease, were on pharmacological treatment for the condition, indicating successful disease management. Moreover, almost all the individuals with 'double-identified' hypertension (told by a healthcare professional and objectively measured) and about three-quarters of those with 'double-identified' DM (told by a healthcare professional and objectively measured) were on pharmacotherapy for the respective diseases.
For the full sample, the prevalence of uncontrolled hypertension, based on blood pressure measurement, was 18.2 percentage points greater than the prevalence based on the recall of a diagnosis (37.1% v. 18.9%) (Fig. 1, top panel). To put that into context, ~39.1 million South Africans were >15 years old in 2016.[15] Of that population, ~14.5 million people had uncontrolled hypertension (37.1%), and of those with hypertension, only ~7.4 million (51%) were aware of having hypertension. This level of awareness is greater than that reported for other sub-Saharan African countries in general (27%, 95% CI 23 - 31).[161 However, when compared with the USA, awareness of diagnosis in SA is low (SA 51%, USA 83%).[17]
There were two worrying demographic trends. While men only had a slightly greater prevalence of uncontrolled hypertension (based on blood pressure measurement) than women (women 36.3%, men 38.3%), the extent of the underdiagnosis in men was almost double that in women (Fig. 1, middle panel). The reason why men should have so much greater underdiagnosis is unclear, but may have to do with lower health-seeking behaviour in men compared with women.[1819] The other worrying trend was with regard to age. Here, there was a steep increase in the prevalence of hypertension based on recall of a diagnosis and measured blood pressure (Fig. 1, bottom panel). However, when comparing the prevalence of hypertension based on recall of a diagnosis v. blood pressure measurements, the biggest percentage difference between the two methods was in the youngest age group (15 - 24 years, 2.3% v. 15.2%), and there was a steady decrease in the percentage difference between the two assessment methods, such that the difference was at its lowest in the >65 years age group (55.2% v. 64.5%). That the prevalence of uncontrolled hypertension is so high in younger age groups is of significant concern given the long-term consequences of elevated blood pressure.
A unique feature of this study is the cross-tabulation of participants with hypertension identified by self-report and by objective measurement. Only ~34% of people with objectively defined hypertension recalled ever receiving such a diagnosis ('double-identified', Fig. 2). Moreover, when looking at the subsample of participants who provided information on their prescription medications, almost all (92%) of people with hypertension and who recalled having been told they had hypertension were receiving antihypertensive medication (Table 2). Although based on a small sample, the prescription drug data therefore indicate almost universal treatment coverage for those who recalled being diagnosed with hypertension on a previous occasion. However, this treatment was not sufficient to drop the blood pressure to normal ranges. The high prevalence of treatment cover is supported by the data in the group who did not have hypertension based on blood pressure measurement, but who had received a previous diagnosis of hypertension. In this group of participants, 93% were receiving treatment for hypertension, and I posit that this group of individuals, who represented 12.2% of people without hypertension (defined by blood pressure measurement), were successfully managed cases of hypertension previously identified by healthcare professionals. There are two anomalous groups in this cross-tabulation, the first of which is the group who did not recall having been diagnosed with hypertension and did not have hypertension based on blood pressure measurement, but who were receiving treatment for hypertension. According to the audit of prescription medications, 16% of such individuals were on antihypertensive therapy. I suggest that this group represents recall error and that they were actually successfully managed hypertensive individuals. Another anomalous group in terms of treatment is the group who did not recall having ever been diagnosed with hypertension, but who did have hypertension based on blood pressure measurement. This group constitutes 66% of individuals with hypertension, but from the medication audit, 45% were on antihypertensive therapy. I suggest that these individuals had been diagnosed with hypertension previously, but did not recall being diagnosed, and that they should in fact fall under the group I described earlier who had been 'double-identified' with hypertension. If this is correct, then ~60% of people in the study with hypertension based on measurement could be classified as 'double-identified' and on treatment, just not successful treatment.
The prevalence of DM, based on HbAlc measurement, was 6.9 percentage points greater than the prevalence based on recall of a diagnosis (11.4% v. 4.9%) (Fig. 3, top panel). Therefore, of the ~39.1 million South Africans aged > 5 years in 2016, 4.5 million had DM, and of those with DM, ~2.7 million adults were undiagnosed (~60%). This proportion of total cases of DM that are undiagnosed is greater than the global average, which is estimated to be ~46% of DM cases.[20] However, there is significant global variation, with low- and middle-income countries having the greatest proportion of undiagnosed cases of DM.[20]
When looked at by sex, the prevalence of DM (based on HbA1c measurement) in women was 13.3%, which is 8.2 percentage points greater than the prevalence based on recall (5.1%). Men had a lower prevalence of DM (based on HbA1c measurement) than women (men 8.4%), but here too there was a gross underestimation of the percentage of the male population affected by DM (3.7% prevalence in men by recall, equating to a 4.7 percentage point difference) (Fig. 3, middle panel).
There was an age-related increase in the prevalence of DM. However, unlike the situation for hypertension, the most underdiagnosis was at older age, such that the measured v. self-report difference in prevalence increased from 1.3 percentage points for the 15 - 24 years group to >10 percentage points in older age groups (Fig. 3, bottom panel).
As with the hypertension data, there are unique insights to be had from the cross-tabulation of participants with DM identified by self-report and by objective measurement. Only 31% of people with objectively defined DM recalled ever receiving such a diagnosis (Fig. 4). Moreover, when looking at the subsample of participants who provided information on their prescription medications (Table 3), only 74% of 'double-identified' individuals were receiving antidiabetic medication. While based on a small sample, the prescription drug data indicate a significant treatment gap in those who recalled being diagnosed with DM. In contrast, 8.5% of those individuals with prescription drug information and who had been objectively defined as having DM, but who did not recall ever receiving a diagnosis of the disease, were on antidiabetic medication. This percentage may reflect recall error in terms of under-reporting of having a diagnosis of DM. Only 1.3% of participants without objectively defined DM recalled having received a diagnosis of the disease. While this may indicate the percentage of successfully treated individuals (recalled being diagnosed, but do not have DM based on an objective measure), analysis of the prescription data indicates that only 43% of individuals in this category were receiving pharmacotherapy for their disease. If <50% of these individuals were on therapy, the absence of DM based on HbA1c levels may indicate that a large proportion of this group were misdiagnosed in the first place, or that a large proportion reported having been diagnosed with DM when they had not.
Study limitations
There are several limitations to the study. While there is a large gap between self-recalled diagnosis of hypertension or DM and objectively assessed presence of the diseases, the degree to which forgetting plays a role in this gap is unclear. The percentage of participants who were on pharmacotherapy, who did not have objectively measured disease, and who did not recall ever being diagnosed with either disease may give an indication of the recall error rate. In the case of DM, 0.7% of participants fell into this category, and in the case of hypertension, it was 16%. However, it must be remembered that while the treatment data give an indication of treatment in each disease, the sample size is small (of the 4 028 on prescription medications, only 1 641 agreed to have their medications assessed), and therefore these data may not be a good representation of the population. On a related matter, the classification of individuals as being normotensive or non-diabetic based on their being below the specified thresholds meant that some individuals with hypertension or DM may have been erroneously classified as not having those conditions. That is, the case definitions for the objective identification of disease presence only identified individuals with uncontrolled disease. Therefore, participants with controlled disease may have recalled being diagnosed with the disease, but they would not have been classified as having disease based on the objective criteria. As such, the estimates of the extent of the underdiagnosis of DM and hypertension presented here may be underestimates. Another limitation is that although three measurements of blood pressure at rest were taken, it was a once-off series of measurements and any masked or white-coat effects would therefore be missed, resulting in under- or overestimation of the prevalence of hypertension. Lastly, the HbA1c percentage used to estimate the prevalence of DM is based on an adjustment factor, used because the assay was performed on dried and not fresh blood samples. The calibration factor was developed using published findings,[8] but its performance has not been validated.
Conclusions
In conclusion, I report that there is significant underdiagnosis of hypertension and DM, which is a major public health crisis given that these are treatable conditions that have high morbidity and mortality. In terms of treatment, there was good treatment coverage for hypertension, but significant under-treatment of DM.
Declaration. None.
Acknowledgements. The author thanks Dr Antonia Wadley for comments on the manuscript.
Author contributions. Sole author.
Funding. None.
Conflicts of interest. None.
References
1. GBD 2017 DALYs and HALE Collaborators. Global, regional, and national disability-adjusted life-years (DALYs) for 359 diseases and injuries and healthy life expectancy (HALE) for 195 countries and territories, 1990 - 2017: A systematic analysis for the Global Burden of Disease Study 2017. Lancet 2018;392(10159):1859-1922. https://doi.org/10.1016/S0140-6736(18)32335-3 [ Links ]
2. Mills KT, Bundy JD, Kelly TN, et al. Global disparities of hypertension prevalence and control: A systematic analysis of population-based studies from 90 countries. Circulation 2016;134(6):441-450. https://doi.org/10.1161/CIRCULATIONAHA.115.018912 [ Links ]
3. GBD 2017 Causes of Death Collaborators. Global, regional, and national age-sex-specific mortality for 282 causes of death in 195 countries and territories, 1980 - 2017: A systematic analysis for the Global Burden of Disease Study 2017. Lancet 2018;392(10159):1736-1788. https://doi.org/10.1016/S0140-6736(18)32203-7 [ Links ]
4. Statistics South Africa. Mortality and causes of death in South Africa: Findings from death notification 2017. Statistical release P0309.3. Pretoria: Stats SA, 2020. https://www.statssa.gov.za/publications/P03093/P030932017.pdf (accessed 23 June 2021). [ Links ]
5. Shisana O, Labadarios D, Rehle T, et al. South African National Health and Nutrition Examination Survey (SANHANES-1): 2014 edition. Cape Town: HSRC Press, 2014. [ Links ]
6. National Department of Health, Statistics South Africa, South African Medical Research Council, ICF. South Africa Demographic and Health Survey 2016: Report. Rockville, Md.: Demographic and Health Surveys Program, 2019. http://dhsprogram.com/pubs/pdf/FR337/FR337.pdf (accessed 28 October 2019). [ Links ]
7. Hypertension Guideline Working Group, Seedat YK, Rayner BL, Veriava Y. South African hypertension practice guideline 2014. Cardiovasc J Afr 2014;25(6):288-294. https://doi.org/10.5830/CVJA-2014-062 [ Links ]
8. Affan ET, Praveen D, Chow CK, Neal BC. Comparability of HbA1c and lipids measured with dried blood spot versus venous samples: A systematic review and meta-analysis. BMC Clin Pathol 2014;14:21. https://doi.org/10.1186/1472-6890-14-21 [ Links ]
9. American Diabetes Association. Classification and diagnosis of diabetes. Diabetes Care 2015;38(Suppl 1):S8-S16. https://doi.org/10.2337/dc15-S005 [ Links ]
10. World Health Organization. ATC-DDD Toolkit. https://www.who.int/tools/atc-ddd-toolkit (accessed 28 June 2021). [ Links ]
11. Lumley T. Analysis of complex survey samples. J Stat Softw 2004;9(8):1-19. https://doi.org/10.18637/jss.v009.i08 [ Links ]
12. Lumley T. Complex Surveys: A Guide to Analysis Using R New Jersey: Wiley, 2010. [ Links ]
13. R Core Team. R: A language and environment for statistical computing. Vienna: R Foundation for Statistical Computing, 2021. [ Links ]
14. The DHS Program. Demographic and Health Surveys Program, https://dhsprogram.com/ (accessed 28 June 2021). [ Links ]
15. Statistics South Africa. Mid-year population estimates 2016. Statistical release P0302. Pretoria: Stats SA, 2016. https://www.statssa.gov.za/publications/P0302/P03022016.pdf (accessed 12 July 2021). [ Links ]
16. Ataklte F, Erqou S, Kaptoge S, et al. Burden of undiagnosed hypertension in sub-saharan Africa: A systematic review and meta-analysis. Hypertension 2015;65(2):291-298. https://doi.org/10.1161/HYPERTENSI0NAHA.114.04394 [ Links ]
17. Nwankwo T, Yoon SS, Burt V, Gu Q. Hypertension among adults in the United States: National Health and Nutrition Examination Survey, 2011 - 2012. NCHS Data Brief 2013;Oct(133):1-8. [ Links ]
18. Skordis-Worrall J, Hanson K, Mills A. Estimating the demand for health services in four poor districts of Cape Town, South Africa. Int Health 2011;3(1):44-49. https://doi.org/10.1016/j.inhe.2011.01.004 [ Links ]
19. Dryden R, Williams B, McCowan C, Themessl-Huber M. What do we know about who does and does not attend general health checks? Findings from a narrative scoping review. BMC Public Health 2012;12:723. https://doi.org/10.1186/1471-2458-12-723 [ Links ]
20. Beagley J, Guariguata L, Weil C, Motala AA. Global estimates of undiagnosed diabetes in adults. Diabetes Res Clin Pract 2014;103(2):150-160. https://doi.org/10.1016/j.diabres.2013.11.001 [ Links ]
 Correspondence:
P Kamerman
peter.kamerman@wits.ac.za
Accepted 6 October 2021

