


Services on Demand
Article
 English (pdf)
 Article in xml format
 Article references
Indicators

Related links
-
 Cited by Google
 -
 Similars in Google
Share

 Permalink
SAMJ: South African Medical Journal
On-line version ISSN 2078-5135
Print version ISSN 0256-9574
SAMJ, S. Afr. med. j. vol.111 n.7 Pretoria Jul. 2021
http://dx.doi.org/10.7196/samj.2021.v111i7.15430
RESEARCH
The case for minimum unit prices on alcohol in South Africa
C van Walbeek; G Chelwa
PhD; Research Unit on the Economics of Excisable Products (REEP), School of Economics, Faculty of Commerce, University of Cape Town South Africa
ABSTRACT
BACKGROUND: Although only about a third of South African (SA) adults indicate that they consume alcohol, heavy drinking is common. As a result, society carries large alcohol-related mortality and economic burdens
OBJECTIVES: To investigate the feasibility of a minimum unit price (MUP) on alcohol, aimed at reducing the prevalence of heavy drinking
METHODS: The study calculates unit values, defined as total monthly alcohol expenditure per household, divided by the household's total monthly alcohol consumption, for four categories of drinking households (moderate, intermediate, occasional heavy and regular heavy), using wave 4 data (2015) from the National Income Dynamics Study. A cumulative distribution of the unit values is derived for each of the four categories of drinking households. A number of hypothetical MUPs are imposed, and the impact of these MUPs on the consumption of the different categories of drinking households is estimated, taking cognisance of the fact that these households respond differently to price changes. Moderately drinking households tend to be more price sensitive than regular heavy-drinking households
RESULTS: Occasional and regular heavy-drinking households comprise a quarter of all households (and half of all drinking households) in SA, but consume 84% of all alcohol consumed in the country. There are large differences in the calculated average price of alcohol between different categories of drinking households, ranging from ZAR12.00 per standard drink among moderately drinking households to ZAR1.53 per standard drink among regular heavy-drinking households. An MUP of ZAR3.00 (alternatively ZAR10.00) per standard drink is estimated to reduce alcohol consumption by 11.9% (21.8%) among regular heavy-drinking households, by 3.1% (11.6%) among occasional heavy-drinking households, by 2.3% (15.9%) among intermediate-drinking households and by 0.3% (6.1%) among moderately drinking households
CONCLUSIONS: An MUP on alcohol is not a silver bullet, but could have a significant impact on reducing the consumption of alcohol among regular heavy-drinking households, and to a lesser extent among occasional heavy-drinking and intermediate-drinking households. The government should strongly consider implementing such a policy
Alcohol has been commercially produced in South Africa (SA) since the 17th century and continues to play an important economic role in the country. However, the country has a significant problem with alcohol abuse. Although survey results from SA show that only about a third of adults indicate that they consume alcohol,[1,2] nearly half of alcohol users reported that they consume five or more standard drinks on an average drinking day.[2] According to the World Health Organization (WHO), SAs pattern of drinking is categorised as 'most risky', in the same category as the Russian Federation and Ukraine, among others.[3]
Unsurprisingly, alcohol abuse imposes a heavy toll on SA society. The country has the world's highest prevalence of fetal alcohol syndrome.[4] A recent Global Burden of Disease study placed alcohol use in SA as the sixth risk factor for disability-adjusted life-years lost and the seventh risk factor for death.[5] A 2018 study found that 62 300 people died from alcohol-attributable causes in SA in 2015.[6] The study also found that even though the prevalence of alcohol use in lower socioeconomic groups is lower than in the rest of the population, drinkers in those groups had heavier drinking patterns, resulting in substantially higher alcohol-attributable mortality rates.
The tangible financial cost of harmful alcohol use was estimated at 1.6% of SAs gross domestic product (GDP) in 2009.[7] Combined with the very substantial intangible costs, the total cost of alcohol harm to the economy was estimated at between 10% and 12% of the 2009 GDR[7] In the 2018/19 fiscal year, excise taxes on alcohol products yielded nearly ZAR29 billion, or 2%, of total government revenue.[8] This percentage has increased slightly over the past decade. While alcohol taxes provide substantial revenue to the fiscus, the direct cost of alcohol abuse to national and provincial governments (borne primarily by the departments of Health, Social Development, Safety and Security, Justice and Constitutional Development, Correctional Services, Transport, and Economic Development) are greater than the sum of alcohol excise tax and value-added tax revenues.[9] The implication is that taxes on alcohol do not even cover the government's direct costs associated with alcohol abuse, let alone the broader societal costs.
Whereas previously the medical literature suggested that moderate use of alcohol may have some beneficial health effects,[10] more recent studies indicate that alcohol use, even in small quantities, is harmful.[11] In SA, with its high prevalences of drinking and driving and alcohol-related gender-based and domestic violence, the focus has typically been on heavy drinking. In fact, during the COVID-19 lockdown, the sale of alcohol was banned for some months, primarily to reduce the acute negative consequences of excessive alcohol consumption.[12]
The WHO has identified tax increases on alcohol products as one of the most cost-effective means to reduce alcohol consumption and thus improve public health.[13] An increase in the excise tax typically increases the price of alcohol, and this reduces the demand for the product. A 2009 meta-analysis found that the price elasticity of demand for beer, globally, is about -0.5, indicating that for every 10% increase in the price, the demand for beer decreases by an average of 5% [14]The average price elasticity for wine is -0.7 andfor spirits -0.8.[14] The government can use an increase in the excise tax to increase the retail price of alcohol. A 2016 study demonstrated that in SA, where most alcohol is consumed as beer, the beer industry increases the retail price of beer by more than the increase in the excise tax on an annual basis, making excise tax increases a particularly effective way of reducing consumption of the product.[15] In comparison with cigarettes the excise tax increases on alcohol in SA in the post-apartheid period have been modest. The real (inflation-adjusted) excise tax on cigarettes increased by >450% between 1994 and 2020.[16] In comparison, real excise taxes on beer increased by 70%, on spirits by 160%, and on wine by 244% over the same period.[16]
Excise tax and price increases have different effects on different categories of drinkers. A 2009 systematic review, which considered >100 studies and >1 000 price elasticity estimates, found that heavy drinkers (price elasticity of -0.21) responded less to price increases than moderate drinkers (price elasticity of -0.41).[17] The implication is that excise tax increases are not particularly well suited for targeting heavy drinkers. An excise tax increase may therefore be a blunt instrument to reduce alcohol use among heavy drinkers. Furthermore, heavy drinkers tend to buy cheaper, and more potent alcohol than moderate drinkers.[18-20]
Since heavy drinkers are not very responsive to price changes and tend to buy cheaper alcohol than moderate drinkers, some countries have implemented or have considered implementing minimum unit prices (MUPs) on alcohol. An MUP is not a tax, but rather a legally mandated 'floor price' below which retailers are not permitted to sell alcohol[21] For example, in May 2018, Scotland introduced an MUP of 50 pence (about ZAR9.00) per unit of alcohol (defined as 8 g or 10 mL of ethanol).[22,23] The explicit aim of the policy was to reduce alcohol abuse by removing very cheap alcohol from the market.[23] Canada already has MUPs in some provinces, while England and Australia are considering this policy. Evidence from Canada shows that MUPs have been particularly effective at curbing hazardous drinking.[24-26] Simulation exercises have shown that MUPs are likely to have similar effects in Australia, England and Scotland.[27-31]
Objectives
In this article we investigate the drinking patterns, and the distribution of unit values (a proxy for the price), of four groups of drinking households in SA (moderate-, intermediate-, occasional heavy- and regular heavy-drinking households). We further investigate the possible impact of hypothetical MUPs on the alcohol consumption of these four groups of households in SA.
Methods
We used data from wave 4 (2015) of the National Income Dynamics Study (NIDS).[32] NIDS is SAs first nationally representative panel study. The first wave of data was collected in 2008, from 7 300 households, while wave 4 sampled 11 800 households. Although wave 5 data were collected in 2017 and released in 2018, respondents were not asked any alcohol-related questions in this wave.
The NIDS survey is comprehensive and considers a range of socioeconomic, demographic, health and welfare issues. There are three alcohol-related questions. Two of the questions were asked of individual adults (age > 15 years), while the third question was asked at the household level. The first adult-level question is 'How often do you drink alcohol?', with options 'I have never drunk alcohol', 'I no longer drink alcohol', 'I drink very rarely', 'Less than once a week, 'On 1 or 2 days a week, 'On 3 or 4 days a week, 'On 5 or 6 days a week, and 'Every day'. The second adult-level question is: 'On a day that you have an alcoholic drink, how many standard drinks do you usually have?'. This question has the following six options: 13 or more, 9 - 12, 7 - 8, 5 - 6, 3 or 4, and 1 or 2 standard drinks. The NIDS defines a standard drink as a small glass of wine, a 330 mL can of regular beer, a tot of spirits, or a mixed drink.[33] The third question asks the respondent reporting on behalf of the whole household to indicate the amount of money the household spent on alcohol in the previous month.
The monthly alcohol consumption of each drinking member in the household was calculated, based on frequency of use and the reported average use per day on which the respondent consumed alcohol. For responses that included a range, we chose the top end of the range, since respondents typically under-report their drinking.[34] The households total monthly consumption was the aggregate of the individuals' reported monthly consumption. The aggregation was necessary because expenditure on alcohol, an important variable for our study, is only reported at the household level. Consequently, our analysis was conducted at the household level.
The NIDS questionnaire did not explicitly ask each respondent the average price that they paid per unit of alcohol. In order to get an approximation of the price, we calculated 'unit values' by dividing monthly household expenditure on alcohol by total monthly household consumption of alcohol. Unit values are often used in applied research as appropriate proxies for prices when actual prices are unavailable.[35] Unit values are sensitive to quality differences: households that purchase higher-quality beverages tend to have higher unit values than households that purchase lower-quality beverages. In this article, we use unit values as a proxy for prices paid by different types of drinking households.
If all adult respondents in a household indicate that they either have never consumed alcohol or no longer consume alcohol, the household is classified as a non-drinking household. Drinking households (i.e. those with at least one drinker) were subdivided into four categories:
• Moderately drinking households. These are households where the member with the highest daily consumption consumed 1 or 2 standard drinks per day, irrespective of the number of days that the person consumed alcohol.
• Intermediate-drinking households. These are households where the member with the highest daily consumption consumed 3 or 4 standard drinks per day, irrespective of the number of days that the person consumed alcohol.
• Occasional heavy-drinking households. These are households where at least one member consumed at least 5 standard drinks on a typical drinking day, but drank no more than twice a week. If another member of the household was classified as a light or moderate drinker, the presence of the occasional heavy drinker (often termed a binge drinker) would classify it as an occasional heavy-drinking household.
• Regular heavy-drinking households. These are households where at least one person consumed alcohol at least 3 times a week, and who drank at least 5 standard drinks on a typical drinking day.
In the subsequent analysis, when we use the term 'heavy-drinking households' we refer to both occasional and regular heavy-drinking households. Next, we ranked each of the four types of drinking households from that with the lowest reported unit value to that with the highest unit value. Each household was weighted according to its monthly alcohol consumption, multiplied by the NIDS sample weight. For example, if a household consumed 200 standard drinks per month, and has a NIDS sample weight of 4 000 (i.e. is representative of 4 000 households), this household represents 800 000 standard drinks consumed per month. For each of the four types of drinking households, we calculated the sum of all these weighted household consumption values across all relevant households, to get the total number of standard drinks consumed in a month. From this total value, we were able to calculate the percentage of alcohol that was consumed at or below certain unit values, by drinker category.
Once we determined the distribution of unit values (by type of drinking household), we imposed a hypothetical MUP on alcohol. The MUP would have no impact on the consumption of households with an estimated unit value above this MUP. However, for households with a declared unit value below the MUP, the imposition of the MUP would imply an increase in the price they would have to pay, with a concomitant decrease in quantity consumed. The decrease in the quantity consumed depends on the difference between the calculated unit value (as declared by the households alcohol expenditure and alcohol consumption) and the MUP, and the price elasticity of demand for alcohol. Based on price elasticities that were estimated in a 2018 report, and that were subsequently updated, the price elasticity of demand for alcohol for moderately drinking households was taken as -0.45, for intermediate-drinking households as -0.35, tor occasional heavy-drinking households as -0.22 and for regular heavy-drinking households as -0.18.[36] These elasticities by type of drinker are in line with those obtained in the international literature.[14]
Because the percentage change in the price is substantial in many instances, standard economic theory indicates that one should use the arc (also known as the midpoint) formulation of the price elasticity of demand to estimate the new level of consumption.[37] The arc elasticity tormulation avoids a situation where a substantial increase in the price may lead to a >100% decrease in consumption. For example, if the price elasticity is -0.6, a 200% price increase will result in a 120% (= -0.6 χ 200%) decrease in consumption, if one uses the point elasticity version. A decrease of >100% is mathematically impossible. Using the arc formulation, the decrease in consumption, even if the price increase is very large, will be <100%. Given the hypothetical numbers above, a 200% price increase will result in a 46.2% decrease in consumption.
Results
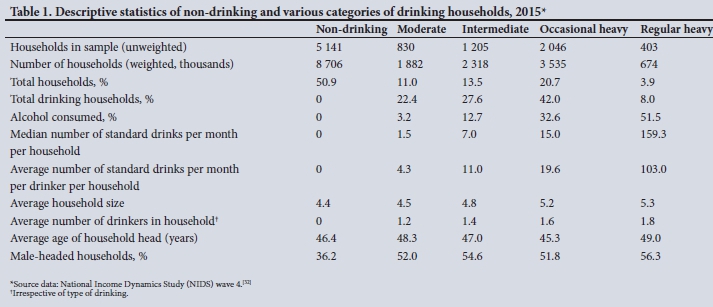
Some descriptive statistics, categorised by non-drinking households and the four groups of alcohol-consuming households, are shown in Table 1. Except in the first line, all statistics are based on weighted data.
Table 1 indicates that the consumption of alcohol is very unevenly distributed in SA. While heavy drinking is limited to <25% of households (50% of drinking households), these households consume 84% of total reported alcohol consumption. Regular heavy-drinking households consume a median of nearly 160 standard drinks per month. Heavy-drinking households tend to have a higher average number of drinkers than moderate- and intermediate-drinking households. Males are more likely to head households that consume (any) alcohol, and are more likely to head regular heavy-drinking households.
In Fig. 1 we show the cumulative distribution of the unit value of standard drinks consumed by the four categories of drinking households, for various unit value (price) points. These points do not increase in a linear fashion. We adjusted the unit values (which were collected in 2014) with the inflation rate to reflect 2019 values. The median unit value of a standard drink consumed by moderately drinking households was ZAR12.00. In contrast, the median unit value of a standard drink consumed by intermediate-drinking households was ZAR6.46, of occasional heavy-drinking households ZAR6.36, and of regular heavy-drinking households ZAR1.53. As shown by the vertical line, >90% of alcohol consumed by regular heavy-drinking households has a unit value of ZAR5.00 or less per standard drink, compared with 41% of alcohol consumed by occasional heavy-drinking households, 45% by intermediate-drinking households and 9% by moderately drinking households.

There is a large discrepancy between the distributions of unit values reported by the four types of drinking households, making an MUP a potentially effective tool to address heavy and intermediate drinking. In Table 2, we illustrate the impact of imposing an MUP on the consumption of each of the four categories of drinking households, for a variety of unit value thresholds. For any household with a calculated unit value at the outset less than the MUR the imposition of the MUP would be expected to reduce alcohol consumption. The reduction in consumption is a function of the price elasticity of demand and the difference between the MUP and the reported unit value for that household. A household that is relatively more sensitive to changes in the price of alcohol (typically a moderately drinking household), or that purchases very cheap alcohol at the outset would be expected to show a greater decrease in consumption after imposition of the MUP than households that are less price sensitive, or that purchase relatively more expensive alcohol at the outset.
Should the MUP be set at a very low ZAR2.00 per unit, alcohol use is likely to decrease by 0.1% among moderately drinking households, 0.9% among intermediate-drinking households, 1.6% among occasional heavy-drinking households and 8.5% among regular heavy-drinking households. The differential impact on the different groups of drinking households reflects the very large differences in the unit values reported by these households before the imposition of the hypothetical MUP. If the MUP is set at a higher level, consumption would decrease among all four drinking categories, but the impact is not linear. For example, if the MUP were to be set at ZAR6.00 per unit, alcohol consumption among moderately drinking households would decrease by 2.0%, among intermediate-drinking households by 9.7%, among occasional heavy-drinking households by 7.1% and among regular heavy-drinking households by 18.0%. For all MUP thresholds indicated in Table 2, the impact on regular heavy-drinking households is the highest, even though they are the least price responsive. The reason is that, because these households, on average, pay very low prices for their alcohol, the MUP will cause substantial increases in those prices, which in turn would decrease consumption.
As the MUP is set at progressively higher levels, it will have a relatively greater impact on alcohol consumption by moderately drinking households, because they are substantially more sensitive to price changes than the other categories of drinking households.
Discussion
This study shows that, were the government to implement an MUP on alcohol products successfully and effectively, it could substantially decrease the alcohol consumption of regular heavy-drinking households, and to a lesser extent that of occasional heavy-drinking and intermediate-drinking households. Despite the fact that these categories of drinking households are relatively price insensitive, an MUP, levied at an appropriate level, would substantially increase the price. This, in turn, would substantially influence households' level of consumption.
If the aim of a tax or pricing policy is to reduce consumption by heavy and intermediate drinkers, while having a limited effect on moderate drinkers, an MUP is more effective than an increase in the excise tax. An excise tax increase will cause the prices of all alcoholic beverages to increase, while an MUP would only target low-priced products. Low-priced alcohol products are disproportionately heavily consumed by regular heavy-drinking households, and to a lesser extent by occasional heavy-drinking and intermediate-drinking households.
There is an important caveat. Because the demand for alcohol is price inelastic, especially for heavy-drinking households, a large increase in the price of alcohol will increase such households' total alcohol expenditure, and therefore the share of alcohol in the total budget. Other expenditures would be increasingly crowded out by alcohol. While this does not nullify the effectiveness of an MUP as a policy to reduce alcohol use, especially by heavy-drinking households, it may deepen the financial hardship of such households.
Study limitations
Firstly, this is a conceptual study, in which we investigated the rationale for implementing an MUP on alcohol. It is not an implementation study. For example, we did not investigate the prices of alcohol products in various retail outlets to determine which products could potentially be subject to an MUP. Substantially more work would be required before an MUP can be considered an implementable policy including, for example, determining the legal basis for such a policy determining the level of the MUP, and estimating how it would influence the competitive landscape between alcohol producers.
Secondly, there could be substantial distortions in the unit value and consumption data, because people generally under-report alcohol consumption. A 2018 study found that the NIDS data reported only about 22% of total recorded and unrecorded consumption in 2014 -2015.[2] It is not clear whether individual drinkers under-report their consumption, or whether the prevalence of alcohol use is under-reported (i.e. people indicating that they do not consume alcohol, when in fact they do).[6] Relatedly, the NIDS questionnaire relies on a 'representative' household member to provide information on alcohol consumption for all household members. It is likely that the representative' household member may not have a complete picture of alcohol consumption for each and every member of the household
Total expenditure on alcohol, according to the weighted NIDS data, was ZAR16 billion in 2014 - 2015. Based on consumption figures from the South African Wine Industry Statistics,[38] and tax data, total expenditure on alcohol in 2015 was about ZAR85 billion, which suggests that only about 19% of total alcohol expenditure was recorded in the NIDS data. Because consumption and expenditure are under-reported to a similar degree, the estimates of the unit values, on average, are roughly correct. However, the extent to which households' misreporting of their alcohol consumption and expenditure deviates from the average degree of misreporting will distort the unit values and the subsequent analysis. However, even if there is some distortion in the unit values, the results are so clear cut that they are unlikely to invalidate the basic message of this article, namely that an effective MUP would substantially reduce alcohol consumption in heavy- and intermediate-drinking households.
Conclusions
Like most countries, SA imposes an excise tax on alcohol products. Increases in the tax increase the retail price and make the product less affordable, and therefore reduce consumption. However, excise taxes are not particularly effective in reducing alcohol consumption among heavy- and intermediate-drinking households, because these are relatively insensitive to changes in the price of alcohol. In this article, we showed that the imposition of an MUP on alcohol is a more targeted means of reducing heavy and intermediate drinking in SA. Heavy and intermediate drinkers typically consume much cheaper alcohol than moderate drinkers do. An MUP could substantially increase the average price that such drinkers pay for their alcohol, and, despite their relative price insensitivity, still bring about substantial changes in their alcohol consumption. An MUP could substantially reduce heavy and intermediate drinking in SA.
Acknowledgements. Useful comments and suggestions were received from the following: David Harrison, Senzo Hlophe, Carol-Ann Foulis. Lauren Platzky Richard Matzopoulos, Nicole Vellios, Veeral Patel and Michael Kilumelume.
Author contributions. CvW and GC conceptualised the article together. CvW wrote major portions of it, with GC helping out on the data analysis and writing.
Funding. This work was graciously funded by the DG Murray Trust.
Conflicts of interest. None.
References
1. World Health Organization. Global status report on alcohol and health 2018. Geneva: WHO, 2018. http://www.who.int/substance_abuse/publications/global_alcohol_report/gsr_2018/en/ (accessed 1 July 2019). [ Links ]
2. Vellios NG, van Walbeek CP. Self-reported alcohol use and binge drinking in South Africa. Evidence from the National Income Dynamics Study, 2014 - 2015. S Afr Med J 2018;108(1):33-39. https://doi.org/10.7196/SAMJ.2017.v108i1.12615 [ Links ]
3. World Health Organization. Global Health Observatory (GHO) data: Patterns of drinking score, https://www.who.int/gho/alcohol/consumption_patterns/drinking_score_patterns_text/en/ (accessed 1 July 2019). [ Links ]
4. Urban MR Fetal alcohol syndrome in South Africa. Prevalence, risk factors and prevention. Doctoral thesis. Ghent. Ghent University, 2017. [ Links ]
5. GBD 2019 Diseases and Injuries Collaborators. Global Burden of 369 diseases in 204 countries and territories, 1990 - 2019. A systematic analysis for the Global Burden of Disease Study 2019. Lancet 2020;396(10258):1204-1222. https://doi.org/10.1016/S0140-6736(20)30925-9 [ Links ]
6. Probst C, Parry CDH, Wittchen H, et al. The socioeconomic profile of alcohol-attributable mortality in South Africa. A modelling study. BMC Med 2018;16:97. https://doi.org/10.1186/s12916-018-1080-0 [ Links ]
7. Matzopoulos RG, Truen S, Bowman B, et al. The cost of harmful alcohol use in South Africa. S Afr Med J 2014;104(2):127-132. https://doi.org/10.7196/SAMT.7644 [ Links ]
8. National Treasury, South Africa. Budget Review 2019. 20 February 2019. http://www.treasury.gov.za/documents/national%20budget/2019/review/FullBR.pdf (accessed 19 August 2019). [ Links ]
9. Budlender D. National and provincial government spending and revenue related to alcohol abuse. Report prepared for Soul City. Community Agency for Social Enquiry, 2009. [ Links ]
10. Rubin E. To drink or not to drink. That is the question. Alcohol Clin Exp Res 2014;38(12):2889-2892. https://doi.org/10.1161/CIRCULATIONAHA.106.678375 [ Links ]
11. Burton R, Sheron N. No level of alcohol consumption improves health. Lancet 2018;392(10152):987-988. https://doi.org/10.1016/S0140-6736(18)31571-X [ Links ]
12. Matzopoulos R, Walls H, Cook S, et al. South Africas COVID-19 alcohol sales ban. Thepotentialfor better policy-making. Int J Health Policy Manag 2020;9(11):486-487. https://doi.org/10.34172/ijhpm.2020.93 [ Links ]
13. Sornpaisarn B, Shield KD, Osterberg E, Rehm J, eds. Resource tool on alcohol taxation and pricing policies. World Health Organization, June 2017. https://www.who.int/substance_abuse/publications/tax_book/en/ (accessed 21 August 2019). [ Links ]
14. Wagenaar AC, Salois MJ, Komro KA. Effects of beverage alcohol price and tax levels on drinking. A meta-analysis of 1003 estimates from 112 studies. Addiction 2009;104(2):179-190. https://doi.org/10.1111/j.1360-0443.2008.02438.X [ Links ]
15. Russell C, van Walbeek C. How does a change in the excise tax on beer impact beer retail prices in South Africa? S Afr J Econ 2016;84(4):555-573. https://doi.org/10.1111/saje.12123 [ Links ]
16. National Treasury, South Africa. Budget review, multiple years, http://www.treasury.gov.za/documents/national%20budget/defauit.aspx (accessed 20 August 2019). [ Links ]
17. Gill J, Chick J, Black H, et al. Alcohol purchasing by ill heavy drinkers, cheap alcohol is no single commodity. Public Health 2015;129(12):1571-1578, https://doi.org/10.1016/j.puhe.2015.08.013 [ Links ]
18. Cousins G, Mongan D, Barry J, et al. Potential impact of minimum unit pricing for alcohol in Ireland. Evidence from the National Alcohol Diary Survey. Alcohol Alcohol 2016;51(6):734-740. https://doi.org/10.1093/alcalc/agw051 [ Links ]
19. Gill J, Black H, Rush R, et aL Heavy drinkers and the potential impact of minimum unit pricing - no single or simple effect? Alcohol Alcohol 2017;52(6):722-729. https://doi.org/10.1093/alcalc/agx060 [ Links ]
20. Ludbrook A, Petrie D, McKenzie L, et al. Tackling alcohol misuse. Purchasing patterns affected by minimum pricing for alcohol. Appl Health Econ Health Policy 2012;10(1):51-63. https://doi.org/10.2165/11594840-000000000-00000 [ Links ]
21. InsutateofAlcohdStadies.Minimum unit pricing. IAS, 2017 https://wwwias.org.uk/?s=minimum+unit+pricing (accessed 16 December 2020). [ Links ]
22. Brooks L. Alcohol minimum price obeyed across Scotland, says report. Guardian, 1 August 2019. https://www.theguardian.com/society/2019/aug/01/alcohol-minimum-price-1aw-οbeyed-a cross-scotland-says-report (accessed 9 September 2019). [ Links ]
23. Scottish Government. Guidance on the implementation of minimum pricing for alcohol for sellers of alcohol and enforcement authorities in Scotland. 20 April 2018. https://www.gov.scot/publications/guidance-implementation-minimum-pricing-alcohol/ (accessed 9 September 2019). [ Links ]
24. Stockwell T, Auld CM, Zhao J, et al. Does minimum pricing reduce alcohol consumption? The experience of a Canadian province. Addiction 2012;107(5):912-920. https://doi.org/10.1111/j.l360-0443.2011.03763x [ Links ]
25. Stockwell T, Zhao J, Giesbrecht N, et al. The raising of minimum alcohol prices in Saskatchewan, Canada. Impacts on consumption and implications for public health. Am J Public Health 2012;102( 12):el03-e 110. https://doi.org/10.2105/AJPH.2012.301094 [ Links ]
26. Stockwell T, Wilhams N, Pauly B. Working and waiting. Homeless drinkers' responses to less affordable alcohol. Drug Alcohol Rev 2012;31(6):823-824. https://doi.org/10.1111/j.1465-3362.2012.00422.x [ Links ]
27. Carragher N, Chalmers J. What are the options? Pricing and taxation policy reforms to redress excessive alcohol consumption and related harms in Australia. New South Wales Bureau of Crime Statistics and Research, 2011. https://www.ojp.gov/ncjrs/virtual-library/abstracts/what-are-options-pricing-and-taxation-policy-reforms-redress (accessed 9 September 2019). [ Links ]
28. Purshouse RC, Meier PS, Brennan A, et al. Estimated effect of alcohol pricing policies on health and health economic outcomes in England. An epidemiological model. Lancet 2010;375(9723):1355-1364. https://doi.org/10.1016/SO140-6736(10)60058-X [ Links ]
29. Hunt P, Rabinovich L, Baumberg B. Preliminary assessment of the economic impacts of alcohol pricing policy options in the UK. Rand Europe, June 2010. https://assets.publishing.service.gov.uk/government/uploads/system/uploads/attachment_data/file/98137/economic-impacts-alcohol-pricing.pdf (accessed 9 September 2019). [ Links ]
30. Meng Y, Hili-McManus D, Brennan A, Meier P. Model-based appraisal of alcohol minimum pricing and off-licensed trade discounts bans in Scotland. A Scottish adaptation of the Sheffield Alcohol Policy Model (v2). University of Sheffield, January 2012. https://www.sheffield.ac.uk/polopoly_fs/1.156503!/file/scot-landjan.pdf (accessed 9 September 2019). [ Links ]
31. Angus C, Holmes J, Pryce R, Meier P, Brennan A. Model based appraisal of the comparative impact of Minimum Unit Pricing and taxation policies in Scotland. An adaptation of the Sheffield Alcohol Policy Model version 3. University of Sheffield, April 2016. https://www.sheffield.ac.uk/polopoly_fs/1.5653731/file/Scotland_report_2016.pdf (accessed 9 September 2019). [ Links ]
32. Southern Africa Labour and Development Research Unit, University of Cape Town. National Income Dynamics Study 2014 - 2015, wave 4 (Dataset). 2018. https://doi.org/10.25828/f4ws-8a78 (accessed 15 June 2018). [ Links ]
33. Southern Africa Labour and Development Research Unit, University of Cape Town. National Income Dynamics Study 2014 - 2015, wave 4 adult questionnaire. 2018. http://www.nids.uct.acza/documents/wave-4/wave-4-questionnaires/213-wave-4-adult-questionnaire (accessed 11 September 2019). [ Links ]
34. Probst C, Shuper PA, Rehm J. Coverage of alcohol consumption by national surveys in South Africa. Addiction 2017;112(4):705-710. https://doi.org/10.1111/add.13692 [ Links ]
35. Deaton A. Analysis of household surveys. A micro econometric approach to development policy. Reissue ed. Washington, DC. World Bank, 2018. [ Links ]
36. Van Walbeek C, Chelwa G. Using price-based interventions to reduce abusive drinking in the Western Cape Province. A report prepared for the DG Murray Trust, 2018. https://www.semanticscholar.org/paper/USING-PRICE-BASED-INTERVENTIONS-TO-REDUCE-ABUSIVE-Walbeek/a3454d5dcea3926d85cal959db66bb484de5b4b0?p2df (accessed September 2019). [ Links ]
37. Parkin M. Economics. 13th ed. Harlow, Essex. Pearson, 2019. [ Links ]
38. South African Wine Industry Statistics, 2019. http://www.sawis.co.za/info/download/Book_2019_statistics_english_web_final.pdf (accessed 15 September 2020). [ Links ]
 Correspondence:
G Chelwa
grievechelwa@gmail.com
Accepted 14 February 2021

