


Serviços Personalizados
Artigo
 Inglês (pdf)
 Artigo em XML
 Referências do artigo
Indicadores

Links relacionados
-
 Citado por Google
 -
 Similares em Google
Compartilhar

 Permalink
SAMJ: South African Medical Journal
versão On-line ISSN 2078-5135
versão impressa ISSN 0256-9574
SAMJ, S. Afr. med. j. vol.111 no.6 Pretoria Jun. 2021
http://dx.doi.org/10.7196/SAMJ.2021.v111i6.15345
RESEARCH
The costing of operating theatre time in a secondary-level state sector hospital: A quantitative observational study
J P SamuelI; A ReedII, III
IMB ChB, DA (SA); Department of Anaesthesia and Perioperative Medicine, Faculty of Health Sciences, University of Cape Town, South Africa
IIMB ChB, DA (UK), FRCA, MMed (Anaes), PG Dip Health Management; Department of Anaesthesia and Perioperative Medicine, Faculty of Health Sciences, University of Cape Town, South Africa
IIIMB ChB, DA (UK), FRCA, MMed (Anaes), PG Dip Health Management; Western Cape Department of Health, Cape Town, South Africa
ABSTRACT
BACKGROUND. There is no established costing model for operating theatres (OTs) in South Africa (SA), yet both health sectors have existing charges for OT time: in the state sector, Uniform Patient Fee Schedule (UPFS) rates, and in the private sector, rands per minute (ZAR/min) rates. Understanding the cost of providing the separate components of a health service is important for planning and funding purposes.
OBJECTIVES. Primary objective: To develop a costing model that would allow calculation of the ZAR/min cost of OT time. Secondary objective: To determine the actual costs, in order to establish the comparable costs that would be included in the ZAR/min charges for OTs in the private health sector.
METHODS. The OTs in a secondary-level, state sector hospital in Cape Town were used in this quantitative observational study to develop a top-down costing model for OTs in SA. The inclusive costing model was developed in a consultative process with professionals, managers and experts from the state and private sectors. The model was then populated with costs for the month of August 2018. Costs were considered in the categories of full costs, shared costs, and capital or annualised costs.
RESULTS. Owing to uncertainty in costing of OTs, two models - with different annualisation times assigned to the capital costs - were developed to demonstrate the difference. For shared costs, correction factors were determined using either an activity-based (workload) factor or a more generic estimation of workload using theatre nursing staff as a percentage of total hospital nursing staff. To determine a ZAR/min cost of creating a minute of available theatre time, all the annual costs were divided by minutes that the OTs are explicitly available, each year, to provide patient care. The model was then populated with costs using the appropriate correction factors. The longer annualisation model costed OT time at ZAR31.46 per minute, and the shorter annualisation model at ZAR33.77 per minute. In both the longer and shorter capital annualisation models, nursing was the largest contributor to costs at 36% and 33%, respectively, followed by construction costs at 9% and 11%, and then OT equipment at 8% and 11%.
CONCLUSIONS. An inclusive, top-down costing model for OTs in SA was developed. This costing model will support work to develop costing for individual procedures and the appropriate charge for planned and emergency OT time, and to better determine budgeting for OT services. Meaningful critique of the model will improve its fidelity, and is likely to increase its utility, especially as SA moves towards universal health coverage.
The development of global surgery has highlighted both the crucial role of surgery in health systems[1] and the financial challenges in developing and growing surgical services,[2] of which a key cost is creating operative time in operating theatres (OTs). OTs are an expensive component of any acute hospital, owing to their specialised infrastructure and equipment requirements,[3] coupled with high nurse ratios per patient and an intensive requirement for support services such as portering, linen and environmental hygiene.
There is no published costing model for OTs in South Africa (SA), from either the state sector or the private sector. State sector hospitals do not routinely charge for OT time, and there is no available rands per minute (ZAR/min) cost of their OT time, or indication as to what portion of their budget is spent on OTs. There are, however, at least two levied amounts for OT time in SA:
• Uniform Patient Fee Schedule (UPFS)[4] rates were established using a 'basket' of costs, representative of the average cost for each category of surgical procedure, divided into two levied amounts, a facility fee and a professional fee, that both depend on the type of professional and the level of hospital providing the service. While it is not clear how the UPFS fees were calculated, the UPFS user guide offers some explanation, stating that the 'fees have been calculated to include overheads cost such as electricity and provision of general equipment as well as the cost of consumables. The methodology has also taken into account the salaries of support staff.'
• Billing rate, per minute, for theatre time in the private health sector, for which we can find no available costing model. Private hospital providers have defined charges for OT time that funders, or patients, will pay. These charges must incorporate the entire costs of building, equipping, staffing, operating and maintaining their OTs. This per-minute rate must include a profit margin. Information used to determine the per-minute rate is not freely available.
The recent Health Market Inquiry (HMI) reported that theatre and ward fees had increased the most from 1997 to 2013.[5] The cost of theatre use overtook the combined expenses of medicines and consumables, as a percentage of total costs, in 2006, although the other combined costs may have been influenced by the growing category of global fees.
The HMI's final report highlighted the lack of interrogation of the 'base price' that was being charged in 2003, at the end of what the HMI terms 'the period of collusive activity', and that this collusive pricing before 2004 set an inappropriate starting value for costing, even though subsequent increases have been inflation linked.[6] The HMI authors propose an independent and impartial supply-side regulator for healthcare costs, to determine what are affordable and sustainable charges. The lack of a model to determine the cost of theatre time will hamper efforts to regulate charges, and to fund the proposed National Health Insurance (NHI) plan.
It is important to understand the cost of providing the separate components of a health service, as is distinguishing the costing from the charge that is levied for such services[7] - the charge being an amount that will be levied, or billed, for that unit of service, usually including a profit margin.
Objectives
The primary objective of this study was to develop a costing model that would allow us to calculate the ZAR/min cost of OT time at New Somerset Hospital (NSH), a state sector regional hospital. Using a top-down approach, the overall expenditure on each item in the basket of costs is determined at a central level, and costs are then averaged from the total expenditure.
The secondary objective was to determine the actual costs, and to establish the comparable costs that would be included in the ZAR/ min charges for OTs in the private health sector.
Methods
This quantitative observational study used the OTs in a secondary-level state sector hospital in Cape Town to develop a top-down costing model for OTs in SA. Ethical approval for the study was obtained from the Human Research Ethics Committee of the Faculty of Health Sciences at the University of Cape Town (ref. no. HREC 514/2018).
An initial top-down costing model was developed by the authors, AR and JPS, after reviewing the available literature and with AR's 'local' knowledge as the functional business unit (FBU) manager. This model was then presented to and discussed with private sector health actuaries, with state sector business management and systems specialists, and finally with both an academic health economist and a state sector health economist.
The model was then populated with data from NSH, a 344-bed regional (level 2) hospital that has a full surgical service, providing patients with access to the disciplines of general, orthopaedic, urological, gynaecological and ear, nose and throat surgery.
Data were collected by the authors with the assistance of the relevant hospital departments and key role-players in managerial positions including the chief executive officer (CEO), together with the experts in the provincial Infrastructure and Health Technology Directorate of the Western Cape Government: Health. We obtained the municipal rates and insurance costs for a similarly sized private sector facility nearby from one of the large hospital groups. Infrastructure costing was estimated by an experienced private sector quantity surveyor with health facility expertise.
Much of the data collected was for the month of August 2018, in the 2018/19 financial year. All salaries of the relevant personnel as well as the staff numbers in the various hospital departments were obtained from human resources (HR). Data were also collected from the pharmacy, central sterilising and supply department (CSSD), supply chain management (SCM), engineering, administration, laundry and finance. LOGIS (Logistical Information System) is the system currently used by the provincial department to procure, control and regulate optimal stock levels, and was used to determine the costing of essential consumables in the 2018 financial year. Transversal pharmacy costs were available from the provincial JAC pharmacy services management system (WellSky International Ltd, formerly JAC Computer Services Ltd), to determine the cost of medication and pharmacy items that would not be billable to individual patients in the private sector.
Costs were considered in three main categories:[8]
• Full costs. Annual costs that are 100% attributable to running an OT.
• Shared costs. Annual costs that are partially attributable to OT management.
• Capital or annualised costs. Initial OT-specific costs such as equipment and construction.
To determine a ZAR/min cost of creating a minute of available theatre time, all the annual costs in the model need to be divided by the total number of hours that all the OTs are available, per year, to provide patient care. The available hours were defined as hours when each OT is both staffed and expected either to have a patient in the room, or to be immediately available for a patient, as defined in the hospital's block allocation. The three OTs at NSH provide a combined 251 hours per standard working week (Monday to Sunday), which works out to 13 052 hours per year. We corrected for the hours lost on weekday public holidays, an average of 10 days per year, when only one out of three theatres is operational. This amounted to 166 hours lost per year, which was deducted from the total available annual hours to give 12 886 hours (773 160 minutes) (detailed in the supplementary Costing Model Spreadsheet (CMS), available at http://samj.org.za/public/sup/15345-model.xlsx).
Patients in private facilities are billed for theatre time separately from the consumables used for their surgery, and the professional fees of the surgeon and anaesthetist. We excluded the salaries of state-employed medical personnel, and only included the general use consumables required to run OTs, that cannot be charged for separately in the private sector.
It is important to account for the depreciation of infrastructure (building and construction) capital costs. Private healthcare providers usually annualise their buildings over 20 - 30 years.[9] Medical equipment, including anaesthetic and theatre equipment, is usually annualised over 7 years according to the manufacturer's specifications and according to advisories produced by American Hospital Association, the Biomedical Advisory Group of South Australia, and the Emergency Care Research Institute, an independent not-forprofit corporation that works to improve the quality of patient care.[10] In reality, most equipment is used for as long as it is functional and supported, frequently for longer than the 'estimated useful life'.[11,12]
We created a model with two different depreciation times assigned to the capital costs. We selected to annualise these costs instead of depreciating them, over time, to a zero value.
The higher-cost, shorter-term (ST) model contains a 7-year annualisation for surgical and theatre equipment and a 20-year building annualisation cost; the longer-term (LT) model contains a 10-year annualisation for equipment and a 30-year building and construction annualisation.
The information technology (IT) equipment was annualised over 3 years in both the ST and LT models and the linen cost was the only cost depreciated, to a zero value, over 3 years.
The formula utilised to calculate the equivalent annualised cost (EAC) was:[13]
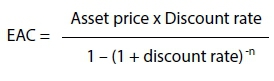
where Discount rate = return required to make project viable; n = annualised period in years.
Purchase cost of the land (7.5%) for a facility should be considered in costing models, but there is no agreement about costing this price in costing models, for three reasons:[8] (i) the land value is dependent on the location; (ii) it will typically escalate in value; and (iii) the cost is shared across the whole facility. Our model used a quantity surveyor, 'normal' factor, of 7.5% of the infrastructure cost, as an estimate for the cost of the land.
Table 1 provides information on how the data were collected and used in the costing model.
Shared costs correction factors
The following explains the correction factors used in our shared costs, as these factors may be unique to each hospital.
Human resources
NSH employs 736 employees, of whom 30 (4%) are employed in the OR. A factor of 0.04 of the total employee cost of the HR component was therefore used to determine the HR cost.
SCM and finance staff
The hospital CEO calculated the percentage of the hospital's goods and services, and capital expenditure budgets, allocated to the main theatre suite from April 2018 to March 2019. Twenty-three percent of the hospital's monetary value, goods and services expenditure was related to the main OT, so a factor of 0.23 was applied to the total employee cost of the hospital's SCM and finance components.
CSSD staff
Using a recently installed instrument management system in the CSSD, it was determined that in a typical month, 1 860 surgical packs and trays were prepared, of which 1 149 (62%) were for the main OT. The remainder were used in the obstetric theatre complex, and were excluded in our model. Our model therefore used a factor of 0.62 against the all-inclusive cost of the CSSD.
Clinical engineering staff
A job card is completed for all work performed by the clinical engineers. Using these job cards, we determined that 40% of the engineers' work is done for the main theatre complex. A factor of 0.4 was therefore used for the salary costs of the engineers.
Air conditioning plant filters and maintenance
The clinical building has a single air conditioning plant providing ducting to two equivalent clinical areas. The cost of the filters and annual maintenance was obtained from the hospital's workshop, and a factor of 0.5 was utilised.
Workforce correction factor
Throughout the hospital, the nursing staff are a relatively evenly spread workforce and the ratio of theatre nurses to total hospital nurses therefore gives us a reasonable idea of the workforce requirements, or activity-based costing, of this specific area.[14] The patient/nurse ratio across the hospital gives a measure of the patient workload intensity, including the acuity of clinical work in different units, is a key cost driver, and can be broadly correlated with the hourly billing possible, with the highest acuity being in the OTs, followed by the intensive care and high-care units, the emergency centre and then the wards.[14, 15]
The nursing workforce of the hospital studied numbers 366 nurses, of whom 25 (6.8%) are allocated to the main OT. This correction factor of 0.068 was used throughout the costing as the 'workforce correction factor'. We applied this factor to the costs when we felt that no clear method existed to determine the portion specifically attributable to theatre management.
After the total annual cost was calculated, it was divided by 773 160 minutes of OT time available in a year, to calculate the ZAR/min cost.
Results
The full costing model is presented in Table 1, which includes both the LT and ST models. The LT model calculated 1 minute of theatre time at NSH as costing ZAR31.46 if the relevant equipment and construction are annualised over 10 and 30 years, respectively. The ST model, annualising equipment over 7 years and construction over 20 years, showed a cost of ZAR33.77/min.
In both models the largest contributor to costs was the cost of nursing, comprising ZAR11.30/min and accounting for 36% of the costs in the LT model and 33% in the ST model. Construction costs comprised the second-largest cost component, 9% in the LT model and 11% in the ST model. The third-largest cost contribution was from the theatre equipment, at ZAR2.66/min (8%) in the LT model and ZAR3.65/min (11%) in the ST model. The fourth-largest contributor to per-minute cost was head office support, at ZAR2.12 per minute (7% in the LT model and 6% in the ST model).
The total costs of our three main categories are presented in Table 2. A full breakdown of the complete costing model can be seen on the CMS (http://samj.org.za/public/sup/15345-model.xlsx).
Discussion
We developed an inclusive, top-down costing model approach exploring the costs of building, equipping, staffing, and operational running and maintenance of an OT complex. The model allowed us to estimate the average costs, for each minute in a year, for OTs in a busy regional hospital, and provides useful data to determine the actual costs of creating OT time. It should also assist in determining what proportion of a facility's budget is spent on running and maintaining their OT.
After the model was populated with costs from all the categories, a total cost of ~ZAR32/min could be calculated for OTs in this state sector hospital.
We included as many relevant costs as we could, and preferred to over-estimate costs in order to be as inclusive as possible. It can be seen from the available theatre minutes that any additional annual amount of ~ZAR700 000 will influence the per-minute cost by ~ZAR1/min, and a change in costs of ZAR50 000 per year will therefore only influence the ZAR/min by ~6 cents.
Costs including construction, equipment and staffing are fixed in a state hospital, and as such are static no matter what the throughput. Our model incorporates all costs that are responsible for creating the current theatre minutes per year. If theatre utilisation were to go up significantly, only at the point where staff numbers are required to increase would there be a sudden difference in cost per minute. This would also be true for any service requirements requiring significant spend on additional capital equipment, or an additional theatre.
One of the strengths of our study was that it was conducted at NSH. There are several reasons why the main OTs at NSH were an appropriate site for developing a model for costing OT time, and for populating that model. The unit:
• operates as a discrete unit with a ring-fenced, permanent nursing staff complement
• has clearly defined hours of operation, with defined blocks available for scheduling cases in
• has low reliance on agency staff.
Further strengths included a 2016 audit (unpublished) demonstrating a high raw and adjusted utilisation, suggesting that the main OTs at NSH can be classified as a well-performing unit, using allocated daytime blocks well.[16]
The hospital had data to allow a reasonable estimation of the proportion of work that the main OT required, from the various shared service providers and services within the hospital. These included:
• Job cards for clinical engineering workload
• CSSD packs from the instrument management system
• Electrical reticulation allowed separate measurement of electricity use for both the main OT and the CSSD
• Data on laundry stock and linen costs were available
• The hospital's FBU structure gave access to budget expenditure, with the assistance of the CEO
• Pharmacy costs were available from the provincial JAC pharmacy services management system
• Essential consumable costs, of a transversal nature that are not utilised for individual patients, and hence were included in the overall cost of creating OT time, were obtainable from LOGIS.
Limitations to our model are the fact that we are designing an original model that uses correction factors, none of which have been validated. Air conditioning is from a shared system, so air conditioning costs were calculated using hourly ambient temperatures, to a control temperature of 18 - 21oC for a full year.
In order to meet our secondary objective, we included costs such as insurance and municipal rates that we received from a similar-sized private hospital in Cape Town, which we believe was fair, and utilising these values allowed a better comparison with private sector charges.
Other challenges included methods to fairly include costs such as construction and the cost of land in a hospital built almost 40 years ago. For the cost of the head office component, only their annual operating budget was considered, and this does not account for the construction costs of the head office infrastructure.
Meaningful critique of the costing model will improve its fidelity, and will probably increase its future utility. Tools to measure the cost for individual facilities should prove useful as SA moves towards universal health coverage, and potentially a dominant funder model such as NHI.
The two main approaches in costing studies are 'top-down' and 'bottom-up'[8]
Bottom-up costing uses detailed activity and input usage data from records or observed usage at the service provider level to estimate unit costs. A bottom-up costing is more appropriate for determining the actual costs of individual surgical procedures, is a much more time- and resource-intensive method, and would not be possible without the overall cost of establishing and running an OT.
We utilised a top-down approach to explore the costs of building, equipping, staffing and running an OT. This approach allows us to estimate the average running costs of the OT and will provide useful data to determine the actual costs of creating OT time, and to assist in determining what proportion of a facility's budget is spent on establishing, running and maintaining their OTs. Others have shown that bottom-up may be more accurate than top-down costing, but in the setting of costing the generation of a unit of available time, independent of utilisation rates, top-down may be better.[14]
Our proposed model uses an economic-based approach taking into account the cost (depreciation and interest) of the capital, using a discount factor. The economic approach includes the opportunity cost of the funds invested, and is distinct from a simple accounting-based approach (averaging the capital cost over the useful life); it tends to provide a 10 - 15% higher annual cost, as seen in this model costing theatre time. Variations in the discount factor used in the economic-based approach have much less of an effect than the difference between the accounting and economic approaches.[17]
It is important to consider the difference between the cost of and the charge for a service. Costs are the expenses incurred by the hospital in order to provide a patient service. Charges are the list prices a hospital must set for the services it provides.
So, while we have modelled and determined a cost per minute of theatre time, that cost cannot simply be multiplied by the time a patient is in the OT, because of the utilisation factor.[18] Very efficiently run theatres are occupied by patients for ~70% of the time, during allocated daytime blocks, so charges for their use should at least include the cost of the 'unoccupied' time. Offering an urgent or emergency theatre is likely to have a much lower utilisation factor, and the availability cost will therefore be significantly higher than more efficient, allocated daytime blocks. Previous unpublished data from these OTs demonstrated a raw utilisation of 83% for the weekday block allocations, the one theatre with a significant emergency caseload having a lower raw utilisation than the two theatres with almost entirely scheduled cases. After-hours utilisation has not been formally quantified, but will be far lower.
To demonstrate the impact of utilisation, using the data from our LT model, costing ~ZAR32/min at NSH, if we factor in different raw utilisation factors through a 24-hour, 7-day work week:
• a 50% utilisation would cost ZAR64/min
• a 40% utilisation would cost ZAR80/min
• a 30% utilisation would cost ZAR106/min
• a 20% utilisation would cost ZAR160/min.
The utilisation factor demonstrates the importance of measuring and improving utilisation, a factor controlled by both resource allocation and daily block allocation and management. Increasing the utilisation of the facility, after hours on weekdays and over weekends, would decrease the per-minute costs contributed by capital costs. Working extended hours would, however, involve additional water and electricity costs, and staffing costs for nurses, porters and support staff may rise considerably during anti-social hours. Before embarking on this option, detailed modelling of the benefits would be required.
Comparative charges from private sector healthcare providers for major theatre time were between ZAR155/min and ZAR273/min in 2018[19,201 (also see supplementary files available at http://samj.org.za/public/sup/15345-tariffs.pdf and http://samj.org.za/public/sup/15345-invoice.pdf). The state sector could create this service, at NSH, at a cost of ~ZAR32/min, unadjusted for utilisation, according to our study. The commercial imperative of private sector healthcare demands a premium added as a profit margin for shareholders. Therefore, from a business perspective, the charge for theatre time must be more than the cost of providing the service, as discussed above.
Our model can be further developed to explore the full costs of procedures taking into account medical staff, drugs and consumables, but this initial work should prove to be extremely beneficial. Further research into costing of individual surgical procedures will help to determine the cost/benefit intervention of surgery in the setting of patient-centred healthcare.
Conclusions
Our costing model provides the first published attempt to create a basket of costs for calculating the ZAR/min cost of creating availability of an OT service in SA, and allows for reasonable determination of the money spent by the state to provide OT services in a secondary-level hospital. This amount appears to be significantly less than what is charged for these services in the private sector; however, the difference between costs of and charges for a service must be appreciated. Critique of the model is likely to enhance its fidelity, thereby improving its utility for future use.
As far as we know, this is the first study in SA that specifically examines the cost to government of providing an OT service. Further development of OT costing models will be useful with the proposed implementation of NHI, and in determining the value of individual surgical procedures.
Declaration. The research for this study was done in partial fulfilment of the requirements for JPS's MMed (Anaes) degree at the University of Cape Town.
Acknowledgements. We received widespread assistance from our colleagues at NSH, especially the senior medical managers Dr D Stokes and Dr J Hendricks, as well as support service colleagues Mr Ricardo Cajada, Mr Beven Mashedi, Mr Alf Challis, Ms N Wyngaard and Mr W Padayachee. The provincial chief directorate infrastructure and technical management assisted with costing infrastructure and services, in particular Mr Hendrik Radyn and the past chief director, Mr Andy Cunninghame, who provided assistance and technical expertise in measuring and calculating the electricity usage. Mr Reynard Smith, an independent quantity surveyor, assisted with the principles and detailed costing of the infrastructure and associated costs.
Author contributions. AR conceptualised the project. AR and JPS both developed the model, acquired the data, and wrote the manuscript.
Funding. None.
Conflicts of interest. None.
References
1. Meara JG, Greenberg SLM. The Lancet Commission on Global Surgery Global surgery 2030: Evidence and solutions for achieving health, welfare and economic development. Surgery 2015;157(5):834-835. https://doi.org/10.1016/j.surg.2015.02.009 [ Links ]
2. Chao TE, Sharma K, Mandigo M, et al Cost-effectiveness of surgery and its policy implications for global health: A systematic review and analysis. Lancet Glob Health 2014;2(6):e334-e345. https://doi.org/10.1016/s2214-109x(14)70213-x [ Links ]
3. Childers CP, Maggard-Gibbons M. Understanding costs of care in the operating room. JAMA Surg 2018;153(4):e176233. https://doi.org/10.1001/jamasurg.2017.6233 [ Links ]
4. Western Cape Government. https://www.westerncape.gov.za/dept/health/documents/public_info/W/19578?toc_page=2 (accessed 21 April 2021). [ Links ]
5. Competition Commission of South Africa. Healthcare Market Inquiry: Provisional Findings and Recommendations Report. July 2018. http://www.compcom.co.za/healthcare-inquiry/ (accessed 14November 2020) [ Links ]
6. Competition Commission of South Africa. Health Market Inquiry: Final Findings and Recommendations Report. September 2019. Government Gazette No. 42861, 29 November 2019. https://www.gov.za/sites/default/files/gcis_document/201911/42861gon1533.pdf (accessed 14 November 2020) [ Links ]
7. Macario A. What does one minute of operating room time cost? J Clin Anesth 2010;22(4):233-236. https://doi.org/10.1016/j.jclinane.2010.02.003 [ Links ]
8. Ozaltin A, Cashin C. Costing of health services for provider payment: A practical manual based on country costing challenges, trade-offs, and solutions. Joint Learning Network for Universal Health Coverage, 2014. https://www.jointlearningnetwork.org/wp-content/uploads/2019/11/JLN_Costing_Manual.pdf (accessed 24 June 2020). [ Links ]
9. Cunnama L, Sinanovic E, Ramma L, et al. Using top-down and bottom-up costing approaches in LMICs: The case for using both to assess the incremental costs of new technologies at scale. Health Econ 2016;25(S1):53-66. https://doi.org/10.1002/hec.3295 [ Links ]
10. Biomedical Engineering Advisory Group. Life span of biomedical devices. Guidance paper, 2004. http://cedglobal.org/download/Life%20Span%20of%20Biomedical%20Devices%20-%20Guidance%20Paper%20Final.pdf (accessed 14 June 2019). [ Links ]
11. Prowse P, Kelso S, Austman R. Implementation of a useful life reference for medical devices in Canada. CMBES Proc 2018;41:May. https://proceedings.cmbes.ca/index.php/proceedings/article/view/688 (accessed 16 June 2020). [ Links ]
12. Halbwachs, H. Maintenance and the life expectancy of healthcare equipment in developing economies. Health Estate 2000;54(2):26-31. [ Links ]
13. Sinclair DR. Equivalent annual cost: A method for comparing the cost of multi-use medical devices. Can J Anesth 2010;57(5):521-522. https://doi.org/10.1007/s12630-010-9287-3 [ Links ]
14. Oker F, Ozyapici H. A new costing model in hospital management. Health Care Manag 2013;32(1):23-36. https://doi.org/10.1097/hcm.0b013e31827ed898 [ Links ]
15. Stey AM, Brook RH, Needleman J, et al. Hospital costs by cost center of inpatient hospitalization for Medicare patients undergoing major abdominal surgery. J Am Coll Surg 2015;220(2):207-217.e11. https://doi.org/10.1016/j.jamcollsurg.2014.10.021 [ Links ]
16. Arcidiacono G, Wang J, Yang K. Operating room adjusted utilisation study. Int J Lean Six Sigma 2015;6(2):111-137. https://doi.org/10.1108/ijlss-02-2014-0005 [ Links ]
17. Riewpaiboon A, Malaroje S, Kongsawatt S. Effect of costing methods on unit cost of hospital medical services. Tïop Med Int Health 2007;12(4):554-563. https://doi.org/10.1111/j.1365-3156.2007.01815.x [ Links ]
18. Hartmann D, Sunjka B. Private theatre utilisation in South Africa: A case study. S Afr Med J 2013;103(5):285-287. https://doi.org/10.7196/SAMJ.6460 [ Links ]
19. Netcare. Tariff schedule 2019. https://www.netcarehospitals.co.za/Portals/3/Images/Content-images/PDF/2019-Private-Paying-Patients.pdf (accessed 3 September 2020). [ Links ]
20. Compensation Fund. Scale of fees for private hospitals (57/58) (per diem tariff) Government Gazette No. 41596, 25 April 2018. https://www.coidlink.co.za/Downloads/Tariffs/2018/Private%20hospital%20fees%2001%20April%202018.pdf (accessed 21 April 2021). [ Links ]
 Correspondence:
A Reed
anthony.reed@uct.ac.za
Accepted 11 January 2021

