


Serviços Personalizados
Artigo
 Inglês (pdf)
 Artigo em XML
 Referências do artigo
Indicadores

Links relacionados
-
 Citado por Google
 -
 Similares em Google
Compartilhar

 Permalink
SAMJ: South African Medical Journal
versão On-line ISSN 2078-5135
versão impressa ISSN 0256-9574
SAMJ, S. Afr. med. j. vol.111 no.3 Pretoria Mar. 2021
http://dx.doi.org/10.7196/samj.2021.v111i3.14669
RESEARCH
Economic growth as an underlying probable systemic driver for childhood obesity in South Africa: A Joinpoint regression and ecological analysis over 10 years
P T PisaI, II, III; N M PisaIV; P ChikandiwaV; A ChikandiwaVI
IPhD; MRC/Wits Developmental Pathways for Health Research Unit, Department of Paediatrics and Child Health, Faculty of Health Sciences., University of the Witwatersrand, Johannesburg, South Africa
IIPhD; Department of Human Nutrition and Dietetics, Faculty of Health Sciences, University of Pretoria, South Africa
IIIPhD; Right to Care, Centurion, South Africa
IVPhD; Department of Transport and Supply Chain Management, University of Johannesburg, South Africa
VMSc; Department of Transport and Supply Chain Management, University of Johannesburg, South Africa
VIPhD; Wits Reproductive Health and HIV Institute, Faculty of Health Sciences, University of the Witwatersrand, Johannesburg, South Africa
ABSTRACT
BACKGROUND: Childhood obesity has become a global public health problem and is a known risk factor for type 2 diabetes, cardiovascular disease, hypertension, stroke, myocardial infarction and various cancers in later adulthood. Associations between adult obesity and economic growth, technological changes, socioeconomic status and economic inequities have been reported, but limited data are available for children and adolescents in countries that are undergoing an epidemiological health transition exhibiting both under- and overnutrition
OBJECTIVES: To demonstrate childhood obesity trends and explore their associations with economic growth in South Africa (SA
METHODS: This was a retrospective review and analysis of obesity and economic growth trends in SA. Data for obesity levels were obtained from national surveys conducted in SA youths in 2002, 2008 and 2012. Economic growth indicators (EGIs), namely gross domestic product (GDP) per capita, household final consumption expenditure and Gini coefficient, were obtained from the World Bank and IHS Global Insight databases. Obesity trends for 2002 - 2012 are presented by gender and ethnicity. Annual percentage changes (APCs) in obesity prevalence were computed to assess obesity trends using the linear Joinpoint regression
RESULTS: An overall increase in obesity prevalence over time from 3.8% to 6.0% was observed. Females had higher levels across all time points. APCs in both males (7.8%; 95% confidence interval (CI) 0.3 - 15.9; p=0.01) and females (3.1%; 95% CI -14.7 - 24.7; p=0.30) were observed. Among black Africans, coloureds and whites, females had higher obesity levels than males for the three time points. For males, the prevalence of obesity was highest in whites and Asians/Indians, whereas coloureds and blacks had lower levels across all time points. However, the black male population had the highest APC increase (9.4%; 95% CI -23.0 - 55.3; p=0.20). The prevalence of obesity was positively and inversely associated with GDP per capita and the Gini coefficient, respectively
CONCLUSIONS: An increase in childhood and adolescent obesity over time was observed, while trend associations between obesity and EGIs exist
The emergence of non-communicable diseases (NCDs), including type 2 diabetes, hypertension and obesity, in low- to middle-income countries (LMICs) has raised global concerns.[1,2] A need to reprioritise use of limited resources, capacity and infrastructure in LMICs is important. In view of limited resources to deal with emerging NCDs, prevention seems the only feasible and sustainable approach. Communicable diseases have been the priority for most LMICs, but shifts in disease burden are being observed. These shifts have shown increases in chronic diseases, warranting new and innovative health strategies in LMICs.[3-5]
Obesity has become a global public health problem and is a known risk factor for type 2 diabetes, cardiovascular disease, hypertension, stroke, myocardial infarction and various cancers.[6,7] However what is more concerning are the increasing levels of obesity among children, adolescents and young adults globally.[8,9] Recent data from a pooled analysis of 2 416 population-based studies on 128.9 million participants aged >5 years, including 31.5 million aged 5-19 years, indicate that the number of obese children and adolescents (aged 5 -19 years) worldwide has risen 10-fold in the past 4 decades.[8,9] More children and adolescents are projected to be obese than moderately or severely underweight by 2022.[8,9] Data suggest alarming increases in obesity among children and adolescents in LMICs, particularly in sub-Saharan Africa.[8-10]
LMICs, including South Africa (SA), are characterised by increased economic development. However, these gains are accompanied by negative changes and shifts in both dietary and physical activity patterns.[4,5] Increased adoption of more westernised diets and increased sedentary behaviour, due to modernisation, improved transport systems and easy accessibility to unhealthy fast foods, are some of the factors that increase obesity and its associated health problems in LMICs, including SA.[4,5] Improving economic growth has become the main agenda for LMICs, including SA. It is associated with improved access to healthcare, control of infectious communicable diseases, and improved quality of life for many[11] However, economic growth has also accelerated other negative transitions, especially increases in and emergence of NCDs.[3] Associations between adult obesity and economic growth, technological changes, socioeconomic status (SES), and economic inequities and insecurity[12-16] have been reported, but limited data are available for children and adolescents in countries such as SA that are undergoing an epidemiological health transition exhibiting both under- and overnutrition.
Objectives
To report trends for childhood and adolescent obesity in SA over time and explore the associations between SA's economic growth, using various economic growth indicators (EGIs), and childhood obesity levels over a specified period.
Methods
Data sources
National survey data on obesity were used in the present analysis. The national surveys were conducted among SA youth in the years 2002, 2008 and 2012. We provide brief descriptions of the surveys, in the course of which anthropometric data, namely weight and height, were collected and measured through standard practices. Detailed descriptions of the strategies employed in the national surveys have been reported comprehensively elsewhere.[17-19] Obesity measures used in the SA Youth Risk Behaviour Surveys (YRBSs) were derived from the body mass index (BMI) projections developed by Cole et al.[20]
The 2002 and 2008 YRBSs
Both YRBSs were conducted to establish the prevalence of important risk behaviours affecting the country's youth, such as nutrition and physical activity. In these two surveys, the study population comprised grade 8, 9, 10 and 11 public school learners in nine provinces. The 1999 national schools database from the School Information Services Directorate, National Department of Education, was used as the sampling frame to obtain the enrolment numbers in public schools. Independent or private schools were excluded from the study population.
More information on the sample selection, which included two-stage sampling, has been provided elsewhere.[17,18] In the 2002 survey, 10 699 learners in 345 classes submitted completed questionnaires.[17] The weighted response rate was 72.5%, while the overall response rate was 68.3%. Overall, the sample consisted of 54.0% females and 46.0% males. Most of the learners classified themselves as black Africans (79.5%), while 9.0% classified themselves as coloured, 8.9% as white and 1.4% as Asian/Indian.[17] In the 2008 survey, a total of 10 270 learners in 330 classes completed questionnaires. The weighted response rate was 76.8% and the overall response rate 71.6%. Most of the participants (83.8%) were aged between 14 and 18 years, with 4.3% of learners below this range and 11.9% aged >18.[1] More than three-quarters of the participants identified themselves as black (78.1%), 14.2% as coloured, 5.7% as white and 1.1% as Asian/Indian.[18]
South African National Health and Nutrition Examination Survey (SANHANES-1), 2012
The purpose of SANHANES-1 was to characterise the prevalence of NCDs and their risk factors in SA.[19] The sampling frame of SANHANES-1 was individuals of all ages living in SA. The study employed a multistage disproportionate, stratified cluster sampling approach. A total of 25 532 individuals (92.6%) completed the survey. This survey sample comprised participants from both urban (64%) and rural (36%) settings. The proportions of blacks, whites, coloureds, Asians/Indians and others were 69%, 4%, 20%, 8% and
0.3%, respectively; 45% of respondents were male and 55% were female.[19] A total of 13 341 youths (<24 years) responded to the questionnaire interview, and approximatively half (n=6 615) of them had a physical examination done.[19]
Economic growth indicators
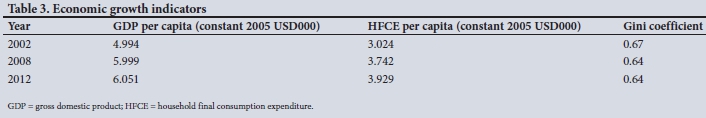
Economic growth is the annual change in the value of production of goods and services in a country. Indicators of economic growth used in this analysis were gross domestic product (GDP) per capita, household final consumption expenditure (HFCE) and Gini coefficients. We present data for GDP per capita and HFCE in USD (constant prices 2005). GDP per capita is a proximate measure of the income derived by individuals in the total population. It is calculated by dividing a country's total output (measured by the GDP) in a given year by the total population in the same year.[21] HFCE measures the value of all goods and services purchased by households, but excludes property.[21] The Gini coefficient is a standard measure of the distribution of wealth and inequality in an economy[21] EGI data were sourced from the World Bank and IHS Global Insight databases.[21,22]
Data analysis
We present the obesity prevalence (%) for the participants between 2002 and 2012 by gender. We further stratify the obesity prevalence (%) by ethnicity, which reflects as a proxy for SES and education level in the SA context. We also present GDP per capita, HFCE and Gini coefficients for the same time points as obesity data. The trend associations between EGIs and obesity prevalence were computed by plotting unadjusted time trends for obesity prevalence against GDP per capita, HFCE per capita and Gini coefficients by gender and ethnicity. Additionally, annual percentage changes (APCs) were calculated to assess obesity trends using the linear Joinpoint regression: log (ratey) = b0 + b1y, with log (ratey) being the natural log of obesity prevalence in year y as methodologically described previously in cancer-related trend analysis.[23,24] The APCs andp-values were calculated using the formula: (eb1 - 1) X 100 from the Joinpoint Regression Program, version 4.3.1.0 (National Cancer Institute, USA), to quantify the magnitude of changes in obesity trends over time.[25] A p-value <0.05 indicates a significant change in trend.
Results
Obesity prevalence data for the three time points 2002, 2008 and 2012 are presented in Fig. 1. Table 1 presents obesity prevalence by gender. Before stratifying by gender, an overall increase over time from 3.8% to 6.0% was observed. Females had higher levels across all time points, although numerical increases were observed in both sexes between 2002 and 2012 (2.5% for males and 1.8% for females). Through Joinpoint regressions we observed positive APCs in both males (7.8%; 95% confidence interval (CI) 0.3 - 15.9; p=0.01) and females (3.1%; 95% CI -14.7 - 24.7; p=0.30). When both sexes were combined, a positive APC of 4.8% (95% CI -3.8 - 14.0; p=0.1) was observed (Fig. 1).
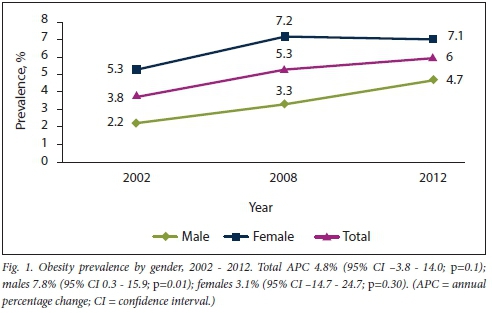
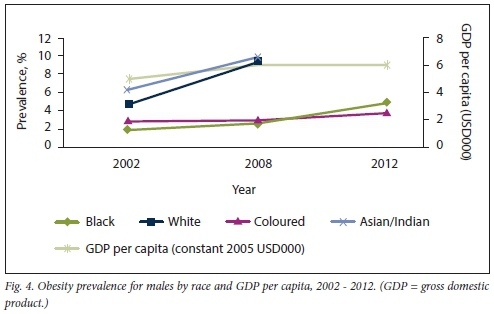
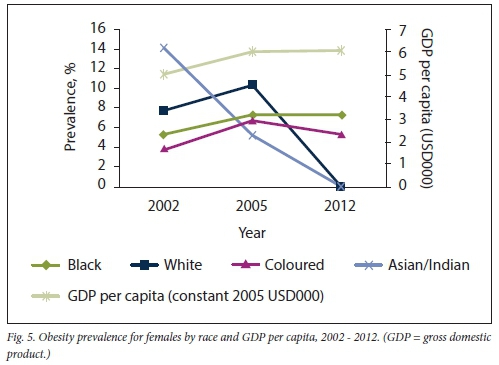
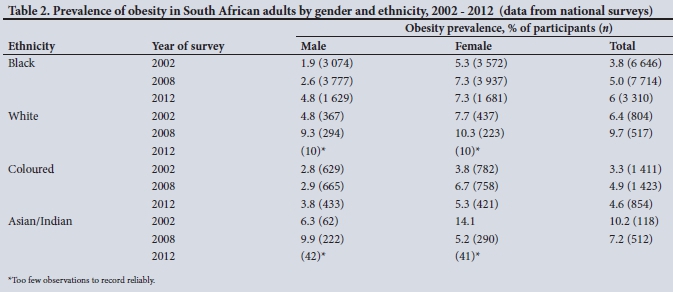
Table 2 presents obesity prevalence stratified by gender and ethnicity. In this context, ethnicity is an underlying indicator of various elements that are known to be associated with obesity risk, i.e. education level, access to healthcare and education, SES, diet, physical activity and genetic predisposition. For blacks, coloureds and whites, females had higher obesity levels than males for all three time points, whereas that trend did not hold for Asians/Indians, among whom males had higher obesity levels than females in 2008. For females, the sharpest increase was observed in coloureds between 2002 and 2008 (2.9%), and the biggest drop was observed in Asians/Indians between 2002 and 2008 (8.9%). Additionally coloured females showed a drop between 2008 and 2012 (-1.4%). For males, whites and Asians/Indians had the highest prevalence of obesity, whereas coloureds and blacks had lower levels across all time points. For all males across all ethnicities, an overall increase in prevalence was observed between 2002 and 2012. The sharpest increase among males between 2002 and 2012 was observed for blacks (2.9%), while between 2002 and 2008, white and Asian/Indian males had an increase of 4.5% and 3.6%, respectively.
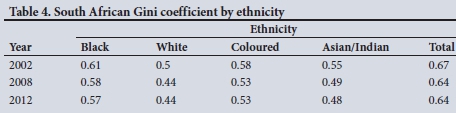
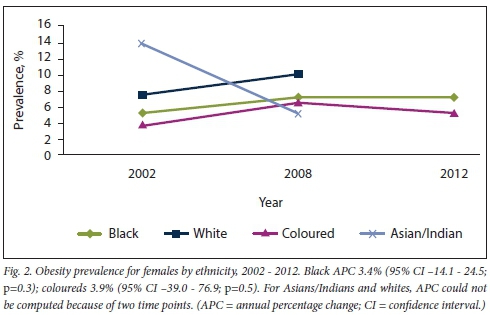
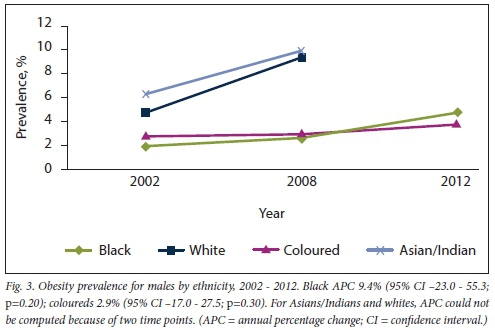
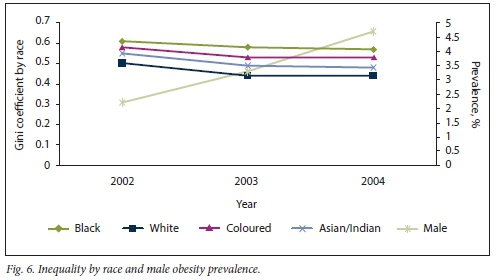
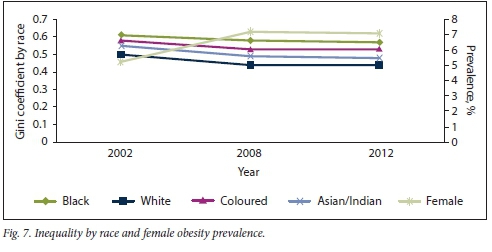
Joinpoint regressions were also computed by sex and ethnicity (Figs 2 and 3). In both sexes, APC could not be computed for the Indian/Asian and white population groups because they had reliable data for only two time points. The black and coloured population groups showed positive APCs for both sexes, with the male black population having the highest (9.4%; 95% CI -23.0 - 55.3; p=0.20). Data for white and Asian/Indian males and females for 2012 were not computed because there were too few observations to record reliably. Table 3 illustrates EGIs, namely per capita GDP and the Gini coefficient, for the three time points for which obesity level data were available. For per capita GDP, an overall increase was observed between 2002 and 2012. A decrease in the Gini coefficient was observed between 2002 and 2008, and it remained the same in 2012. Between 2002 and 2012, the Gini coefficient for all ethnicities declined (Table 4).
Figs 4-7 illustrate the trend line plots of the associations between EGIs and obesity prevalence between 2002 and 2012. Obesity prevalence was positively associated with GDP per capita. GDP per capita growth between 2002 and 2008 was greater than that between 2008 and 2012. For both males and females in 2002, Asians/Indians and whites had the highest obesity prevalence, respectively, compared with coloureds and blacks. However, obesity prevalence declined for Asians/Indians in 2008. For males, obesity prevalence was lowest among blacks between 2002 and 2008 and among coloureds between 2008 and 2012. For females, the plots for coloureds were the lowest, although a fluctuating trend was observed (Figs 4 and 5). The trend associations in the period 2002 - 2012 between the Gini coefficient (for all ethnicities) and obesity prevalence for both genders were similar in that as the Gini coefficient decreased, obesity increased (Figs 6 and 7).
Discussion
Trends for childhood (including adolescents) obesity in SA over time are presented, and the role economic growth played as its distal determinant between 2002 and 2012 is explored. To our knowledge, this is the first study that presents APCs in obesity prevalence over time, through Joinpoint regression. Furthermore, data are presented by gender and ethnicity. The latter additionally represents in part a proxy for SES in the SA context.
The analysis indicated an overall increase in obesity prevalence over time. Females had higher levels across all time points.
Compared with males, female blacks, coloureds and whites had higher obesity levels for all the three time points, whereas the opposite was observed in the Asian/ Indian sample in 2008. For males, white and Asian/Indian samples presented the highest prevalence of obesity, whereas coloureds and blacks presented lower levels across all time points. Black males had the highest APC increase. For females, the sharpest increase was observed in coloureds between 2002 and 2008, and the biggest drop was observed in Asians/Indians between 2002 and 2008. Obesity prevalence was positively and inversely associated with GDP per capita and the Gini coefficient, respectively.
Increases in childhood obesity over time reflected similar trends associated with the economic heath and epidemiological transition reported among adult populations, but limited data are available to enable understanding of its manifestation among children and adolescents, especially in developing countries. The underlying determinants of and causes related to increases in obesity among the youth over time include increases in sedentary behaviour, and changes in dietary and nutrition patterns that have shifted from predominantly prudent to westernised diets,[3,5,16,26] Looking closely at the abovementioned determinants, diet and physical activity are both influenced to a large extent by the economic activity and growth of a country.
Females had higher obesity levels than males for all three time points, and these observations have been reported elsewhere.[10,27-31] Data from developing countries including SA suggest that adolescent girls have very low physical activity.[10,32] Girls mostly seem to be engaged in minor household chores and are less involved than boys in outdoor activities.[33] In the current analysis, Joinpoint regressions indicated a statistically significant higher annual percentage increase among males compared with females, highlighting the possibility that males could be catching up over time.
Obesity prevalence was positively and inversely associated with GDP per capita and the Gini coefficient, respectively. The findings of the present study point to the Lancet framework on global drivers of obesity, which describes economic growth and other relevant policies that influence economic systems as strong probable systemic or distal environmental drivers for obesity, including in children.[6] Although economic stimulation and growth has become the most important priority for SA, there seems to be a point of diminishing returns in relation to obesity among the youth and in terms of related NCDs among adults. Data reporting associations between obesity and economic growth, technological advances, socioeconomic changes and inequalities are available,[13,15,34,35] but these are limited for countries still experiencing the double burden of disease characterised by both undernutrition-related illness and emergence of NCDs. Owing to the observed economic growth in SA, rapid changes in food production, technology, equity and transport systems could be other underlying factors related to the increase in obesity among children observed over time.
As GDP per capita increases, SES, a known determinant of obesity, concurrently improves. Ethnicity reflects an underlying risk factor for obesity, as it can be used as a proxy for SES in the SA context. In the current analysis, although male whites and Asians/Indians had the highest prevalence of obesity across all time points, with coloureds and blacks having lower levels, black males had the highest APC increases over time, while in females, the sharpest increase was observed in coloureds between 2002 and 2008. This observation could be related to shifts and transitions in those of lower SES, who once seemed to be protected from obesity through their prudent diets and physical activity, and now appear to be catching up with those of higher SES. Obesity is known to be related to SES, although this varies by gender, age and country.[36] In general, low SES for those in developed countries and high SES in developing countries increase the risk of obesity, although shifts are being observed in the latter.[37] In a systematic review on ethnic inequalities in obesity among children and adults in the UK, no consensus about obesity prevalence relative to Caucasians among South Asian and black children was reached, but as for adults, blacks had a higher risk of obesity relative to Caucasians.[38] However, another systematic review on developing countries, assessing the association of SES with obesity, reported a positive association in that the affluent were more at risk.[15]
In a similar analysis involving SA adults, obesity patterns similar and comparable to the current analysis using child and adolescent data were observed at gender and ethnicity level.[16] Furthermore, comparable associations between EGIs and obesity were observed, further suggesting a probable underlying contribution of economic growth to obesity across the spectrum. Complementary feeding, and other substitutes to breastfeeding, could partly explain some of the trends, as many women are opting to work, and can access alternatives to breastfeeding as they become more financially independent.
Study strengths and limitations
The strengths of the study include having data over a long time frame, and data on gender and ethnicity being available from national SA surveys. Additionally, Joinpoint regressions were computed to assess whether APC changes were statistically significant or not. Limitations include the ecological nature of the analytical design (group data); causality therefore cannot be inferred, and suggested associations should be interpreted with care. Furthermore, because data were not available at an individual level, other known determinants of obesity such as physical activity could not be adjusted for. Although the BMI has great validity concerns still exist around whether it captures intrinsic body composition in terms of whole-body compartments, especially among children.
Conclusions
An increase in childhood and adolescent obesity was observed over time, while trend associations between obesity and EGIs were seen to exist. Interventions to prevent and reduce childhood obesity include targeting periods in the life cycle, including young women likely to conceive, and women throughout pregnancy and in the post-neonatal and early childhood stages.[39] Without appropriate and targeted interventions, childhood obesity is likely to continue in adolescence and adulthood. Additionally, childhood obesity is associated with a wide range of serious health complications and an increased risk of NCDs, including diabetes and heart disease in later adult life.[40]
Key points
• SA is experiencing a health transition mainly attributable to rapid urbanisation and characterised by the emergence of NCDs including obesity, the HIV/AIDS pandemic, and undernutrition-related infectious diseases.
• Economic growth has been associated with increasing obesity levels, yet no data are available on similar trends for childhood obesity, especially in countries in which both under- and overnutrition exist.
• Trend associations have been reported between SAs economic growth using various indicators (namely per capita GDP, HFCE and Gini coefficients) and adult obesity prevalence over a 20-year time frame.
• Increases in childhood obesity over time are becoming apparent in SA. Patterns are unique by ethnicity, and associations with EGIs exist.
• The burden of obesity in SA, and whether the health system will cope if it continues, are grounds for increasing concern. Innovative preventive interventions specific to this setting are urgently needed.
Declaration. None.
Acknowledgements. We are grateful to the 2002 and 2008 SA Youth Risk Behaviour Surveys, the 2012 South African National Health and Nutrition Examination Survey the World Bank's world development indicators and the IHS Global Insight databases, publicly available data from which were used in this retrospective review and analysis.
Author contributions. PTP and NMP conceptualised and designed the study. PTP collected the data for review. PC and AC conducted data analysis. PTP drafted the first manuscript, which was critically reviewed and approved by NMP, PC and AC.
Funding. None.
Conflicts of interest. None.
References
1. Beaglehole R, Bonita R, Alleyne G, et al. UN High-Level Meeting on Non-Communicable Diseases. Addressing four questions. Lancet 2011;378(9789):449-455. https://doi.org/10.1016/s0140-6736(11)60879-9 [ Links ]
2. Lim SS, Vos T, Flaxman AD, et al. A comparative risk assessment of burden of disease and injury attributable to 67 risk factors and risk factor clusters in 21 regions, 1990 -2010. A systematic analysis for the Global Burden of Disease Study 2010. Lancet 2012;380(9859):2224-2260. https://doi.org/10.1016/S0140-6736(12)61766-8 [ Links ]
3. Popkin BM. The nutrition transition and its health implications in lower-income countries. Public Health Nutr 1998;1(1):5-21. https://doi.org/10.1079/phnl9980004 [ Links ]
4. Vorster HH. The emergence of cardiovascular disease during urbanisation of Africans. Public Health Nutr 2002;5(la):239-243. https://doi.org/10.1079/phn2001299 [ Links ]
5. Pisa PT, Behanan R, Vorster HH, Kruger A. Social drift of cardiovascular disease risk factors in Africans from the North West Province of South Africa. The PURE study. Cardiovasc J Africa 2012;23(7):371-378, e9-88. https://doi.org/10.5830/cvja-2012-018 [ Links ]
6. Swinburn BA, Sacks G, Hall KD, et al. The global obesity pandemic. Shaped by global drivers and local environments. Lancet 2011;378(9793):804-814. https://doi.org/10.1016/S0140-6736(11)60813-1 [ Links ]
7. NCD Risk Factor Collaboration (NCD-Risc). Trends in adult body-mass index in 200 countries from 1975 to 2014. A pooled analysis of 1698 population-based measurement studies with 19.2 million participants. Lancet 2016;387(10026):1377-1396. https://doi.org/10.1016/S0140-6736(16)30054-X [ Links ]
8. World Health Organization. Consideration of the evidence on childhood obesity for the Commission on Ending Childhood Obesity. Report of the Ad hoc Working Group on Science and Evidence for Ending Childhood Obesity. Geneva. WHO, 2016. https://apps.who.int/iris/handle/10665/206549 (accessed 18 January 2020). [ Links ]
9. NCD Risk Factor Collaboration (NCD-Risc). Worldwide trends in body-mass index, underweight, overweight, and obesity from 1975 to 2016. A pooled analysis of 2416 population-based measurement studies in 128.9 million children, adolescents, and adults. Lancet 2017;390(10113):2627-2642. https://doi.org/10.1016/S0140-6736(17)32129-3 [ Links ]
10. Gupta N, Goel K, Shah P, Misra A. Childhood obesity in developing countries. Epidemiology, determinants, and prevention. Endocr Rev 2012;33(1):48-70. https://doi.org/10.1210/er.2010-0028 [ Links ]
11. Riley J. First Canadian EM residents workshop. Can J Emerg Med 2001;3(1):57. https://doi.org/10.1017/S1481803500005194 [ Links ]
12. Offer G, Ranatunga KW. Crossbridge and filament compliance in muscle. Implications for tension generation and lever arm swing J Muscle Res Cell Motil 2010;31(4):245-265. https://doi.org/10.1007/sl0974-010-9232-7 [ Links ]
13. Marmot MG, Stansfeld S, Patel C, et al. Health inequalities among British civil servants. The Whitehall II study Lancet 1991;337(8754):1387-1393. https://doi.org/10.1016/0140-6736(91)93068-k [ Links ]
14. James WP. WHO recognition of the global obesity epidemic. Int J Obes 2005,2008;32(Suppl 7):.S120-S126. https://doi.org/10.1038/ijo.2008.247 [ Links ]
15. Dinsa GD, Goryakin Y, Fumagalli E, Suhrcke M. Obesity and socioeconomic status in developing countries. A systematic review. Obes Rev 2012;13(11):1067-1079. https://doi.org/10.1111/j.l467-789X.2012.01017.x [ Links ]
16. Pisa PT, Pisa NM. Economic growth and obesity in South African adults. An ecological analysis between 1994 and 2014. Eur J Public Health 2017;27(3):404-409. https://doi.org/10.1093/eurpub/ckwll9 [ Links ]
17. Reddy SP, Resnicow K, James S, Kambaran N, Omardien R Mbewu AD. Underweight, overweight and obesity among South African adolescents. Results of the 2002 National Youth Risk Behaviour Survey. Public Health Nutr 2009;12(2):203-207. https://doi.org/10.1017/S1368980008002656 [ Links ]
18. Reddy SP, Resnicow K, James S, et al. Rapid increases in overweight and obesity among South African adolescents. Comparison of data from the South African National Youth Risk Behaviour Survey in 2002 and 2008. Am J Public Health 2012;102(2):262-268. https://doi.org/10.2105/AJPH.2011.300222 [ Links ]
19. Shisana O, Labadarios D, Rehle T, et al. South African National Health and Nutrition Examination Survey (SANHANES-1). Cape Town. Human Sciences Research Council, 2013. [ Links ]
20. Cole TJ, Bellizzi MC, Flegal KM, Dietz WH. Establishing a standard definition for child overweight and obesity worldwide, international survey. BMJ 2000;320(7244):1240-1243. https://doi.org/10.1136/bmj.320.7244.1240 [ Links ]
21. World Bank. World Development Indicators. 2015. https://data.worldbank.org/products/wdi (accessed 15 July 2019). [ Links ]
22. IHS Global Insight. Regional Explorer Database 2015. Updated 10 March 2018. http://www.ihsglobalinsight.co.za/Product/Rex (accessed 15 July 2019). [ Links ]
23. Bravo LE, Garcia LS, Carrascal E, Rubiano J. Burden of breast cancer in Cali, Colombia. 1962 - 2012. Salud Publica Mex 2014;56(5):448-456. https://doi.org/10.21149/spm.v56i5.7370 [ Links ]
24. Shamseddine A, Saleh A, Charafeddine M, et al. Cancer trends in Lebanon. A review of incidence rates for the period of 2003 - 2008 and projections until 2018. Popul Health Metrics 2014;12(1):4. https://doi.org/10.1186/1478-7954-12-4 [ Links ]
25. Statistical Research and Applications Branch, National Cancer Institute. Joinpoint Regression Program. 2016. https://surveillance.cancer.gov/joinpoint/ (accessed 16 July 2019). [ Links ]
26. Popkin BM, Adair LS, Ng SW. Global nutrition transition and the pandemic of obesity in developing countries. Nutr Rev 2012;70(1):3-21. https://doi.org/10.1111/j.l753-4887.2011.00456.x [ Links ]
27. Wasir JS, Misra A. The metabolic syndrome in Asian Indians impact of nutritional and socio-economic transition in India. Metab Syndr Relat Disord 2004;2(1):14-23. https://doi.org/10.1089/met.2004.2.14 [ Links ]
28. Armstrong ME, Lambert MI, Sharwood KA, Lambert EV. Obesity and overweight in South African primary school children - the Health of the Nation Study S Afr Med J 2006;96(5):439-444. [ Links ]
29. Kaur S, Sachdev HP, Dwivedi SN, Lakshmy R, Kapil U. Prevalence of overweight and obesity amongst school children in Delhi, India. Asia Pac J Clin Nutr 2008; 17(4):592-596. http://apjcn.nhri.org.tw/server/APJCN/17/4/592.pdf [ Links ]
30. Ramachandran A, Snehalatha C, Vinitha R, et al. Prevalence of overweight in urban Indian adolescent school children. Diabetes Res Clin Pract 2002;57(3):185-190. https://doi.org/10.1016/s0168-8227(02)00056-6 [ Links ]
31. Neutzling MB, Taddei JA, Rodrigues EM, Sigulem DM. Overweight and obesity in Brazilian adolescents. Int J Obes Relat Metab Disord 2000;24(7):869-874. https://doi.org/10.1038/sj.ijo.0801245 [ Links ]
32. Henry CJ, Lightowler HJ, Al-Hourani HM. Physical activity and levels of inactivity in adolescent females ages 11-16 years in the United Arab Emirates. Am J Hum Biol 2004;16(3):346-353. https://doi.org/10.1002/ajhb.20022 [ Links ]
33. Armstrong N, Balding J, Gentle P, Kirby B. Patterns of physical activity among 11 to 16 year old British children. BMJ 1990;301(6745):203-205. https://doi.org/10.1136/bmj.301.6745.203 [ Links ]
34. Elovainio M, Heponiemi T, Sinervo T, Magnavita N. Organisational justice and health. Review of evidence. G Ital Med Lav 2010;32(3 Suppl B):B5-B9. https://europepmc.org/article/med/21299075 (accessed 10 February 2021). [ Links ]
35. Lakdawalia D, Philipson T. The growth of obesity and technological change. Econ Hum BioJ 2009;7(3):283-293. https://doi.org/10.1016/j.ehb.2009.08.001 [ Links ]
36. Wang Y, Lim H. The global childhood obesity epidemic and the association between socio-economic status and childhood obesity. Int Rev Psychiatry 2012;24(3):176-188. https://doi.org/10.3109/09540261.2012.688195 [ Links ]
37. Due P, Damsgaard MT, Rasmussen M, et al. Socioeconomic position, macroeconomic environment and overweight among adolescents in 35 countries. Int J Obes 2009;33:1084-1093. https://doi.org/10.1038/1JO.2009.128 [ Links ]
38. El-Sayed AM, Scarborough P, Galea S. Ethnic inequalities in obesity among children and adults in the UK. A systematic review of the literature. Obes Rev 2011;12(5):e516-e534. https://doi.org/10.1111/j.l467-789x.2010.00829.x [ Links ]
39. Gillman MW, Ludwig DS. How early should obesity prevention start? N Engl J Med 2013;369(23):2173-2175. https://doi.org/10.1056/nejmpl310577 [ Links ]
40. Biro FM, Wien M. Childhood obesity and adult morbidities. Am J Clin Nutr 2010;91(5):1499s-1505s. https://doi.org/10.3945/ajcn.2010.28701B [ Links ]
 Correspondence:
P T Pisa
pppedropissa@gmail.com
Accepted 16 July 2020

