


Services on Demand
Article
 English (pdf)
 Article in xml format
 Article references
Indicators

Related links
-
 Cited by Google
 -
 Similars in Google
Share

 Permalink
SAMJ: South African Medical Journal
On-line version ISSN 2078-5135
Print version ISSN 0256-9574
SAMJ, S. Afr. med. j. vol.110 n.11 Pretoria Nov. 2020
http://dx.doi.org/10.7196/samj.2020.v110i11.14828
RESEARCH
Let's get physical: A prospective pedometer study of doctors working in a South African emergency department
C B BeringerI; M WellsII; L N GoldsteinIII
IMB BCh, MMed (Emergency Medicine), FCEM (SA); Division of Emergency Medicine, School of Clinical Medicine, Faculty of Health Sciences, University of the Witwatersrand, Johannesburg, South Africa
IIMB BCh, PhD, FCEM (SA), Dip PEC (SA): Division of Emergency Medicine, School of Clinical Medicine, Faculty of Health Sciences, University of the Witwatersrand, Johannesburg, South Africa
IIIMB BCh, MMed (Emergency Medicine), FCEM (SA), Cert Crit Care (SA); Division of Emergency Medicine, School of Clinical Medicine, Faculty of Health Sciences, University of the Witwatersrand, Johannesburg, South Africa
ABSTRACT
BACKGROUND. The positive impact of physical activity and exercise on health is well known. Individuals who walk at least 10 000 steps per day are likely to meet recommended physical activity guidelines. Very little is known about the physical activity levels of doctors at work, in particular those working in emergency departments (EDs).
OBJECTIVES. To determine how many steps per shift were taken by doctors in a South African (SA) ED. Secondary objectives were to assess what factors influenced the number of steps taken.
METHODS. This was a prospective observational cohort study in a tertiary academic teaching hospital ED in Johannesburg over a 1 -month period. Doctors wore pedometers during their day shifts in the ED and the number of steps taken during their shifts was measured, as well as the number and triage category of patients seen and whether cardiopulmonary resuscitation (CPR) was performed.
RESULTS. The median (interquartile range) number of steps taken per shift was 6 328 (4 646 - 8 409). The number of steps taken exceeded the 10 000-step target in only 11.7% of shifts. The overall mean (standard deviation (SD)) number of steps per hour was 744 (490). Factors that significantly increased the number of steps taken included shift duration, number of patients seen who were triaged yellow, and performance of CPR in a shift. Each additional hour of shift led to a mean (SD) increase of 575 (115) steps. Each additional yellow patient seen led to a mean (SD) increase of 118 (108) steps. The mean (SD) number of steps for a shift with CPR was significantly higher (8 309 (850) steps) than for a shift without CPR (6 496 (384) steps).
CONCLUSIONS. Doctors working in an SA ED are not achieving the daily recommended number of steps while at work. The increased risk of ill health and burnout in an already high-risk specialty heightens the importance of exercise and physical activity that needs to be achieved outside the workplace.
Physical inactivity has been referred to as a pandemic and is the fourth leading contributing cause of mortality worldwide.[1] The positive impact of physical activity on health is well known, and lack thereof is known to increase the risk of several non-communicable diseases such as hypertension, coronary artery disease and type 2 diabetes.[1,2] This increased risk has local significance, as South Africans have been found to be among the least active people on the African continent.[3]
South Africans' physical inactivity unfortunately extends to healthcare professionals. Kunene and Taukobong[4] evaluated the level of physical activity of a mixture of healthcare professionals at Estcourt Hospital, KwaZulu-Natal Province, South Africa (SA). Despite potentially having more insight into the risks of physical inactivity than patients, 69% of these healthcare professionals were found to have moderate to low physical activity levels.[4] This finding is echoed in the limited international research that has been published on the physical activity of doctors specifically[5-7]
The recommendation to walk at least 10 000 steps per day is seen as an appropriate activity target for healthy adults, and achieving this goal is a predictor of good health.[8] However, to date, none of the studies assessing doctors' physical activity levels at work have shown that they achieve this suggested target.[5-7,9-16] The emergency department (ED) is a fast-paced and busy working environment, and emergency medicine is regarded as one of the most stressful specialties in medicine.[17] It was therefore surprising that this shortfall in achieving 10 000 steps also applied to ED doctors.[9,10]
Objectives
To determine whether failure to achieve the above physical activity target also holds true in the SA context. We hypothesised that ED doctors would walk well over the 10 000-step mark because of our busy, overburdened and understaffed departments.[18] Our primary objective was to determine how many steps per shift were taken by doctors in an SA ED. The secondary objectives were to assess what factors influenced the number of steps taken.
Methods
Study design and setting
We undertook a prospective observational cohort study over a 1-month period at a tertiary academic teaching hospital in Johannesburg. The ED sees -65 000 patients per annum and has 2 500 m2 of floor space. It includes a 7-bed resuscitation area, a 6-bed acute observation area, an 8-bed 'surgical' area and an 8-bed 'medical' area, as well as triage, orthopaedic, psychiatric and radiology sections.
Ethics approval was obtained from the Human Research Ethics Committee of the University of the Witwatersrand (ref. no. M150405).
Participants
Medical officers (MOs) and emergency medicine registrars working various day shifts in the ED made up the study population. Written informed consent was obtained from each participant prior to enrolment in the study.
Measuring instrument
All doctors included in the study used a standardised pretested commercially available pedometer (Sportline Pedometer 360; EB Brands, USA). The Sportline series has previously been validated.[19] The pedometers were labelled 1 to 20 and distributed randomly to individual doctors each day. Randomisation was performed using a random number generator table from Excel 2019 (Microsoft Corp., USA). The random assignment of pedometers to study participants was done to guarantee equal distribution for the possible variability among the pedometers. Each pedometer's screen was concealed to ensure that the study participants remained blinded to their number of steps taken. A clear and concise instruction guide on the correct use of the pedometer was provided and explained to each study participant to ensure accuracy of data collection.
Activities other than walking are known to contribute to step counting by the pedometer device. The most notable of the non-walking activities that would apply to doctors working in the ED are chest compressions during the performance of cardiopulmonary resuscitation (CPR). Although no literature could be found to confirm or refute this, pilot testing of the pedometers during the performance of chest compressions confirmed that the device recorded the activity as if it was steps that had been taken, i.e. 'pseudo-steps'. A daily log sheet was completed over the study period, which included the shift time and duration in hours, as well as the number of steps taken at the end of each shift. The number of patients seen by each doctor per shift was documented on the daily log sheet, including the triage category of each patient seen (green, yellow, orange and red) according to the South African Triage Scale.[20]
Statistical analysis
Categorical variables were summarised by frequency as percentages. Continuous variables were summarised by means and standard deviations (SDs) or medians and interquartile ranges (IQRs). The number of shifts for which the number of steps met the 10 000-step target was determined. A mixed model was used to determine the relationship between the number of steps per shift, the number of patients in each triage category seen by the participant, the total number of patients seen by the participant, the total number of patients in the ED on the date of the shift, and whether or not CPR had been performed on that shift. A log transformation of the number of steps was used where necessary to meet the assumptions of the analysis. For the participants with five or more shifts, the association between the median number of steps per shift and age group, sex and doctor qualification level was determined by the independent-samples f-test for age and sex, and by one-way analysis of variance for doctor qualification level. Data analysis was carried out using SAS version 9.4 for Windows (SAS Institute, USA). The 5% significance level was used throughout.
Results
A total of 32 doctors participated in the study, with an equal number of males and females. Eighty-four percent of the participants were MOs and the remainder were registrars. The mean age of the participants was 30.4 (range 26 - 45) years.
A total of 317 shifts were included in the study, with each of the 32 participants contributing between 1 and 20 shifts over the 1-month data collection period. The data from two shifts were excluded owing to pedometer malfunction.
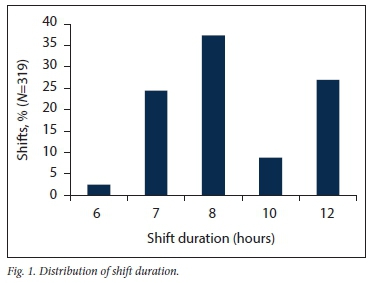
The distribution of day-shift duration is shown in Fig. 1.
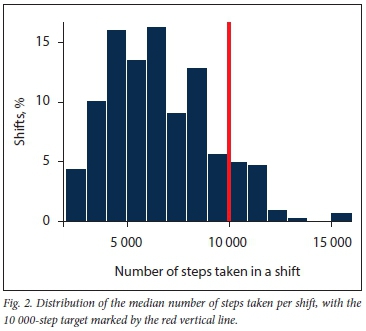
The median (IQR) number of steps taken per shift was 6 328 (4 646 - 8 409). The distribution is shown in Fig. 2, with the 10 000-step target marked by the red vertical line. In only 11.7% (37/317) of shifts did the number of steps taken exceed the target of 10 000.
The overall mean (SD) number of steps per hour was 744 (490).
There was no significant association between the median number of steps and sex (p=0.23), age (p=0.49) or doctor level of experience (p=0.11).
Each additional hour of shift led to a mean (SD) increase of 575 (115) steps. A significant relationship was found between the number of steps per shift and the number of patients seen by the participant, controlling for shift duration (p<0.001). Each additional patient seen per doctor led to a small mean (SD) increase of 155 (89) steps.
A further significant relationship was demonstrated between the number of steps per shift and the number of patients in the ED on the date of the shift, controlling for shift duration (p=0.029). Each additional patient in the ED overall led to a mean (SD) increase of 13 (12) steps.
Regarding the triage category of patients seen, no significant relationship was shown between the number of steps per shift and the number of green, orange or red patients seen by the participant, controlling for all variables (p=0.33, p=0.055 and p=0.26, respectively). There was, however, a significant relationship between the number of steps per shift and the number of yellow patients seen by the participant (p=0.033). Each additional yellow patient seen led to a mean (SD) increase of 118 (108) steps.
CPR was performed in 8.5% of the shifts, with a significant relationship demonstrated between the number of steps per shift and CPR (p<0.001). The mean (SD) number of steps for a shift with CPR was significantly higher (8 309 (850)) than for shifts without CPR (6 496 (384)).
Discussion
Physical activity is of paramount importance in maintaining good health, and achieving the recommendation to walk at least 10 000 steps per day is a good predictor of health.[8] However, despite the anecdotal perceived busyness of an SA ED, it appears that our doctors are not achieving the required number of steps during a day shift in the ED. This result is in line with the findings of similar studies done elsewhere, worldwide, where doctors and other healthcare professionals were noted to be relatively inactive at work in a variety of disciplines. [4-7,9-16]
All the studies assessing doctors' physical activity levels while at work revealed that doctors fall into the so-called 'low active' category as classified by Tudor-Locke and Bassett,[8] i.e. daily activity ranging between 5 000 and 7 499 steps. In a study by Abd et al.[5] in Georgia, USA, assessing the physical activity of cardiovascular specialists (including cardiothoracic surgeons, cardiologists and cardiac anaesthestists), it was found that on average 6 011 steps were taken in an average 10.65-hour work day (574.7 steps per hour). A Dutch study by Goosen et al.[12]assessed physicians and general surgeons, with similar results. An average of 5 325 steps (548 steps per hour) were taken in a 9.8-hour working day. Although the mean number of steps per shift in the current study was in the same 'low active' category as these other studies, the mean hourly number of steps was higher (744 steps per hour). This difference can be accounted for because of the various lengths of the ED shifts included in the study, ranging from 6 to 12 hours, i.e. more steps were taken in longer shifts, as would be expected.
In this SA study, there was no significant association between the median number of steps and sex, age or doctor level of experience. This is comparable to the findings of Goosen et al.[12]In that Dutch cohort, however, each additional year of age was associated with a trivial decrease of 5 steps per hour. This finding is in contrast to the findings in a Scottish pedometer study.[11] Atkinson et al.[11] found a significant difference in steps taken between doctors of different levels of experience and different specialties (consultants compared with MOs). There was a significant difference between internal medicine consultants and MOs, but not between surgical consultants and MOs.[11] This difference can be explained by the fact that consultants generally fulfil a more supervisory role and can therefore potentially be expected to walk less during their shifts. Only MOs and emergency medicine registrars were included in the present study. As their functionality in the ED is generally equivalent, it was expected that no difference would be found. Emergency medicine specialists were not included because there were not sufficient numbers to form a subgroup.
The two studies assessing ED doctors in the USA demonstrated very similar findings to ours.[9,10] The doctors' median number of steps taken per shift were 7 333 and 4 950, respectively. These findings suggest that EDs are potentially not conducive to achieving the required level of daily physical activity while on shift; however further studies in different EDs are required before definitive conclusions can be drawn.
It should be noted that there are limitations in all the above studies assessing doctors' activity levels based on the number of steps taken. They all had a relatively small sample size, all were done over a short period of time, and all except one study were undertaken at a single centre, and therefore unable to account for differences in hospital layout and ED census.[5,7,10,12] Ours was also a single-centre study enrolling a relatively small number of participants and only evaluating their activity during day shifts in the ED. Furthermore although the pedometer screens were covered, the mere awareness of wearing a pedometer could have influenced the number of steps taken by the doctors (the Hawthorne effect).As noted by Atkinson et al.,[11]even though no doctors declined to participate in the study it is possible that selection bias could have occurred, as healthier, more active individuals would be more likely to agree to participate in such a study.
We originally hypothesised that the recommended number of daily steps would easily be achieved in our SA context. Despite the fact that the study ED is a relatively large unit in terms of actual square meterage, the radiology, laboratory and staff tearoom facilities are all within close proximity. This arrangement, together with online access to laboratory results and radiological images, reduces the necessity to walk. With the advent of an electronic health records system in the future, the number of steps could be expected to decrease even further, as all patient-related orders and medical notes can be captured and executed using a computer at a desk.
Factors that were associated with an increase in steps taken included the triage category of the patients seen and the duration of the shift.
Patient acuity, as demonstrated by the patient's triage category, only had a significant relationship with the number of steps per shift if the patient was triaged yellow. Patients triaged yellow often need special investigations and further medical management to be instituted. Such requirements may necessitate the doctor walking to various locations in the ED in order to execute them, e.g. performance of a blood gas analysis and an intravenous line insertion. This factor could have accounted for the higher number of steps associated with the yellow triage category.
Patients triaged green are typically quicker to assess, with few further investigations required, resulting in no additional steps being taken by the doctor. Critically ill and injured patients fall into the orange and red triage categories. These patients often require immediate management that is performed at or near the bedside. The need to stay at the bedside, together with the doctor probably having to spend more time with the patient, means that fewer steps would be generated when attending to patients in these triage categories.
Performing chest compressions during CPR led to a significant increase in the number of 'pseudo-steps' taken during a shift. Although not involving true steps, performance of CPR is a well-recognised form of physical activity, and furthermore has been linked to fitness level.[21] On average, a total of 690 joules are burnt during 15 minutes of CPR training, which equates to a 30-minute hike or light garden work.[22,23]
Understandably, it was found that the longer the shift duration, the more steps were taken by the doctor. However, even in the longest shift (12 hours), the target of 10 000 steps was infrequently reached This finding raises the question whether those individuals were able to find the time to engage in post-shift exercise in order to meet the daily recommendations for physical activity, after a tiring 12-hour shift.
Lack of physical activity and its detrimental health implications are not the only problems highlighted by our study findings. Working in the ED predisposes to the development of burnout, and physical activity is one suggested intervention to ameliorate the detrimental effects thereof.[24,25] As doctors seldom achieved the daily requirements during working hours, they would have had to have compensated for that deficit after work. Many reasons not to engage in regular exercise are cited by doctors. These include family commitments, lack of time, and avolition.[16] Awareness of this deficit may encourage their further participation in physical activity outside of work.
Conclusions
This study demonstrated that, despite a perception to the contrary emergency medicine doctors in an SA ED generally do not achieve more than a low active' level of physical activity during working hours. The factors that resulted in higher levels of activity were longer shifts, more patients in the ED, and the act of performing CPR.
The increased risk of ill health and burnout in an already high-risk specialty heightens the importance of exercise and physical activity that needs to be achieved outside of the workplace.
Declaration. The research for this study was done in partial fulfilment of the requirements for CBB's MMed (Emergency Medicine) degree at the University of the Witwatersrand.
Acknowledgements. We thank all the study participants and the staff of the Helen Joseph Hospital ED for making this research possible.
Author contributions. LNG and CBB conceived and designed the study. CBB collected the data, conducted the analysis and drafted the original manuscript. LNG and MW contributed to the interpretation of the data and composition of the final manuscript. All authors reviewed and approved the final version of the manuscript.
Funding. None.
Conflicts of interest. None.
References
1. Kohl HW 3rd, Craig CL, Lambert EV, et ai. The pandemic of physical inactivity. Global action foi public health. Lancet 2012;380(9838):294-305. https://doi.org/10.1016/s0140-6736(12)60898-8 [ Links ]
2. Sparling PB, Owen N, Lambert EV, Haskell WL. Promoting physical activity. The new imperative for public health. Health Educ Res 2000;15(3):367-376. https://doi.org/10.1093/her/15.3.367 [ Links ]
3. Guthold R, Ono T, Strong KL, Chatterji S, Morabia A. Worldwide variability in physical inactivity. A 51-country survey. Am JPrev Med 2008;34(6):486-494. https://doi.org/10.1016/j.amepre.2008.02.013 [ Links ]
4. Kunene SH, Taukobong NP. Level of physical activity of health professionals in a district hospital in KwaZuiu-Natai, South Africa. S Afr J Physiother 2015;71(1):234. https://doi.org/10.4102/sajp.v71il.234 [ Links ]
5. Abd TT, Kobylivker A, Perry A, Miller J III, Sperling L. Work related physical activity among cardiovascular specialists. Clin Cardiol 2012;35(2):78-82. https://doi.org/10.1002/clc.21954 [ Links ]
6. Al Reshidi FS. Level of physical activity of physicians among residency training program at Prince Sultan Military Medical City, Riyadh, KSA 2014. Int J Health Sci (Qassim). 2016;10(1):39-47. http://doi.org/10.12816/0031215 [ Links ]
7. Patra L, Mini GK, Mathews E, Thankappen KR. Doctors1 self-reported physical activity, their counselling practices and their correlates in urban Trivandrum, South India. Should a full-service doctor be a physically active doctor? Br J Sports Med 2015;49:413-416. https://doi.org/10.1136/bjsports-2012-091995 [ Links ]
8. Tudor-Locke C, Bassett DR jr. How many steps/day are enough? Preliminary pedometer indices for public health. Sports Med 2004;34(1):1-8. https://doi.org/10.2165/00007256-200434010-00001 [ Links ]
9. Josephson EB, Caputo ND, Pedraza S, et al. A sedentary job? The physical activity of emergency medicine residents. J Emerg Med 2013;44(1):204-208. https://doi.org/10.1016/j.jemermed.2012.02.039 [ Links ]
10. Peters G A, Wong ML, Sanchez LD. Pedometer-measured physical activity among emergency physicians during shifts. Am J Emerg Med 2020;38(1):118-121. https://doi.org/10.1016/j.ajem.2019.07.019 [ Links ]
11. Atkinson J, Goody RB, Walker CA. Walking at work. A pedometer study assessing the activity levels of doctors. Scott Med J 2005;50(2):73-75. https://doi.org/10.1177/003693300505000210 [ Links ]
12. Goosen JH, Ettema HB, Kollen BJ, Verheyen CC. How many steps does a doctor take in hospital? Nc difference between internists and general surgeons, but a relationship with age and BMI. Ned Tijdschi Geneeskd 2008;152(4):203-206. [ Links ]
13. Murphy IG, Murphy CG, Heffernan EJ. A comparative analysis of the occupational energy expenditure of radiologists versus clinicians. Ir J Med Sci 2015;184(4):889-892. https://doi.org/10.1007/sll845-014-1215-z [ Links ]
14. Rye PL, Reeson ME, Pekrul CM, et al. Comparing health behaviours of internal medicine residents and medical students. An observational study. Clin Invest Med 2012;35(1):40-44. https://doi.org/10.25011/cim.v35i1.16105 [ Links ]
15. Parshuram CS, Dhanani S, Kirsh JA, Cox PN. Fellowship training, workload, fatigue and physical stress. A prospective observational study. Can Med Assoc J 2004;170(6):965-970. https://doi.org/10.1503/cmaj.1030442 [ Links ]
16. Kovacheva VP, Tsen LC. Predictors of achieving recommended daily physical activity among anesthesiologists at a large tertiary care academic center. J Clin Med Res 2018;10(1):50-55. https://doi.org/10.14740/jocmr3208w [ Links ]
17. De Haan S, Lamprecht H, Howlett MK, et al. A comparison of work stressors in higher and lower resourced emergency medicine health settings. Can J Emerg Med 2018;20(5):713-720. https://doi.org/10.1017/cem.2018.14 [ Links ]
18. Fauli N. Cutting the fat off state hospitals. Mail & Guardian, 24 September 2011. http://mg.co.2a/article/2011-09-24-cutting-fat-off-state-hospitals (accessed 18 April 2020). [ Links ]
19. Schneider PL, Crouter S, Bassett DR. Pedometer measures of free-living physical activity. Comparison of 13 models.Med Sci Sports Exerc 2004;36(2):331-335. https://doi.org/10.1249/01.mss.0000113486.60548.e9 [ Links ]
20. Emergency Medicine Society of South Africa. South African Triage Scale. Cape Town. EMSSA, 2012. https://emssa.org.za/special-interest-groups/the-south-african-triage-scale-sats/ (accessed 18 April 2020). [ Links ]
21. Ock SM, Kim YM, Chung JH, Kim SH. Influence of physical fitness on the performance of 5-minute continuous chest compression. Eur J Emerg Med 2011;18(5):251-256. https://doi.org/10.1097/MEJ.0b013e328345340f [ Links ]
22. Zarrilli Z. CPR research statistics. Surefire CPR, 12 July 2013. https://www.surenrecpr.com/blog/cpr-research-statistic.facts (accessed 18 April 2020). [ Links ]
23. Centers for Disease Control and Prevention. Physical activity for a healthy weight. CDC, 2015. https://www.cdc.gov/h eaithyweight/physicai_activity/#modalIdString_CDCTable_0 (accessed 18 April 2020). [ Links ]
24. Bretland RJ, Thorsteinsson EB. Reducing workplace burnout. The relative benefits of cardiovascular and resistance exercise. Peer J 2015;3:e891. https://doi.org/10.7717/peerj.891 [ Links ]
25. Johnston A, Abraham L, Greenslade J, et al Review article. Staff perception of the emergency department working environment. Integrative review of the lite rature. Emerg Med Austraias 2016;28(1):7-26. https://doi.org/10.1111/1742-6723.12522 [ Links ]
 Correspondence:
L N Goldstein
drg666@gmail.com
Accepted 3 June 2020

