


Serviços Personalizados
Artigo
 Inglês (pdf)
 Artigo em XML
 Referências do artigo
Indicadores

Links relacionados
-
 Citado por Google
 -
 Similares em Google
Compartilhar

 Permalink
SAMJ: South African Medical Journal
versão On-line ISSN 2078-5135
versão impressa ISSN 0256-9574
SAMJ, S. Afr. med. j. vol.110 no.6 Pretoria Jun. 2020
http://dx.doi.org/10.7196/SAMJ.2020.v110i6.14352
RESEARCH
Documented higher burden of advanced and very advanced HIV disease among patients, especially men, accessing healthcare in a rapidly growing economic and industrial hub in South Africa: A call to action
D K GlencrossI; N CassimII; L M CoetzeeIII
IMB BCh, MMed; National Health Laboratory Service, Johannesburg, South Africa; and Department of Molecular Medicine and Haematology, Faculty of Health Sciences, University of the Witwatersrand, Johannesburg, South Africa
IIMPH; National Health Laboratory Service, Johannesburg, South Africa; and Department of Molecular Medicine and Haematology, Faculty of Health Sciences, University of the Witwatersrand, Johannesburg, South Africa
IIIPhD; National Health Laboratory Service, Johannesburg, South Africa; and Department of Molecular Medicine and Haematology, Faculty of Health Sciences, University of the Witwatersrand, Johannesburg, South Africa
ABSTRACT
BACKGROUND. Lephalale Municipality in Limpopo Province, South Africa, has seen significant economic and industrial development owing to expansion of the coal mining and power generation sectors. This development has coincided with substantial population growth of 65% between 2001 and 2016, attributable to largely (migrant) males living in the area who, overall, outnumbered females by~121:100.The local HIV prevalence is reported to be higher than national rates.
OBJECTIVES. Anonymised National Health Laboratory Service CD4+ data were used to document increasing laboratory services workload and to establish the burden of advanced (CD4+ count <200 cells/μL) and very advanced (<100 cells/μL) HIV disease among adult patients accessing public healthcare in Lephalale between 2006 and 2015.
METHODS. A cross-sectional design was used to analyse CD4+ laboratory data. CD4+ outcomes were categorised by volumes of tests, year, health facility type, age categories (15 - 19, 20 - 24, 25 - 29, 30 - 34, 35 - 39, 40 - 44, 45 - 49 and >49 years), CD4+ test range (<50, 51 - 100, 101 - 200, 201 - 350, 351 - 500 and >501 cells/uL) and gender. Median CD4+ counts were calculated.
RESULTS. Extracted Lephalale data comprised 57 490 CD4+ results, with a mean patient age of 34 years. Considerably fewer male than female patients had CD4+ counts reported (male/female ratio 0.45:1). CD4+ test volumes showed a five-fold escalation over the study period, increasing from 1 458 tests in 2006 to 8 239 in 2015. A considerable burden of advanced and very advanced HIV disease (exceeding 50% of all cases) was noted in 2006/2007; by 2015 the proportion had fallen, but was still high at 27%. The overall median CD4+ count in 2006 (192 cells/μL) confirmed a high burden of advanced disease, with modest improvement to 289 cells/μL by 2015. Between 2006 and 2015, the median CD4+ count for females increased from 204 to 405 cells/uL, while that for males increased from 126 to 285 cells/uL. Age analysis further revealed that men aged <20 years or >25 years, and specifically those aged 30 - 45 years, had up to 44% more advanced HIV disease.
CONCLUSIONS. Lower median CD4+ counts and a dramatic increase in volumes of CD4+ tests performed from 2007 onwards revealed a high burden of advanced and very advanced HIV disease in patients accessing care in Lephalale. Viewed together with Statistics South Africa census documentation of a disproportionately high number of males compared with females living in the area, these figures suggest that improved systems are urgently needed to encourage and accommodate access to HIV care for male (migrant worker) patients living and working in emerging industrial centres.
Lephalale Municipality, located in the north-west of South Africa (SA) in Waterberg District in Limpopo Province,[1] has >40% of the national coal reserves.[2] The area has been identified as a petrochemical cluster in the Limpopo Employment, Growth and Development Plan, with the municipality attaining the status of an SA national development node in 2012.[2,3] Lephalale itself comprises three major extensions,[1] Lephalale, Onverwacht and Marapong, and together these areas constitute 18.8% of the Waterberg District population (745 748 in 2016).[4] Since 2009, as a result of the wide expansion of coal mining and electricity sectors in the area (e.g. Madupi power station),[5] there has been significant economic as well as notable population growth,[2,4,6-11] the latter largely due to influx of migrant workers, mostly men, seeking employment opportunities.[4,12] During the 10-year period up to 2011, a 35.8% increase in the Lephalale population had been noted (from 85 272 in 2001 to 115 767 in 2011).[12] An additional 21.1% population growth was documented by 2016 (140 240).[13] This rapid growth is in stark contrast to more modest population growth of just 9.8% in Waterberg District itself between 2011[10] and 2016,[4,13] and in further contrast to the smaller 7.5% population increase noted nationally during the same period.[4,10] Lephalale is therefore among the fastest-growing economic and industrial centres in the country, with the potential to become the future hub of power generation in SA.[3] The area is likely to continue to attract an increasing number of migrant workers.
In 2002 in SA, before commencement of the national treatment programme in 2004, 6.46 million people were projected to be HIV-positive;[14] this estimate had risen to 7.9 million by 2016.[15] In 2006, the national HIV prevalence was 13.3%,[16] with only a modest decrease in prevalence to 12.7% by 2016, 10 years later.[17] In Lephalale Municipality, the area of interest of this study as a rapidly growing industrial hub, the prevalence of HIV in 2010 was reported to be considerably higher than the national prevalence, at 30.4%.[6,18] This figure was almost three times the national HIV prevalence rate of 10.5%[19] reported in the same year, and nearly double the estimated national 17% prevalence reported for adults aged 15 - 49 years.[19] During the same period, HIV prevalence among antenatal women in Waterberg District, of which Lephalale Municipality is part was slightly lower but still high, reported at 28.1% in 2009,[18] and falling very slightly to 27.3% by 2013 and to 25.8% by 2015.[18] In the mother province (Limpopo), HIV prevalence among antenatal women was also lower than that in the Lephalale area, and reported as 21.4%, 20.3% and 21.7% for the years 2009, 2013 and 2015, respectively. [17,18,20]
The National Health Laboratory Service (NHLS) provides all clinical pathology laboratory services to hospitals, community clinics and primary healthcare (PHC) centres across the country for the National Department of Health (NDoH). CD4+ and other laboratory reporting, collated through the collection and testing of samples in this service, provides an invaluable epidemiological and health database resource to enable insights into healthcare services and disease burden.[21-27] Previous studies utilising NHLS laboratory service data have reported a high burden of both advanced (CD4+ count <200 cells/μL) and very advanced (<100 cells/μL) HIV disease among South Africans.[21,25,28] Review of laboratory-based data has further revealed that Waterberg District, in which the Lephalale economic hub is situated, had one of the highest reported burdens of advanced HIV disease in SA,[25] with >16% of all patients accessing HIV care reported to have very advanced HIV disease (CD4+ count <100 cells/μL) during 2010.[25] Evidence of an increasing number of patients accessing care in the area and an increasing service burden was also seen during NHLS National Priority Programme laboratory service review during the same period.[23,27]
Objectives
To investigate the increasing health laboratory service requirements and document the burden of advanced and very advanced HIV disease among male and female patients who accessed healthcare in Lephalale Municipality between 2006 and 2015. A study in this specific municipality is of importance, as Lephalale is one of the areas in SA where marked industrial and economic development is occurring. Consequent marked local population growth is well documented as migrant and/or emigrant workers (largely males) move into the area to take advantage of employment opportunities. Acknowledging that there are many other emerging economic and industrial hubs across the country, and that the SA government has actively encouraged such growth to reduce the proportion of unemployed South Africans,[29] the question was therefore asked: how does industrial expansion and consequent population growth in regional expanding hubs contribute to the HIV disease burden? This question is especially relevant when the population growth can be attributed to mostly migrant (and largely male) workers, and because it is widely known in SA that HIV-positive men are more likely to present late, and with more advanced HIV disease, than their female counterparts.[21,30-32]
Methods
A cross-sectional study design was used. Anonymised CD4+ data were extracted for patients who accessed care in the health facilities of Lephalale Municipality for the calendar years 2006 - 2015, inclusive. Data fields extracted from the NHLS Corporate Data Warehouse (CDW) included the test episode number, the associated health facility location from where the test originated (logged as a location code and facility description), the testing laboratory location, and anonymised test-linked patient demographics including age and gender. The testing laboratory test-'reviewed' dates (documenting the date on which the CD4+ results were released for clinician inspection) were used to determine inclusion in the data extraction. Data were prepared and analysed using SAS Enterprise Guide 9.4 (SAS Institute, USA) and Excel 2016 (Microsoft, USA). CD4+ tests were categorised by volume of tests, year, gender, and CD4+ test range (<50, 51 - 100, 101 - 200, 201 - 350, 351 - 500 and >500 cells/ μL). Age categories (15 - 19, 20 - 24, 25 - 29, 30 - 34, 35 - 39, 40 - 44, 45 - 49 and >49 years) were added, adopted from the 2015 National Antenatal Sentinel HIV Prevalence Survey[18] Mean ages were reported with a 95% confidence interval (CI).
CD4+ test volumes were further categorised by level of care (i.e. the health facility type from where the sample originated), including PHC facility, mobile services and district hospital. Level of care refers to the various tiers of clinical service within any given patient clinical referral network; clinical services offered in Lephalale included consultation at PHC facilities (as the lowest level of care), with referral, if required, to a health service with increasing tertiary care capability, i.e. PHC facilities and community healthcare centres referred patients to district and regional hospitals for various levels of specialist care.[33] For each health facility where CD4+ counts had been requested, the district health information system (DHIS) latitude, longitude and facility type were added. This linked GPS and laboratory location information was used to establish where, or more precisely at which facility type (PHC, mobile or hospital), the patients had presented for care. It is important to note that patients were not limited by the referral hierarchy but could present directly at hospital level for care. Median CD4+ was calculated and reported by year, by healthcare facility type (denoting the level of care) and by sex. To document the proportions of male and female patients receiving CD4+ counts, the percentage of total tests performed on males v. females was reported across each year of study. Among males and females receiving CD4+ counts, the burden of advanced disease was also assessed by reporting the percentage of severely immunocompromised patients whose CD4+ counts fell within the ranges of <100 cells/μL (very advanced HIV disease) or >100 -<200 cells/μL (advanced HIV disease). Other categories of data, including >201 - 350, >351 - 500 and >501 cells/μL, were also reported. Data from the national and local Lephalale censuses of 2001 and 2011, as well as the community surveys of 2007 and 2016, are reported with permission from Statistics South Africa (Stats SA).[4,911] SA national census and community survey data are reported in the format of x males to 100 females. For the sake of consistency in this study, the data concerning male-to-female proportions reported for this work are reported in this Stats SA format.
Ethics clearance for use of anonymised laboratory data was obtained from the University of the Witwatersrand (ref. nos M1706108 and Ml60978). Specifically, no patient identifiers were used.
Results
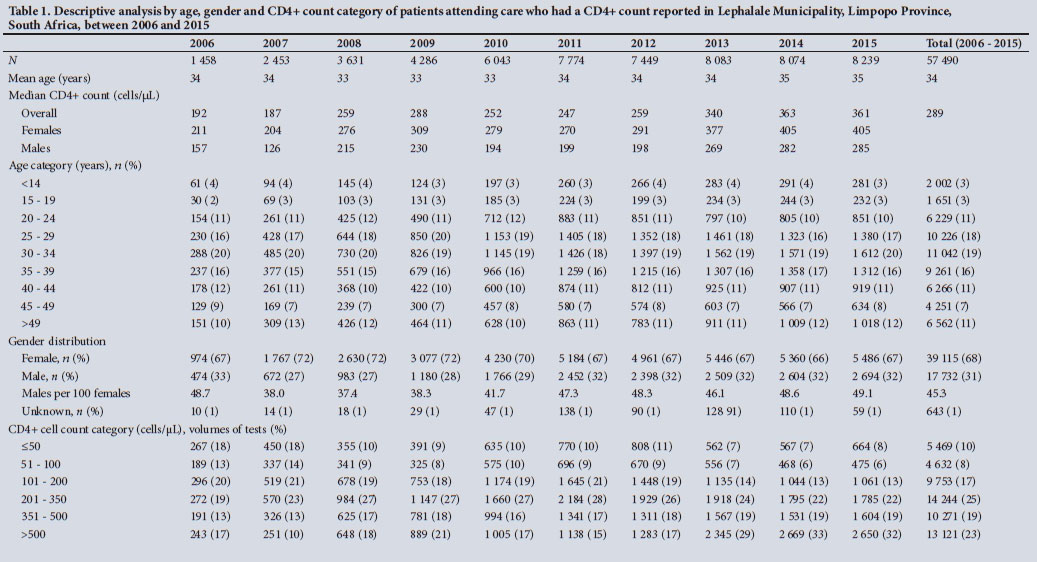
Table 1 outlines the descriptive outcomes over the study period between 2006 and 2015, including volume of tests, age, gender and CD4+ category. In summary, across the study period, the mean age of patients was 34 years, with most samples received for patients in the 25 - 29-, 30 - 34- and 35 - 39-year age categories (18% (n=10 226), 19% (n=l 1 042) and 16% (n=9 261), respectively). Across all facilities, the majority of CD4+ samples were requested for females, which remained unchanged over the duration of the study (67%; an overall male/female ratio of 45 males per 100 females was noted). The median CD4+ count ranged from 192 to 361 cells/μL.
CD4+ test volumes
Fig. 1 reveals the volumes of tests reported by level of care for the years 2006 - 2015. CD4+ volumes increased markedly (over 4-fold from 1 458 to 6 043) during the first 5 years between 2006 and 2010, with an overall ~5-fold increase in the volume of tests reported (or 465% to 8 239 tests) by 2015 (Table 1, Fig. 1). At the beginning of the study period, in 2006, CD4+ test requests came mainly from hospital wards/clinics, increasing from 1 269 in 2006 and reaching 3 354 tests by 2011; a 7.6:1 ratio of hospital v PHC CD4+ test requests was noted in 2006. This proportion gradually decreased over the study period as more patients accessed care at PHC level, decreasing to 0.5:1 by 2015. In PHC facilities, CD4+ test requests increased continually year by year, with just 166 tests reported in 2006, but increasing to 5 431 tests per year by 2015 (a 32-fold increase). Between 2009 and 2010, the highest between-year increase in the number of tests requested for the PHC facilities was noted (equating to -83% and with an absolute increase in number from 1 334 to 2 439 tests). This was followed by a further 46% increase between 2011 and 2012 (from 2 825 to 4 132), thereafter plateauing with smaller year-on-year increases noted of between 3% and 15%. Mobile service CD4+ requests also grew steadily, gradually increasing from Just 23 tests in 2006 and peaking at 1 595 by 2011 (a 69-fold increase), but with a sharp unexplained decrease after 2011, reducing to 80 tests per annum by 2015.
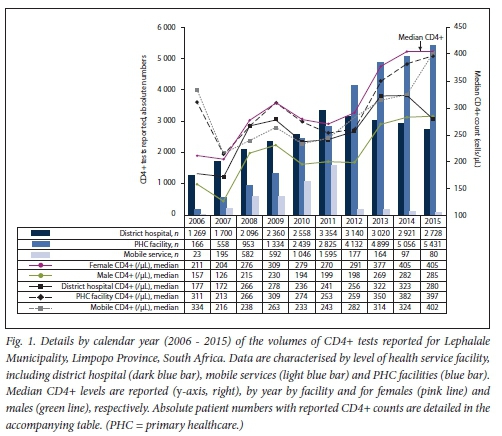
Median CD4+
Although there was a general increase in median CD4+ counts across the study period, from the lowest recorded median of 187 cells/μ1 (2007) and peaking at 361 cells/μL in 2015 (Table 1), reported median annual CD4+ counts reveal a high burden of advanced HIV disease. Median CD4+ fluctuated equally for patients presenting for care, across hospital-based, PHC-based and mobile facilities (Fig. 1). In 2006, median CD4+ counts from mobile and PHC facilities were higher than hospital-based cases (indicating less advanced disease) at >300 cells/μL: in contrast, the median CD4+ count of patients presenting for care at hospital revealed a higher burden of advanced burden of disease, with hospital-based patients having a median CD4+ count of 177 cells/μL (Fig. 1). In 2007, while there was little year-on-year change in median CD4+ counts at district hospital level (172 cells/μL), a sharp increase in the number of tests requested reporting an increasing burden of advanced HIV disease was recorded at both PHC and mobile clinics, with median CD4+ counts falling to 213 and 216 cells/μL, respectively. This trend was confirmed by a continued drop in the overall annual median CD4+ count to 192 cells/μL in 2006, decreasing still further to 187 cells/μL by 2007. During the following 2-year period between 2008 and 2009, a modest rise in the median CD4+ count (to 259 and 258 cells/μL for 2008 and 2009, respectively) was noted. Although the median CD4+ count was higher than that noted in previous years, suggesting some patient enrolment onto antiretroviral therapy (ART), a higher burden of advanced disease re-emerged between 2010 and 2011; median CD4+ counts (irrespective of level of care) declined, with district hospital, PHC and mobile unit median CD4+ counts all dropping (to 236, 274 and 233 cells/μL, respectively). The biggest decline in median CD4+ was noted at PHC level, suggesting that patients with more advanced disease presented for care at clinic facilities during 2010/11. During this same 2010 -2012 period, the highest number of CD4+ requests from district hospitals was also recorded (Fig. 1). The overall burden of advanced disease of patients presenting for care at PHC level had begun to reduce by 2013, with a higher median CD4+ count recorded at 350 cells/μL.
Analysis of disease burden
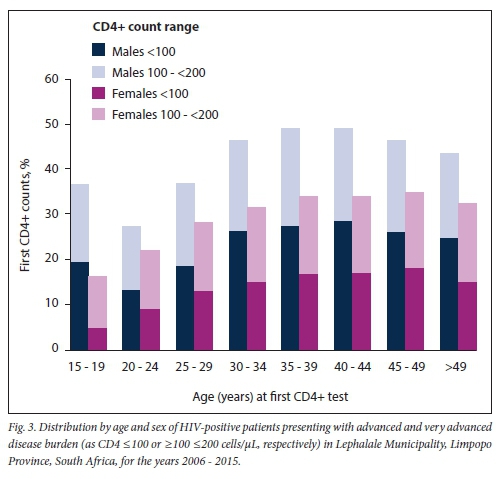
Fig. 2 outlines the burden of disease by CD4+ count category. Disease burden by gender is detailed in Fig. 3. In 2006, the burden of advanced and very advanced disease was very high, CD4+ samples with a reported count of <200 cells/μL exceeding 50%. A further 19% of samples tested had a count >200 but <350 cells/μL. Bearing in mind the prevailing treatment eligibility CD4+ count thresholds of either 200 cells/μL or <350 cells/μL, >50% of patients and up to 70% of patients who presented would have been eligible for treatment at that time. Although this HIV disease burden had reduced to <30% by 2015, the burden of advanced and very advanced disease was still high. Although among female patients the median CD4+ count increased from 211 cells/μL in 2006 to 405 cells/μL by 2014 (Table 1), the annual median CD4+ count for males was considerably lower (126 - 285 cells/μL). The burden of advanced HIV disease, categorised by age, further revealed that men aged <20 years or >25 years, and specifically between 30 and 45 years, had up to 44% more documented advanced HIV disease (Fig. 3).
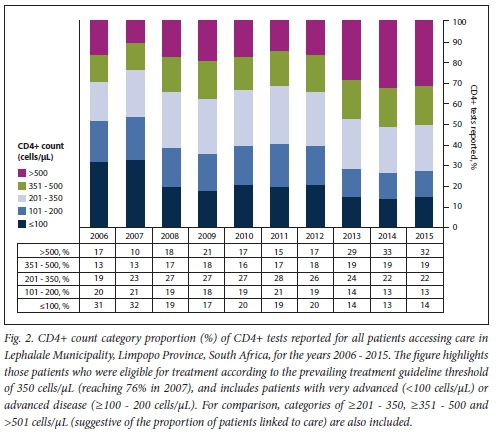
Despite the high burden of advanced HIV disease documented in the Lephalale area, there was evidence of patient enrolment and response to ART, which was reflected in the proportion of patients with CD4+ counts >350 - 500 cells/μL (Table 1). Whereas reported CD4+ samples >350 cells/μL comprised just 30% of all samples tested in 2006, suggesting evidence of recruitment onto antiretroviral treatment, increasing to >35% in 2008, the proportion of patients with a CD4+ count >350 cells/uL had reached 51% by 2015, presumably as more patients were enrolled into care after the 2010/2011 national treatment recruitment drives.[34]
Discussion
Despite access to antiretroviral treatment and increasing enrolment into care, SA has a high documented burden of advanced and very advanced HIV disease.[21,25,30]
Other work has also shown that in SA, compared with females, fewer males access care and more present with an advanced disease burden,[21] and that, among these immunocompromised patients, at least 4-5% have documented cryptococcal antigenaemia on reflexed screening.[28,35] Across the country, some areas have been noted to have an even higher burden of advanced HIV disease;[25] Waterberg District, for example, which includes the area of interest for this study, Lephalale Municipality, was one of the hotspots previously identified as in need of intensified programmatic support. This area was noted to have the second-highest burden of advanced HIV disease in SA in 2010,[21,25] with the proportion of severely immunosuppressed HIV-positive patients presenting for care with a CD4+ count of <100 cells/μL exceeding 16%[25] (during the same period, the national average was -10%,[25,36] with some provinces noted to have much lower proportions of severely immunocompromised patients, e.g. the Western Cape with -7.7 - 7.9%[25]).
Overall, a clear picture of an increasing burden of HIV disease, with insufficient resources to meet the service demands of a growing local population, emerges from this study. Firstly, the data substantiate previous estimates[27] of an increasing number of patients accessing care; a marked and increasing demand for CD4+ testing (465%) was documented over the study period. Despite this finding, no increased service requirements were evident at either the national or the provincial level.[27] Between 2009 and 2010, in the adjacent province, Mpumalanga, the increase in documented workload was just 17.4% (data not shown), while CD4+ test volumes nationally increased by just 17%.[37] Secondly, the percentage of patients with a CD4+ count <200 cells/uL reached 51% in 2006, and 53% in 2007 (Fig. 2). These percentages were much higher than those reported nationally for the same years[21] and confirmed a higher burden of advanced disease among patients presenting for care in the Lephalale area, especially among males (Fig. 3) and specifically in the age categories 15 - 19 and 30 - 34 years. The burden also coincided with an increased number of patients attending health facilities in the area during the 10-year period (Fig. 1) and the launch of the 2010 - 2012 national HIV counselling and testing campaign that aimed to test 20 million people over 20 months.[34]
Numerous annual integrated development plans (IDPs) published by the local Waterberg and Lephalale provincial and municipal government[3,7,8,37] acknowledged the marked growth of the local population and the increasing burden on local health services in the area. These plans indicate that Lephalale's healthcare needs were met by just three hospitals (two state and one private) and six clinics.[2,3] Currently, the state hospital Witpoort serves as a referral health facility for Abbotspoort, Seleka and Shongoane clinics, while Ellisras State Hospital is a referral health facility for Marapong, Steenbokpan and Ellisras town clinics. Despite descriptions of rapid local population growth, very few of these documents[23,6-8,37] address the upgrading and capacitating of both hospital and PHC healthcare services that were required to meet the growing population needs, especially in view of acknowledged HIV prevalence estimates exceeding 30% (2013).[3,8,37] Only one Lephalale clinic, Marapong, noted in the 2013 IDP to have a threefold increase in patient load at that time[3] and again in the 2015/16 IDP,[37] was identified for upgrading; the clinic was finally set up in a donated old private hospital nearby during 2017, after this study concluded.[7,8] Mobile health services were provided to fourth- and fifth-order settlements,[3] >10 km away from any health facility within the municipality, but as suggested by the data presented here, these services were largely terminated from 2012 onwards (Fig. 1). In 2013, a service level agreement between Murray and Roberts and the NDoH provided for some privately managed, supplementary ART clinic access in the vicinity of Ellisras Hospital (personal communications, N de Beer, Murray & Roberts ART clinic implementations, 2013). Unfortunately, determining the number of patients enrolled into care during this period was beyond the scope of this study. Other studies have reported modest uptake of ART in a similar context. In KwaZulu-Natal Province, for example, 39% of patients who initially presented were estimated to be enrolled into care, and only 40% were enrolled into care in a Malawian cohort.[32] However, some controlled (study) cohorts do suggest higher enrolment.[38]
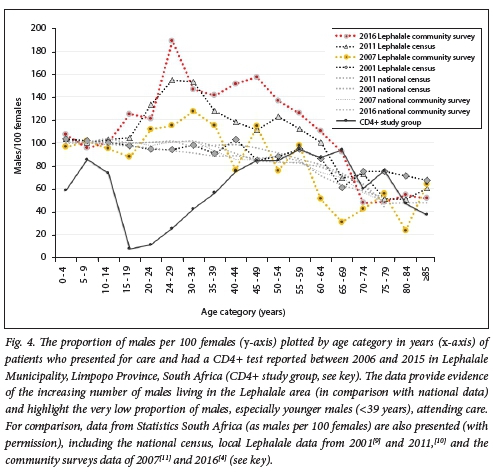
A significant outcome noted in the present study was that women attending care outnumbered men by >2:1. These figures are in stark contrast to the Stats SA census-documented higher number of men living in the Lephalale area (Fig. 4), especially younger men aged 15-39 years. In this age group, the ratio of men to 100 females in census data was noted to be lowest at 37.1 in 2008, and was recorded at its highest, but still reversed, at 49.1 in 2015. The marked discrepancy between numbers of males and females attending clinics was also most evident among the youngest male patients attending care (CD4+ study group, Fig. 4): here, a ratio of 10 - 60 males per 100 females was noted among male patients aged 15-34 years. The ratio of males to females attending care only equalised in patients aged >55.
In the present study, men presenting for care were also more ill, with more advanced and very advanced HIV disease, than their female counterparts (Fig. 3); this was especially the case among men aged >25 years, and these proportions were higher than those reported nationally during the same period.[21] This finding and the predominantly female patient presentation and the more advanced disease burden among men have been widely reported.[21,30,39,40] The Johannesburg-based Themba Lethu Clinical Cohort,[31,39] for example, reported predominantly females attending both pre-ART and ART care, and a higher burden of advanced disease among men presenting for care. Other local studies also report that men initiate ART with more advanced HIV disease (lower CD4+ counts)[31,39-42] and have higher mortality and morbidity, poorer response to treatment and worse outcomes than their female counterparts.[31] A study on the prevalence of late presentation for HIV care among newly diagnosed patients in three high-burden districts across 35 PHC facilities in SA[30] also shows that males, particularly older males, presented late and with more advanced disease: more males than females were classified as extreme late' presentation (45.5% v. 26.7%), and more males presented with clinical manifestations of AIDS (WHO stage IV) and/or a CD4+ count <200 cells/μL.[30]
The predominance of males living in the Lephalale area is especially relevant and warrants consideration. Census and community survey data[4,10] suggest a largely migrant community, with census and other data documenting that men predominate in Lephalale Municipality (Fig. 4); a male/ female ratio as high as 189:100 among adults aged 25 - 29 years was documented in one report.[13] In addition, this report confirms an influx of males seeking employment: the community survey of 2016[4,13] had reported a 21.8% increase in the male population compared with only 13.5% for females that year, with an overall population increase of 18%. This is relatively low compared with the 35% increase in the population reported for 2011.[13] The latter community survey[13] additionally noted that the population growth of the area was substantially higher than the provincial growth rate of just 0.84% per year for the 5 years preceding 2016.
The disparity between the high local HIV prevalence in Lephalale, the low number of men attending HIV care and the high number of males residing in the area draws attention to the underlying reasons why men, despite availability of ART, are less likely than women to present for testing in the first instance,[42] and why they present late for care with advanced disease. The finding also draws attention to the risks and challenges posed when a largely male community migrates into such areas to seek employment. Apart from the obvious reasons, including that the scale-up of ART in SA has focused on women and children, with specific mention in local treatment guidelines[43] as well as high-level political support[44] and specifically directed programmatic funding,[45] the reasons why men do not readily access care are complex and dependent on numerous factors.[42,44,46-57]
Fewer men may test for HIV and initiate treatment, with stigma described as a major limiting factor; a cross-sectional population-based survey in Limpopo reported that males tested for HIV/AIDS less frequently than women, and reported more anticipated stigma.[42] Men have also been reported to view public health facilities as a place for women and antenatal care,[48,51] and in consequence lacked knowledge about ART. It is therefore not surprising that several studies have reported that men would prefer to attend single-sex health facilities which additionally offer extended hours of health services and are in close proximity to their homes or public transport hubs.[41,48,51] Reluctance of males to attend clinic care has further been attributed to 'being made to feel guilt, shame and loss of dignity as a result of the discrimination by healthcare providers and other community',[48-54] especially in the context of engagement in risky sexual behaviour away from home.[55-59] One study also reported male experiences with female nurses who were rude and/or judgemental.[51] Masculine norms embedded in society can also play an important role in acting as barriers to care, including norms that shape men's sexual behaviour[48] and self-reliance behaviour, [42,49,50,54] or societal gender norms that emphasise women's vulnerability and men's lack of vulnerability. Fears that being HIV-positive would threaten men's traditional roles (as father, provider and husband) as well as reduce sexual success with women[42] have also been described.
Further complexity is added when HIV-positive men are migrant workers temporarily living in a place of employment, such as the context of this study - a fast-growing economic hub with rapid population growth that has attracted an increased number of men, especially younger men, seeking employment. Migrant working men have been described as a vulnerable group[55-57] who are marginalised and discriminated against.[57] According to Rai and colleagues,[52,55,56] HIV-positive migrant men often attend public sector HIV services even later than their HIV-positive counterparts who are not migrants, often only after they develop debilitating symptoms. Even if they are enrolled into care, although there may be some response to treatment, recovery among HIV-positive males tends not to be as good as that in their female counterparts,[31] and they fail to achieve the CD4+ levels and immune reconstitution noted in women. These men frequently experience reduced physical strength as a result of their illness,[52] and their situation is made worse by discriminatory employment policies and practices, including informal or casual employment, and poor organisation of migrant workers. Most men in this context also lack financial protection against onset of illness. As with general clinic access, access to care and poor adherence to HIV therapy are also exacerbated by inconvenient clinic opening hours and long waiting times,[47,51,57] with lack of systems for transferring health records to other centres. All these factors result in further hardship and increasing ill health and poverty, the trap that led them to migrate for employment in the first place.[56,57] Alcohol consumption may also play a negative role in adherence to treatment.[58,59]
Rai et al[55]described HIV-positive individuals in a circular migrant labour system as a sub-epidemic and 'bridge' population who are at risk of, and transmit, infection: migrant labourers are infected by a high-prevalence group in the area where they live and work, and transmit disease to individuals back at home who would otherwise have little or no risk of infection. The high burden of advanced and very advanced HIV disease in the context of a largely migrant (male) community noted in the present study supports this view. Identifying HIV-positive individuals who live and work in emerging industrial hubs[52,55,56] as a separate key population to which care should be targeted in local SA HIV treatment programmes may assist in encouraging enrolment onto ART and help to reduce new infections and the burden of advanced and very advanced HIV disease in this group. Additionally, considering amendments to labour laws to properly support migrant workers and oblige employers to look after the health of their employees could further secure the health of this economically active group, save health costs, and save lives of these workers and their families. The introduction of men-only health services,[41] with flexible hours and run by male health workers, situated adjacent to mines and service utilities like Medupi,[5] or run in a similar way by employers (like Murray & Roberts and Eskom), could address barriers to access and improve enrolment into care.[41]
Furthermore, interventions that pay attention to men's health, take cognisance of men's behaviour,[49] challenge masculine norms and promote gender equality[47] and stop victim blaming[60] could also help to address the barriers that men in these contexts face when presenting for HIV testing and care. Such approaches could also optimise HIV and sexually transmitted disease prevention efforts, not to mention addressing other socioeconomic issues, including gender-based violence, that play important roles in presentation for HIV screening. Local programmes such as the Sonke Gender Justice Network for HIV/AIDS Gender Equality and Human Rights 'One Man Can' campaign,[47] without reifying harmful hegemonic aspects of masculinity and norms used in some reported public health messaging (e.g. 'Man Up Monday'[61]), have made progress, focusing on transformative gender roles and encouraging men to test for HIV and attend care. Urgent and clear financial and sociopolitical support for such bold approaches is needed in SA to improve the lives of infected/affected men, but equally to end gender inequality[62] and improve the lives of the women/partners and vulnerable gender minority groups with whom men associate.
Study limitations
This study addressed the burden of advanced HIV in a single municipality. Using the approach described, other similar rapidly growing economic hubs across SA could be identified and studied to inform health policy and assist health authorities in the scale-up of and access to appropriate health services in such areas. The strengthening and adaption of local diagnostic laboratory services could additionally assist in delivering optimised healthcare services by reducing the time from test request to delivery of laboratory reports. This aspect was beyond the scope of this work, but is published elsewhere.[63]
The study did not include patients who presented for care at private or non-governmental organisation (NGO) health facilities (estimated to be -8.5% by Johnson et al.[63]). Although the Medupi workers were included at the launch of the HIV counselling and testing campaign initiative in 2011,[65] these men may or may not have been represented in this public healthcare data cohort (as many workers employed by coal mining and electricity production plants may access healthcare services at their workplace).[64,65]
This work also did not address retention in care. A systematic literature review assessing retention from the time of ART eligibility to initiation in sub-Saharan Africa, reporting retention rates ranging from 39% to 84% in SA, is published elsewhere.[32]
Furthermore, although there is an association of HIV prevalence with very high local population growth and it is likely that this impacted on the burden of patients presenting for care in the clinics, this was not directly proven.
Lastly, the integration of databases of population statistics and HIV prevalence, with linked health and laboratory data, is vitally important for future work to accurately assess the HIV and related disease burden and access to healthcare, not only in economic hubs but throughout SA.
Conclusions and study highlights
While it is widely known in SA that men are more likely than women to present late and with advanced HIV disease, the current study has documented an increased burden of advanced and very advanced HIV disease among economically active, mostly younger and largely migrant and/or emigrant men in the context of a rapidly growing industrial hub in SA. In these areas, as evidenced by data presented here, existing local health facilities may not necessarily match changing population needs or the rate of industrial expansion. There are many similar emerging, rapidly developing economic and industrial hubs around SA, such as eMalahleni (previously known as Witbank) and more recently Saldanha Bay. In these areas, there are likely to be similar population demographics as noted in Lephalale, with a disproportionately high number of males who are also likely to have a relatively high burden of advanced HIV disease. Although our findings may not impact on individual patient clinical decisionmaking, the outcomes reported will nonetheless provide context and a perspective to policymakers at NDoH or government level, and to treating clinicians, about the community (mostly men) who go to work and live in developing industrial hubs around SA and the substantial risks they face, as outlined in the 'Discussion' above. These findings warrant a call to action. Further studies to investigate and identify local barriers to care are urgently needed, with a special focus on working men's health needs, especially in a context where there is a growing community of mobile, migrant workers. Urgent and specific attention needs to be paid to adequately scaling up health services and making health services more amenable to men in the contexts described, further paying attention to masculine norms as confounding, contributing factors.
The methodology used to generate this report is worthy of mention. Routine health data systems are commonly aggregate in nature in SA. e.g. they are often paper based and collated through the D HIS. This study would have been difficult and tedious using such aggregate data sources alone. National health laboratory data, on the other hand, are automatically collected to enable routine pathology testing across the country; related patient health data are passively collected as tests are ordered and reported across the NHLS, provided that a quality national laboratory service is maintained and the collection of data is supported with an appropriate laboratory information management system and proper management and curation of the data in the NHLS CDW. Analysis of data from this resource can facilitate insights into geospatial public health access and disease burden epidemiology as well as assist in identifying areas/programmes that require prioritised focus,[21,23,27,36] but without the need for labour-intensive clinical intervention studies, epidemiological investigation or field assessment. The work presented here was enabled by extraction of population-level CD4+ laboratory data from the NHLS database described, with detailed demographic and CD4+ test data extraction to include >95% of the population attending HIV care in Lephalale Municipality. It is therefore an excellent example of the inherent worth of NHLS data as an invaluable, significant and important national public health repository and resource.
Declaration. None.
Acknowledgements. The authors thank the NHLS CDW and staff at the National Priority Programmes Unit for their assistance. They also thank Prof. Sergio Carmona for advice and critical review of the manuscript.
Author contributions. DKG supervised the study by providing leadership and oversight, and was also the project leader. NC, LMC and DKG designed the study. NC and LMC developed the methodology and conducted the research. NC conducted the data analysis. All authors contributed to the manuscript development. DKG provided technical input and data interpretation and wrote the final manuscript.
Funding. None.
Conflicts of interest. None.
References
1. South African Government Provincial Government 2019. https://www.gov.za/links/provincial-government (accessed 13 March 2019). [ Links ]
2. Lephalale Municipality. Integrated Development Plan 2014 - 2016. 2014. http://www.lephalale.gov.za/docs/SDBIP/Final%20%20IDP%202014%20-%202016.pdf (accessed 21 September 2017). [ Links ]
3. Lephalale Municipality. Final Integrated Development Plan 2013 - 2016. 2013. http://www.lephalale.gov.za/docs/SDBIP/Finai%20IDP%202013-2016.pdf (accessed 19 February 2019). [ Links ]
4. Statistics South Africa. Community Survey 2016. Pretoria. Stats SA, 2018. http://cs2016.statssa.gov.za/wp-content/uploads/2016/07/NT-30-06-2016-RELEASE-for-CS-2016-_Statistical-releas_l-July-2016.pdf(accessed 13 November 2017). [ Links ]
5. ESKOM. Medupi Power Station Project. 2007. http://www.eskom.co.za/Whatweredoing/NewBuild/MedupiPowerStation/Pages/Medupi_Power_Station_Project.aspx (accessed 5 May 2020). [ Links ]
6. Lephalale Local Municipality Draft Integrated Development Plan 2016/2021.2016. http://www.lephalale.gov.za/docs/SDBIP/LEPHALALE%20DRAFT%20IDP%202016-2017.pdf(accessed21 September 2017). [ Links ]
7. Lephalale Local Municipality. Final Integrated Development Plan Lephalale Local Municipality: 2017 - 2018. 2017. http://www.lephalale.gov.za/docs/SDBIP/Finai%20IDP%202017-18.pdf (accessed 19 February 2019). [ Links ]
8. Lephalale Local Municipality. Final Integrated Development Plan Lephalale Local Municipality: 2018/2019. 2018. http://www.lephalale.gov.za/docs/SDBIP/Final%20IDP%202018-19.pdf (accessed 19 February 2019). [ Links ]
9. Statistics South Africa. National Census 2001. Pretoria. Stats SA, 2002. http://www.stats sa.gov.za/census/census_2001/theCount/Count.pdf(accessed 13 March 2019). [ Links ]
10. Statistics South Africa. National Census 2011. Pretoria. Stats SA, 2012. http://www.statssa.gov.za/publications/P03014/P030142011.pdf (accessed 13 March 2019). [ Links ]
11. Statistics South Africa. Community Survey 2007. Pretoria. Stats SA, 2018. http://www.statssa.gov.za/publications/P0301/P0301.pdf (accessed 21 May 2019). [ Links ]
12. Statistics South Africa. Statistics by place. Lephalale. Pretoria. Stats SA, 2011 http://www.statssa.gov.za/?page_id=993&id=lephalaie-municipality (accessed 13 November 2017). [ Links ]
13. Statistics South Africa. Community Survey 2016. Provincial profile Limpopo. Pretoria. Stats SA, 2018. http://cs2016.statssa.gov.za/wp-content/uploads/2018/07/Limpopo.pdf (accessed 13 November 2017). [ Links ]
14. Dorrington RE, Bradshaw D, Budlender D. HIV/AIDS Profile of the Provinces of South Africa -Indicators for 2002. Centre for Actuarial Research, South African Medical Research Council, Burden of Disease Research Unit and Actuarial Society of South Africa, 2002. https://www.commerce.uct.ac.za/Research_Units/CARE/RESEARCH/Papers/Indicators.pdf (accessed 20 February 2019). [ Links ]
15. Human Sciences Research Council The Fifth South African National HIV Prevalence, Incidence; Behaviour and Communication Survey, 2017. HIV Impact Assessment Summary Report. Cape Town. HSRC Press, 2018. http://www.hsrc.ac.za/uploads/pageContent/9234/SABSSMV_Impact_Assessment_Summary_ZA_ADS_cleared_PDFA4.pdf (accessed 20 February 2019). [ Links ]
16. Statistics South Africa. Mid-year population estimates, South Africa, 2006. Pretoria. Stats SA, 2007. http://www.statssa.gov.za/publications/P032/P03022006.pdf (accessed 15 August 2019). [ Links ]
17. Statistics South Africa. Mid-year population estimates, South Africa, 2016. Pretoria. Stats SA, 2017. https://www.statssa.gov.za/publications/P0302/P03022016.pdf (accessed 15 May 2019). [ Links ]
18. National Department of Health, South Africa. The 2013 National Antenatal Sentinel HIV Prevalence Survey, South Africa. Pretoria. NDoH, 2015. http://www.kznhealth.gov.za/data/The-2013-Naüonai-Antental-Sentinel-HIV-Prevalence-Survey-South-Africa.pdf (accessed 20 May 2019). [ Links ]
19. Statistics South Africa. Mid-year population estimates, South Africa, 2010. Pretoria. Stats SA, 2010. https://www.statssa.gov.za/publications/P0302/P03022010.pdf (accessed 20 August 2019). [ Links ]
20. National Department of Health, South Africa. The 2010 National Antenatal Sentinel HIV and Syphilis Prevalence Survey in South Africa. Pretoria. NDoH, 2011. http://www.hst.org.za/pubhcations/NonHST%20Publications/hiv_aids_survey.pdf (accessed 19 February 2019). [ Links ]
21. Carmona S, Bor J, NatteyC, et al. Persistent high burden of advanced HIV disease among patients seeking care in South Africa's national HIV program. Data from a nationwide laboratory cohort. Clin Infect Dii 2018,66(Suppl2).S111-S117.https://doi.org/10.1093/cid/ciy045 [ Links ]
22. Cassini N, Coetzee LM, Schnippel K, Glencross DK. Compliance to HIV treatment monitoring guidelines can reduce laboratory costs. South Afr J HIV Med 2016;17( 1): 1-5. https://doi.org/10.4102/sajhivmed.v17i1.449 [ Links ]
23. Cassim N, Coetzee LM, Stevens WS, Glencross DK. Addressing antiretroviral therapy-related diagnostic coverage gaps across South Africa using a programmatic approach. Afr J Lab Med 2018;7(1):681-692. https://doi.org/10.4102/ajlm.v7i1.681 [ Links ]
24. Cassim N, Smith H, Coetzee LM, Glencross DK. Programmatic implications of implementing the relational algebraic capacitated location (RACL) algorithm outcomes on the allocation of laboratory sites; test volumes, platform distribution and space requirements. Afr J Lab Med 2017;6(1):545-553. https://doi.org/10.4102/ajlm.v6il.545 [ Links ]
25. Coetzee LM, Cassim N, Glencross DK. Analysis of HIV disease burden by calculating the percentages of patients with CD4 counts <100 cells/uL across 52 districts reveals hot spots for intensified commitment to programmatic support. S Afr Med J 2017;107(6):507-513. https://doi.org/10.7196/SAMJ.2017.vl07i6.11311 [ Links ]
26. Coetzee LM, Cassim N, Glencross DK. Using laboratory data to categorise CD4 laboratory turnaround-time performance across a national programme. Afr J Lab Med 2018;7(1):665-672. https://doi.org/10.4102/ajlm.v7il.665 [ Links ]
27. Glencross DK, Coetzee LM, Cassim N. An integrated tiered service delivery model (ITSDM) based on local CD4 testing demands can improve turn-around times and save costs whilst ensuring accessible and scalable CD4 services across a national programme. PLoS ONE 2014;9( 12):e114727. https://doi.org/10.1371/journal.pone.0114727 [ Links ]
28. Coetzee LM, Cassim N, Sriruttan C, Mhlanga M, Govender NP, Glencross DK. Cryptococcal antigen positivity combined with the percentage of HIV-seropositive samples with CD4 counts <100 cells/μl identifies districts in South Africa with advanced burden of disease. PLoS ONE 2018;13(6):e0198993. https://doi.org/10.1371/journal.pone.0198993 [ Links ]
29. South African Government. President Cyril Ramaphosa. Economic stimulus and recovery plan. 21 September 2018. https://www.gov.za/speech es/president-cyril-ramaphosa-economic-stimulus-and-recovery-plan-21-sep-2018-0000 (accessed 15 October 2019). [ Links ]
30. Fomundam HN, Tesfay AR, Mushipe SA, et al. Prevalence andpredictorsoflate presentation for HIV care in South Africa. S Afr Med J 2017;107(12):1058-1064. https://doi.org/10.7196/SAMJ.2017.v107i12.12358 [ Links ]
31. Maskew M, Brennan AT, Westreich D, McNamara L, MacPhaii AP, Fox MP. Gender differences in mortality and CD4 count response among virally suppressed HIV-positive patients. J Womens Health (Larchmt) 2013;22(2):113-120. https://doi.org/10.1089/jwh.2012.3585 [ Links ]
32. Rosen S, Fox MP. Retention in HIV care between testing and treatment in sub-Saharan Africa. A systematic review. PLoS Med 2011;8(7):e1001056. https://doi.org/10.1371/journal.pmed.l001056 [ Links ]
33. Department of Health, KwaZulu-Natal. Referral system. Levels of health care. November 2014. http://www.kznhealth.gov.za/Referral-system.htm (accessed 26 November 2018). [ Links ]
34. Simelela NP, Venter WD. A brief history of South Africa's response to AIDS. S Afr Med J 2014;104(3 Suppl 1):249-251.https://doi.org/10.7196/SAMJ.7700 [ Links ]
35. Govender NP, Glencross DK. National coverage of reflex cryptococcal antigen screening. A milestone achievement in the care of persons with advanced HIV disease. S Afr Med J 2018;108(7):534-535. https://doi.org/10.7196/SAMJ.2018.vl08i7.13094 [ Links ]
36. Cassim N, Coetzee LM, Govender NP, Glencross DK. District and sub-district analysis of cryptococcal antigenaemia prevalence and specimen positivity in KwaZulu-Natal, South Africa. Afr J Lab Med 2018;7(l):757-765. https://doi.org/10.4102/ajlm.v7il.757 [ Links ]
37. Lephalale Local Municipality. Final Integrated Development Plan 2015 - 2016. http://www.lephalale.gov.za/docs/SDBIP/Final%20IDP%202015-2016.pdf (accessed 15 June 2019). [ Links ]
38. Fox MP, Shearer K, Maskew M, Meyer-Rath G, Clouse K, Sanne I. Attrition through multiple stages of pre-treatment and ART HIV care in South Africa. PLoS ONE 2014;9(10):e110252. https://doi.org/10.1371/journal.pone.0110252 [ Links ]
39. Fox MP, Maskew M, MacPhaii AP, et al. Cohort profile. The Themba Lethu Clinical Cohort, Johannesburg, South Africa. Int J Epidemiol 2013;42(2):430-439. https://doi.org/10.1093/ije/dys029 [ Links ]
40. Cornell M, Cox V, Wilkinson L. Public health blindness towards men in HIV programmes in Africa. Trop Med Int Health 2015;20(12):1634-1635. https://doi.org/10.1111/tmi.l2593 [ Links ]
41. Treves-Kagan S, El Ayadi AM, Pettifor A, et al. Gender, HIV testing and stigma. The association of HIV testing behaviors and community-level and individual-level stigma in rural South Africa differ for men and women. AIDS Behav 2017;21(9):2579-2588. https://doi.org/10.1007/s10461-016-1671-8 [ Links ]
42. Sileo KM, Fielding-Miller R, Dworkin SL, Fleming PJ. What role do masculine norms play in men's HIV testing in sub-Saharan Africa? A scoping review. AIDS Behav 2018;22(8):2468-2479. https://doi.org/10.1007/sl0461-018-2160-z [ Links ]
43. National Department of Health, South Africa. National Consolidated Guidelines for the Prevention of Mother-to-Child Transmission of HIV (PMTCT) and the Management of HIV in Children, Adolescents and Adults. Pretoria. NDoH, 2014. http://www.sahivsoc.org/upload/documents/HIV%20guidelines%20_Jan%202015.pdf (accessed 20 March 2019). [ Links ]
44. United Nations. Resolution adopted by the General Assembly. 60/262. Political declaration on HIV/AIDS. 15 June 2006. http://data.unaids.org/pub/report/2006/20060615_hlm_politicaldeclaration_ares60262_en.pdf (accessed August 2019). [ Links ]
45. United States President's Emergency Plan for AIDS Relief (PEPFAR). PEPFAR will invest nearly $2 billion this year to empower and support women and girls. 4 June 2019. https://www.pepfar.gov/press/releases/291640.htm (accessed 12 August 2019). [ Links ]
46. Fleming PJ, Colvin C, Peacock D, Dworkin SL. What role can gender-transformative programming for men play in increasing mens HIV testing and engagement in HIV care and treatment in South Africa: Cult Health Sex 2016;18(11):1251-1264. https://doi.org/10.1080/13691058.2016.1183045 [ Links ]
47. Duby Z, Nkosi B, Scheibe A, Brown B, Bekker LG. 'Scared of going to the clinic. Contextualising healthcare access for men who have sex with men, female sex workers and people who use drugs in two South African cities. South Afr J HIV Med 2018;19(1):701-719. https://doi.org/10.4102/sajhivmed.v19i1.701 [ Links ]
48. Fleming PJ, DiClemente RJ, Barrington C. Masculinity and HIV. Dimensions of masculine norms that contribute to mens HIV-related sexual behaviors. AIDS Behav 2016;20(4):788-798. https://doi.org/10.1007/s10461-015-1264-y [ Links ]
49. Fleming PJ, Dworkin SL. The importance of masculinity and gender norms for understanding institutional responses to HIV testing and treatment strategies. AIDS 2016;30(1):157-158. https://doi.org/10.1097/QAD0000000000000899 [ Links ]
50. Kiene SM, Sileo KM, Dove M, Kintu M. Hazardous alcohol consumption and alcohol-rei ate d problems are associated with unknown and HIV-positive status in fishing communities in Uganda. AIDS Care 2019;31(4):451-459. https://doi.org/10.1080/09540121.2018.1497135 [ Links ]
51. Leichliter JS, Paz-Bailey G, Friedman AL, et al. 'Clinics arerft meant for men. Sexual health care access and seeking behaviours among men in Gauteng province, South Africa. SAHARA J 2011;8(2):82-88. https://doi.org/10.1080/17290376.2011.9724989 [ Links ]
52. Rai T, Lambert HS, Ward H. Migration as a risk and a livelihood strategy. HIV across the life course of migrant families in India. Glob Public Health 2017;12(4):381-395. https://doi.org/10.1080/17441692.2016.1155635 [ Links ]
53. Sileo KM, Fielding-Miller R, Dworkin SL, Fleming PJ. A scoping review on the role of masculine norms in mens engagement in the HIV care continuum in sub-Saharan Africa. AIDS Care 2019;31(11):1435-1446. http://doi.org/10.1080/09540121.2019.1595509 [ Links ]
54. Sileo KM, Wanyenze RK, Luie H, Kiene SM. 'That would be good but most men are afraid of coming to the clinic1. Men and women's perspectives on strategies to increase male involvement in women's reproductive health services in rural Uganda. J Health Psychol 2017;22(12):1552-1562. https://doi.10.1177/1359105316630297 [ Links ]
55. Rai T, Lambert HS, Borquez AB, Saggurti N, Mahapatra B, Ward H. Circular labor migration and HIV in India. Exploring heterogeneity in bridge populations connecting areas of high and low HIV infection prevalence. J Infect Dis 2014;210(Suppl 2):S556-S561. https://doi.org/10.1093/infdis/jiu432 [ Links ]
56. Rai T, Lambert HS, Ward H. Complex routes into HIV care for migrant workers. A qualitative study from north India. AIDS Care 2015;27(11):1418-1423. https://doi.org/10.1080/09540121.2015.1114988 [ Links ]
57. Fleming PJ, Villa-Torres L, Taboada A, Richards C, Barrington C. Marginalisation, discrimination and the health of Latino immigrant day labourers in a central North Carolina community. Health Soc Care Community 2017;25(2):527-537. https://doi.org/10.1111/hsc.12338 [ Links ]
58. Sileo KM, Kizito W, Wanyenze RK, et al. A qualitative study on alcohol consumption and HIV treatment adherence among men living with HIV in Ugandan fishing communities. AIDS Care 2019;31(1):35-40. https://doi.org/10.1080/09540121.2018.1524564 [ Links ]
59. Sileo KM, Simbayi LC, Abrams A, Cloete A, Kiene SM. The role of alcohol use in antiretroviral adherence among individuals living with HIV in South Africa. Event-level findings from a daily diary study. Drug Alcohol Depend 2016;16:103-111. https://doi.org/10.1016/j.drugalcdep.2016.07.028 [ Links ]
60. Whitley R. Men's mental health. Beyond victim-blaming. Can J Psychiatry 2018;63(9):577-580. https://doi.org/10.1177/0706743718758041 [ Links ]
61. Fleming PJ, Lee JG, Dworkin SL. 'Real men don't'. Constructions of masculinity and inadvertent harm in public health interventions. Am J Public Health 2014;104(6):1029-1035. https://doi.org/10.2105/AJPH.2013.30182010 [ Links ]
62. Editorial. For the HIV epidemic to end so must gender inequality. Lancet HIV 2019;6(7):PE411. https://doi.org/10.1016/S2352-3018(19)30198-5 [ Links ]
63. Johnson LF, Dorrington RE, Moolla H. Progress towards the 2020 targets for HIV diagnosis and antiretroviral treatment in South Africa. South Afr J HIV Med 2017;18(1):694-702. https://doi.org/10.4102/sajhivmed.vl8il.69 [ Links ]
64. ESKOM South Africa. Boabab News. Government extends HIV/AIDS campaign to Medupi emplovee?. Johannesburg, South Africa. Eskom, 2011. http://www.eskom.co.za/Whatweredoing/NewBuiid/MedupiPowerStation/Documents/BAOBAB_NEWS_Mar2011.pdf (accessed 15 February 2019) [ Links ]
65. EXXARO. Health Care Initiatives 2019. https://www.exxaro.com/media-centre/2019/exxaros-healthcare-initiatives (accessed 15 August 2019). [ Links ]
 Correspondence:
D K Glencross
deborah.glencross@wits.ac.za
Accepted 28 October 2019

