


Serviços Personalizados
Artigo
 Inglês (pdf)
 Artigo em XML
 Referências do artigo
Indicadores

Links relacionados
-
 Citado por Google
 -
 Similares em Google
Compartilhar

 Permalink
SAMJ: South African Medical Journal
versão On-line ISSN 2078-5135
versão impressa ISSN 0256-9574
SAMJ, S. Afr. med. j. vol.110 no.5 Pretoria Mai. 2020
http://dx.doi.org/10.7196/SAMJ.2020.v110i5.13959
RESEARCH
Correlation between self-monitored mean blood glucose and average plasma glucose estimated from glycated haemoglobin in patients attending the diabetes clinic at Dr George Mukhari Academic Hospital, Pretoria, South Africa
M K NkoanaI; A A RhineII
IMB BCh, FC Path (SA) Chem; Department of Chemical Pathology, School of Medicine, Sefako Makgatho Health Sciences University, Pretoria, South Africa; and National Health Laboratory Service, Dr George Mukhari Academic Hospital, Pretoria, South Africa
IIMB BCh, MMed (Chemical Pathology); Department of Chemical Pathology, Faculty of Medicine and Health Sciences, Stellenbosch University and Tygerberg Hospital, Cape Town South Africa; and National Health Laboratory Service, Cape Town, South Africa
ABSTRACT
BACKGROUND. Glycated haemoglobin (HbAlc) has been used for decades as a measure of chronic glycaemia. A simple linear relationship between HbAlc values and mean blood glucose (MBG) has been identified and led to conversion of HbAlc values into estimated average glucose (eAG) levels, following the findings of the Ale-Derived Average Glucose (ADAG) Study Group. The intention was to help patients with diabetes mellitus (DM) understand their glycaemic control better, as eAG is reported in the same units as self-monitored glucose levels. However, factors other than glycaemia have been found to affect the relationship between HbAlc and MBG.
OBJECTIVES. To: (i) determine the relationship between self-monitored MBG levels and HbAlc values; and (ii) evaluate the correlation between MBG levels and eAG levels calculated from HbAlc values using the regression equation derived from the ADAG Study Group in black South African patients with DM
METHODS. This was a prospective observational study of 96 diabetic patients. MBG levels were calculated using glucose measurements downloaded from the glucose meters for the previous 90 days (3 months). High-performance liquid chromatography was used for measurement of HbAlc values, collected at the end of 3 months. eAG was calculated using the regression equation from the ADAG Study Group, as follows: eAG (mmol/L) = 1.5944 x HbAlc (NGSP, %) - 2.594.
RESULTS. A positive correlation was found between MBG and HbAlc in all participants (R2=0.69, p<0.0001). There was a wide range of MBG levels for any given HbAlc value. Clinically significant differences between MBG and eAG were found, with a >10% difference in 65.6% of the participants. eAG overestimated MBG in -71.8% of the study population, with an overestimation of > 1.6 mmol/L (28.7 mg/dL, equivalent to a 1% change in HbAlc value) in -50% of the total study population.
CONCLUSIONS. Our findings showed an imperfect relationship between MBG levels and HbAlc values. eAG significantly overestimated MBG, and this disagreement may cause confusion among both patients and clinicians. The risk of hypoglycaemic episodes may also increase if HbAlc and eAG alone are used to intensify therapy. We recommend that the use of eAG should be validated prior to implementation in clinical practice. It would be ideal to evaluate the relationship between average glucose and HbAlc in each individual patient in order to provide more personalised diabetes care.
The management of diabetes mellitus (DM) demands accurate assessment of glycaemic control to determine the efficacy of treatment. For decades, glycated haemoglobin (HbAlc) has been a surrogate marker to monitor the control of glycaemia and predict the risk of microvascular complications in patients with DM.[1,2] The Diabetes Control and Complications Trial (DCCT) showed that intensive glycaemic control significantly reduced the risk of long-term microvascular complications for patients with type 1 DM.[3] Similar findings were subsequently reported for patients with type 2 DM.[4] HbAlc values reflect mean blood glucose (MBG) during the preceding 2-3 months, making it a good marker for long-term assessment of glycaemic control.[4,5]
The American Diabetic Association (ADA) recommends self-monitoring of blood glucose and HbAlc as the two techniques to assess glycaemic control. Self-monitoring of blood glucose forms an important component of glucose monitoring in patients with DM, especially those taking insulin therapy, for adjustment of therapy and to prevent hypoglycaemic episodes.[5]
Patient participation is critical in diabetes care, and most patients are familiar with glucose levels and may find it difficult to relate HbAlc values to glucose levels. This problem has led to the derivation of a regression equation for calculating the estimated average glucose (eAG) from the HbAlc value, following the demonstration of a linear relationship between HbAlc values and MBG levels.[6] However to date numerous regression equations have been formulated by many studies,[7] with published data showing substantial variation in individual MBG for a given HbAlc value.[8,9] Most commonly used is Nathans regression equation, derived using data from the Ale-Derived Average Glucose (ADAG) Study Group,[6] previously adopted by the ADA[10] and now implemented in most laboratories. It was hoped that patients would understand the changes in their HbAlc better if they could relate them to eAG
While eAG may improve patients' participation in their diabetic control, the mean value determined from daily capillary glucose monitoring may or may not correlate with the eAG calculated from the HbAlc value. If these two values differ, patients are likely to become confused about their glycaemic status. This possibility should be considered before providing the patient with eAG levels at their follow-up visit, to avoid confusion.
We determined the relationship between self-monitored MBG levels and HbAlc values and the correlation between MBG and HbAlc-derived eAG using the equation from the ADAG Study Group.
Methods
Participants
This observational study was conducted in the diabetes clinic at Dr George Mukhari Academic Hospital, Pretoria, South Africa. Data were collected between October 2017 and January 2018. One hundred and thirty-six patients with DM were initially enrolled in the study. Pregnant women and patients who had conditions such as anaemia, reticulocytosis, chronic renal or liver failure, blood loss and/or transfusion, haemoglobinopathies, or iron, vitamin B12 and folate deficiencies, as well as those on high-dose vitamin C, steroids or erythropoietin therapy, were excluded from the study.
We excluded 40 patients from the study owing to a history of chronic kidney disease with associated anaemia of chronic disease (n=32) and anaemia due to iron and vitamin B12 deficiencies (n=8). The remaining 96 patients were evaluated. The study was approved by the institutional ethical committee (ref. no. MREC/P/241/2014), and informed consent was obtained from all participants.
Glycated haemoglobin assay
Blood for HbAlc testing was collected in ethylenediaminetetra-acetic acid specimen tubes on the day of the clinic visit. HbAlc values were measured by ion-exchange high-performance liquid chromatography using the VARIANT II TURBO system (Bio-Rad Laboratories, USA). The analytical coefficient of variation (CV) of the assay for the duration of the study was 0.8% in National Glycohemoglobin Standardization Program (NGSP) units and 1.2% in SI units. This method is certified by the NGSP and is traceable to the DCCT
Mean blood glucose determination
Self-monitoring capillary glucose measurements were done using the On Call Plus device (On Call Plus Blood Glucose Monitoring System, USA). The day-to-day CV claimed by the manufacturer ranged from 3.3% to 5.0%, assessed using glucose levels ranging from 1.7 mmol/L to 28 mmol/L. Most participants measured their capillary blood glucose twice a day, in the morning before meals and at bedtime. All participants who tested at least once a day were included in the study. Of patients who did fewer glucose tests, only those who tested at least once a day in the month (30 days) preceding their clinic visit were included. A strong correlation has been reported between MBG levels (measured during the preceding month) and HbAlc values.[2] Glucose results were downloaded from the device on the day of the clinic visit. The MBG levels were determined by calculating the average value of all the glucose measurements downloaded from the glucose device for the previous 90 days (3 months).
Estimated average glucose calculation
The eAG was calculated from the HbAlc (%) results using the equation derived from the ADAG Study Group: eAG (mmol/L) = 1.5944 X HbAlc (NGSP, %) - 2.594, (R3 =0.84,p<0.0001).[6]
Statistical analysis
All statistical analyses were performed using the Statistical Package for the Social Sciences (SPSS, version 11.0 for Windows; IBM, USA). The Kolmogorov-Smirnov test was used to evaluate the distribution of the variables. The linear regression model was applied to estimate the relationship between HbAlc and MBG, and Spearman's test was used to assess the correlation between the two parameters. A two-tailed p-value <0.05 was accepted as significant.
The influence of age, gender, type of DM, history of smoking, alcohol use, insulin therapy, hypertension, socioeconomic status and level of education on the relationship between MBG and HbAlc was examined by comparing the slope (MBG v. HbAlc) among the individual subgroups using Fisher 2-transformation (z-observations). Predicted MBG was calculated from HbAlc values based on the regression analysis between MBG and HbAlc.
Agreement between MBG and eAG levels was assessed using Bland-Altman analysis. The limits of agreement (LOA) were set at the internationally accepted maximum error limit of ±10%.[11] The absolute and percentage differences between eAG and MBG were also calculated for each individual to determine their clinical significance.
Results
Characteristics of the study cohort
The study group consisted of 96 black diabetic patients with a median age of 62 years (range 14 - 88 years), of whom 88.5% had type 2 DM and 64.6% were female. The number of capillary glucose measurements ranged from 45 to 297 per participant, with a total of 12 370 glucose tests during the 3-month period. The frequency of glucose testing per day, prior to the measurement of HbAlc at day 90, is shown in Fig. 1. Baseline characteristics of the whole cohort are shown in Table 1. The distributions of age, HbAlc, MBG and eAG were abnormal (p<0.05).

Correlation between MBG and HbAlc
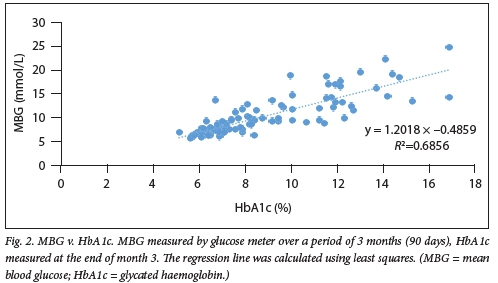
A positive correlation was found between MBG and HbAlc in all participants (R-=0.69; p<0.0001) (Fig. 2). The slope of MBG levels v. HbAlc values was 1.20 mmol/L per 1% HbAlc with an intercept of 0.49 mmol/L, and the Spearman's correlation coefficient (r) was 0.83 (Fig. 2). Factors such as age, gender, smoking status, type of DM, history of alcohol use and insulin therapy as well as socioeconomic status and patient's level of education did not meaningfully affect the slope for MBG v. HbAlc.
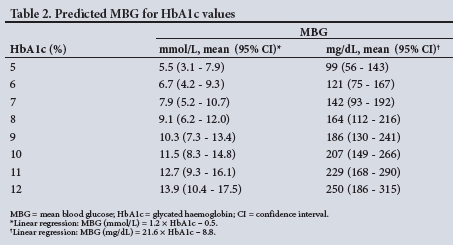
Predicted MBG levels calculated from HbAlc values based on the regression equation from the present study are shown in Table 2, in both conventional and SI units with 95% confidence intervals (CIs).
Agreement between MBG and eAG
The characteristics of the present study compared with the ADAG Study Group are shown in Table 3. The slope and the intercept of the regression equation correlating MBG to HbAlc in our study were lower than those found by the ADAG Study Group.
A Bland-Altman plot was used to assess the agreement between eAG and MBG (Fig. 3). The whole-group average of MBG and eAG was depicted on the x-axis, with the percentage difference between the two parameters on the y-axis. The percentage difference was determined by dividing the absolute value of the difference between eAG and MBG (eAG - MBG) by the average of the two parameters [(eAG + MBG)/2)], multiplied by 100. The LOA were set at the internationally accepted maximum error limit of ±10%.
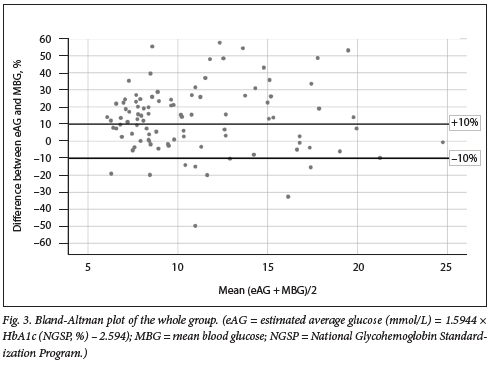
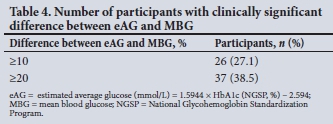
Poor agreement was observed between MBG and eAG. Most results (65.6%) fell outside the limits of agreement (Fig. 3). eAG overestimated MBG in 74.0% of participants, and underestimated MBG in 24.2%. The overestimation and under-estimation of MBG was clinically significant (percentage difference >10%) in 56.3% and 9.4%, respectively. Table 4 shows the total number of participants with a clinically significant difference between MBG and eAG.
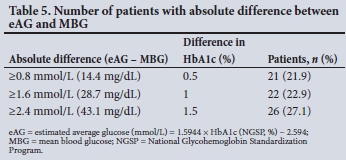
The slope of the regression equation in the ADAG study was 1.6 mmol/L (28.7 mg/ dL) of glucose for every 1% change in HbAlc, so a difference between MBG and eAG of 1.6 mmol/L (28 mg/dL) would be equivalent to a difference of 1% HbAlc. A difference of ^0.5% HbAlc represents a statistically significant change in glycaemic control. In this study, 71.8% of participants had a difference of >0.5% HbAlc, which was represented by an absolute difference of >0.8 mmol/L (14.4 mg/dL) between eAG and MBG (Table 5).
Discussion
Our study supports the notion of a linear relationship between HbAlc values and MBG, but the correlation was poor (R2=0.69) compared with other studies that showed a strong relationship - Nathan et al.[6] (R2 =0.84) and Makris et al.[12](R2=0.86). The slope of the regression equation in our study was 1.2 mmol/L (21.7 mg/dL) glucose for every 1% change in HbAlc. This value is similar to the results of other studies that used continuous glucose monitoring (CGM) devices,[8,9] but is lower than the value reported by Rofhling et al.[13]in a study analysing data from the DCCT (slope of 36 mg/dL (2 mmol/L)) and by the ADAG Study Group[6] (slope of 28.7 mg/ dL (1.6 mmol/L)). This means that in our study population, smaller changes in glucose concentrations translate to large differences in HbAlc values.
There was a wide range of MBG levels for any given HbAlc value in the present study For example, the MBG ranged from 6.0 to 8.2 mmol/L (107.9 - 138.3 mg/dL) for an HbAlc of 7% (n=7) (Fig. 2), suggesting an imperfect relationship between MBG and HbAlc. Factors such as age, gender, smoking status, type of DM, history of alcohol use and insulin therapy, as well as socioeconomic status and patient level of education, did not meaningfully affect the slope for MBG v. HbAlc.
An imperfect relationship between MBG and HbAlc is also demonstrated by the predicted MBG levels for HbAlc values derived from the regression equation (MBG v. HbAlc of the total study population), which showed a wide range in predicted MBG levels for any given HbAlc value (Table 2). The predicted MBG levels also showed an overlap between HbAlc values. For example, at an HbAlc value of 7%, the predicted MBG was 7.9 mmol/L with a 95% CI ranging from 5.2 to 10.7 mmol/L, which overlaps with the 95% CI of the MBG at HbAlc of 8% (6.2 - 12.0 mmol/L) (Table 2).
The poor correlation observed in our study could be due to inaccurate calculation of the MBG, either from infrequent measurements of blood glucose or portable meter inaccuracies. The majority of the study participants were elderly (55% of the study population were aged >60 years), and they may have struggled with the capillary glucose measurements or used improper measurement techniques, even though they received prior training. However, other studies that incorporated the use of CGM, which offers the most accurate assessment of glycaemia, also reported a poor correlation between HbAlc and MBG, supporting the notion that the discrepancy could be due to biological variation in erythrocyte survival or glycation rates.[8,9,13-15]
Numerous authors have hypothesised that the rate of glycation is not constant, and that even at the same MBG the glycation rate may differ between individuals, as some patients are high glycators while others are low glycators. Even if they have the same MBG, the high glycators will have much higher HbAlc than the low glycators.[15] Racial and ethnic differences in the relationship between HbAlc levels and average glycaemia have also been reported, and non-glycaemic factors affecting haemoglobin glycation, differences in red cell survival, and the balance of glucose between the extracellular and intracellular red blood cell environment have been postulated as probable contributing factors.[16-20]
The second objective of our study was to evaluate the application of the HbAlc-derived eAG (ADAG equation) in our study population. Disagreement between MBG and eAG was observed (Fig. 3). We found clinically significant differences between MBG and eAG (Table 4), with MBG significantly overestimated in 56.3% of the total number of participants and underestimated in 9.4%. Further analysis showed that eAG overestimated MBG by >0.8 mmol/L (14.4 mg/dL, equivalent to a 0.5% change in HbAlc value) in -71.8% of all participants (Table 5). A 0.5% change in HbAlc represents a statistically significant change in glycaemic control.[21,22] If HbAlc and eAG alone are used to adjust anti-glycaemic therapy, there would therefore be an increased risk of hypoglycaemic episodes.
The differences in the study designs between the ADAG study and the present study may have attributed to the observed poor correlation between MBG and eAG. Firstly, 83% of the ADAG study participants were white and only 8% were African American, whereas only black South Africans were included in our study. The findings of the ADAG study suggested a different slope and intercept in the regression line (p=0.07) for African Americans, indicating that they may have slightly lower MBG levels for a given value of HbAlc. These findings are indeed in keeping with the overestimation of MBG by eAG (derived from the ADAG regression equation) observed in our study. The slope and intercept of the regression line found in our study are lower than those in the ADAG study (Table 3). Racial and ethnic variations in HbAlc have been reported.[16,20]
Secondly, the ADAG study population included both type 1 and type 2 diabetic patients as well as non-diabetic participants. In contrast, our study population was composed of only diabetic patients (type 1 and type 2 DM). Lastly, only patients with stable glycaemia participated in the ADAG study, while there were no selection criteria in respect of glycaemic stability in our study group. As a result, the ADAG study-derived regression equation may be applicable only to patients with stable glycaemia.
The ADAG Study Group has recommended translation of HbAlc values to eAG levels in order to enable patients to understand their glycaemic status better, as it is reported in the same units as values obtained from patient self-monitoring.[6] Many laboratories today are reporting HbAlc results with eAG levels. In order to use eAG to reliably guide the management of diabetic patients, a fairly close agreement should exist between eAG and MBG in most patients. Our findings showed that eAG significantly overestimated MBG, and if HbAlc and eAG alone are used by clinicians to monitor glycaemic control and adjust therapy, there may therefore be an increased risk of hypoglycaemic episodes. The disagreement between MBG and eAG may also cause confusion in patients who self-monitor their MBG.
Study limitations
Limitations of this study include the use of glucose meters (discrete method) to determine MBG levels, which may have influenced the accuracy of MBG levels as a result of infrequent glucose measurements. The inclusion of participants who had a limited number of glucose tests (<1 test per day) may have also affected the accuracy of MBG levels for those participants. However, when these patients were excluded from analysis, there was no statistically significant difference in the slope of the regression line between MBG and HbAlc when data for the remaining participants were analysed (1.2 v. 1.1). Type 1 DM patients were under-represented in our study (11.5 %), so our findings may not be applicable to this group.
Conclusions
Our study has shown an imperfect relationship between MBG and HbAlc. Our findings disagree with the conclusions of the ADAG Study Group that a calculated mean glucose derived from HbAlc is clinically equivalent to self-monitored MBG. Our findings further suggest that in our population, eAG overestimated MBG in most participants. This disagreement may lead to confusion on the part of both patients and clinicians. The risk of hypoglycaemic episodes may also increase if HbAlc and eAG alone are used to intensify therapy We recommend that the use of eAG should be validated prior to implementation in clinical practice.
Declaration. The research for this study was done in partial fulfilment of the requirements for MKN's MMed (Chemical Pathology) degree at Sefako Makgatho Health Sciences University
Acknowledgements. We thank the Dr George Mukhari Academic Hospital diabetes clinic staff for their kind support and assistance with the recruitment of the study participants.
Author contributions. MKN: conception and design of the study; protocol submission; data collection, analysis and interpretation; revision of important content; and final approval of the version to be published. AAK (MMed supervisor): conception and design of the study; editing and revision of important content; and final approval of the version to be published.
Funding. This research project was funded by the National Health Laboratory Service (NHLSRT- GRANT004_94427).
Conflicts of interest. None.
References
1. Sacks DB. Correlation between hemoglobin Ale (HbAlc) and average blood glucose. Can HbAlc be reported as estimated blood glucose concentration? J Diabetes Sei Technol 2007;1(6):801-803. https://doi.org/10.1177/193229680700100602 [ Links ]
2. Nathan DM, Turgeon H, Regan S. Relationship between glycated hemoglobin and mean glucose levels over Ume. Diabetologica 2007;50(11):2239-2244. https://doi.org/10.1007/s00125-007-0803-0 [ Links ]
3. Diabetes Control and Complications Trial Research Group. The effect of intensive treatment of diabetes on the development and progression of long-term complications in insulin-dependent diabetes mellitus. N Engl J Med 1993;329(14):977-986. https://doi.org/10.1056/nejml99309303291401 [ Links ]
4. UK Prospective Diabetes Study Group. Intensive blood glucose control with sulphonylureas or insulin compared with conventional treatment and risk of complications in patients with type 2 diabetes (UKPDS 33). Lancet 1998;352(9131):837-853. https://doi.org/10.1016/s0140-6736(98)07019-6 [ Links ]
5. American Diabetes Association. Standards of medical care in diabetes - 2019. Diabetes Care 2018;42(Suppl 1):S1-S194. https://doi.org/10.2337/cd18-0105 [ Links ]
6. Nathan DM, Kuenen J, Borg R, Zheng H, Schoenfeld D, Heine RJ, Ale-Derived Average Glucose Study Group. Translating the Ale assay into estimated average glucose value. Diabetes Care 2008;31(8):1473-1478. https://doi.org/10.2337/dc08-0545 [ Links ]
7. Makris K, Spanou L. Is there a relationship between mean blood glucose and glycated hemoglobin? J Diabetes Sei Technol 2011;5(6):1572-1583. https://doi.org/10.1177/193229681100500634 [ Links ]
8. Diabetes Research in Children Network (DirectNet) Study Group. Relationship of Ale to glucose concentrations in children with type 1 diabetes. Assessment by high-frequency glucose determinations by sensors. Diabetes Care 2008;31(3):381-385. https://doi.org/10.2337/dc07-1835 [ Links ]
9. Juvenile Diabetes Research Foundation Continuous Glucose Monitoring Study Group. Hemoglobin Ale and mean glucose in patients with type 1 diabetes. Analysis of data from the Juvenile Diabetes Research Foundation continuous glucose monitoring randomized trial Diabetes Care 2011;34(3):540-544. https://doi.org/10.2337/dc10-1054 [ Links ]
10. Consensus Committee. Consensus statement on the worldwide standardization of the hemoglobin AlC measurement. American Diabetes Association, European Association for the Study of Diabetes, International Federation of Clinical Chemistry and Laboratory Medicine, and the International Diabetes Federation. Diabetes Care 2007;30(9):2399-2400. https://doi.org/10.2337/dc07-9925 [ Links ]
11. American Diabetes Association. Self-monitoring of blood glucose. Diabetes Care 1994;17(1):81-86. https://doi.org/10.2337//diacare.17.1.81 [ Links ]
12. Makris K, Spanou L. Rambaouni-Antoneli A, et al. Relationship between mean blood glucose and glycated haemoglobin in type 2 diabetic patients. Diabet Med 2008;25(2):174-178. https://doi.org/10.1111/j.1464-5491.2007.02379.x [ Links ]
13. Rohjfing CL, Wiedmeyer HM, Little RR, England JD, Tennill A, Goldstein DE. Definingthe relationship between plasma glucose and HbAlc Analysis of glucose profiles and HbAlc in the Diabetes Control and Complications Trial. Diabetes Care 2002;25(2):275-278. https://doi.org/10.2337/diacare.25.2.275 [ Links ]
14. Hempe JM, Gomez R, McCarter RJ, Chalew SA. High and low hemoglobin glycation phenotypes in type 1 diabetes. A challenge for interpretation of glycemic control. J Diabetes Complicat 2002;16(5):313-320. https://doi.org/10.1016/s1056-8727(01)00227-6 [ Links ]
15. Herman WH, Cohen RM. Racial and ethnic differences in the relationship between HbAlc and blood glucose. Implications for the diagnosis of diabetes. J Clin Endocrinol Metab 2012;97(4):1067-1072. https://doi.org/10.1210/jc.2011-1894 [ Links ]
16. Cohen RM, Franco RS, Khera, et al. Red cell life span heterogeneity in hematologically normal people is sufficient to alter HbAlc. Blood 2008;112(10):4284-4289. https://doi.org/10.1182/blood-2008-04-154112 [ Links ]
17. Khera PK, Joiner CH, Carruthers A, et al. Evidence for inter-individual variation in the glucose gradient across the human RBC membrane and its relationship to Hblc. Diabetes 2008;57(9):2445-2452. https://doi.org/10.2337/db07-1820 [ Links ]
18. Cohen RM, Snieder H, Lindseli CJ, et al. Evidence for independent heritability of the glycation gap (glycosyiation gap) fraction of HbAlc in nondiabetic twins. Diabetes Care 2006;29(8):1739-1743. https://doi.org/10.2337/dc06-0286 [ Links ]
19. Herman WH, Ma Y, Uwaifo G, et al. Differences in A1C by race and ethnicity among patients with impaired glucose tolerance in the Diabetes Prevention Program. Diabetes Care 2007;30(10):2453-2457. https://doi.org/10.2337/dc06-2003 [ Links ]
20. Kilpatrick ES, Glycated haemoglobin in the year 2000. J Clin Path 2000;53(5):335-339. https://doi.org/10.1136/jcp.53.5.335 [ Links ]
21. Sacks DB, Arnold M, Bakris GL, et al. Executive Summary. Guidelines and recommendations foi laboratory analysis in the diagnosis and management of diabetes mellitus. Clin Chem 2011;57(6):793-798. https://doi.org/10.1373/clinchem.2011.163634 [ Links ]
22. Little RR, Rohlfing CL, Sacks DB. Status of hemoglobin Ale measurement and goals for improvement From chaos to order for improving diabetes care. Clin Chem 2011;57(2):205-214. https://doi.org/10.1373/clinchem.2010.148841 [ Links ]
 Correspondence:
MK Nkoana
cuttykay@gmail.com
Accepted 30 September 2019

