


Serviços Personalizados
Artigo
 Inglês (pdf)
 Artigo em XML
 Referências do artigo
Indicadores

Links relacionados
-
 Citado por Google
 -
 Similares em Google
Compartilhar

 Permalink
SAMJ: South African Medical Journal
versão On-line ISSN 2078-5135
versão impressa ISSN 0256-9574
SAMJ, S. Afr. med. j. vol.110 no.3 Pretoria Mar. 2020
http://dx.doi.org/10.7196/samj.2020.v110i3.13995
RESEARCH
Validation of equations to estimate glomerular nitration rate in South Africans of mixed ancestry
J L HolnessI; K BezuidenhoutII; M R DavidsIII; J M WarwickIV
IMB ChB, FCNP (SA), MMed (Nuclear Medicine), PhD; Division of Nuclear Medicine, Department of Medical Imaging and Clinical Oncology, Faculty of Medicine and Health Sciences, Stellenbosch University and Tygerberg Hospital, Cape Town, South Africa
IIMB ChB, FCP (SA), MMed (Internal Medicine), Cert Nephrology (SA) Phys; Division of Nephrology, Department of Medicine, Faculty of Medicine and Health Sciences, Stellenbosch University and Tygerberg Hospital, Cape Town, South Africa
IIIMB ChB, FCP (SA), MMed (Internal Medicine), PhD; Division of Nephrology, Department of Medicine, Faculty of Medicine and Health Sciences, Stellenbosch University and Tygerberg Hospital, Cape Town, South Africa
IVBSc, MB ChB, FCNP (SA), MMed (Nuclear Medicine), PhD; Division of Nuclear Medicine, Department of Medical Imaging and Clinical Oncology, Faculty of Medicine and Health Sciences, Stellenbosch University and Tygerberg Hospital, Cape Town, South Africa
ABSTRACT
BACKGROUND. The Modification of Diet in Renal Disease (MDRD) and Chronic Kidney Disease Epidemiology Collaboration (CKD-EPI) equations are two commonly used formulae to estimate glomerular filtration rate (GFR) in adults. The CKD-EPI equation is recommended in current international and local guidelines for the diagnosis and management of chronic kidney disease (CKD), unless an alternative equation has been shown to have superior accuracy. Validation and comparison of the equations in local populations are therefore required. Previous studies have reported on the accuracy of these prediction equations in black South Africans and those of Indian ancestry.
OBJECTIVES. To evaluate the MDRD and CKD-EPI equations in South African (SA) adults of mixed ancestry.
METHODS. In all participants, GFR was measured (mGFR) from plasma clearance of 99mTc-diethylenetetraaminepenta-acetic acid (99mTc-DTPA), using a standardised technique. Serum creatinine assays were isotope dilution mass spectrometry traceable. GFR was estimated (eGFR) using the MDRD and CKD-EPI equations, with and without the black ethnicity factor. The agreement, bias, precision and accuracy of each equation was determined.
RESULTS. Eighty adults were included (30 male, median age 39 years, median GFR 59 mL/min/1.73 m2). Sixty-eight had a diagnosis of CKD, 10 were potential kidney donors, and 2 were healthy volunteers. Both equations, without the black ethnicity factor, had good agreement with measured GFR. The equations tended to overestimate GFR, with bias of 1.6 and 7.9 mL/min/1.73 m2 for the MDRD and CKD-EPI equations, respectively. The interquartile ranges of the differences were 15.9 and 20.2 mL/min/1.73 m2, and as a measure of accuracy, the percentages of estimates that fell within 30% of the mGFR (P30) were 80% and 72.5% (p=0.18). For identification of individuals with a GFR <60 mL/min/1.73 m2, the sensitivity of MDRD eGFR was 97.3% and that of CKD-EPI eGFR was 97.1%.
CONCLUSIONS. The MDRD and CKD-EPI equations have shown satisfactory and comparable performance in this SA mixed-ancestry adult population, with the MDRD equation marginally less biased than the CKD-EPI.
Chronic kidney disease (CKD) is defined by the presence of abnormalities of kidney structure or function (such as a glomerular filtration rate (GFR) <60 mL/min/1.73 m2), present for >3 months, with implications for health.[1] The Kidney Disease: Improving Global Outcomes (KDIGO) guideline recommends using a creatinine-based equation to estimate GFR in the initial assessment of CKD and for monitoring disease progression.[1] The two most commonly used equations in adults are the Modification of Diet in Renal Disease (MDRD) equation[2,3] and the Chronic Kidney Disease Epidemiology Collaboration (CKD-EPI) equation.[4] Unless an alternative equation has been shown to have superior accuracy, use of the CKD-EPI equation is recommended.[1,5]
A 2012 systematic review found that neither the MDRD nor the CKD-EPI equation performed well in populations outside North America, Europe or Australia, and it concluded that neither equation could be used routinely across all populations and all GFR ranges.[6] Studies conducted in various South African (SA) populations support this, and although the findings varied, the equations tended to have unacceptable bias, precision and/or accuracy.[7-11] The poor performance of the equations in SA populations is concerning. SA is a developing country with limited centres that are able to measure GFR. Even where the service is available, the large number of CKD patients attending renal clinics precludes routine GFR measurement, compelling physicians to rely on estimated GFR (eGFR). Furthermore, GFR estimates are essential in epidemiological studies, specifically to determine CKD prevalence.
The mixed-ancestry (coloured) population group is estimated to comprise 8.8% of SAs population[12] and almost 49% of the Western Cape Province population.[13] Its origins are Khoisan (32 - 43%), Bantu-speaking African (20 - 36%), European (21-28%) and Asian (9 -11%).[14] No previous studies have evaluated GFR-estimating equations in this group, despite the fact that it has a high prevalence of CKD.[15,16] Considering the population group's genetic diversity, it is hypothesised that accuracy of the commonly used equations will be poor.
Objectives
To evaluate the performance of the MDRD and CKD-EPI equations in mixed-ancestry SA adults.
Methods
Participants
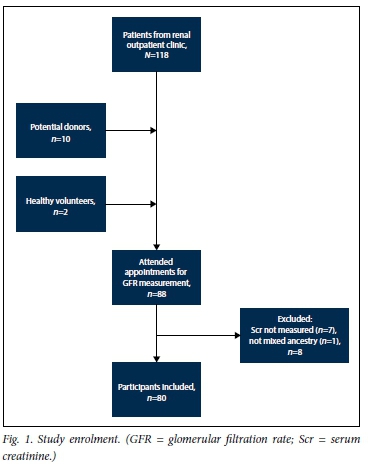
Participants were recruited from the outpatient clinics of the Division of Nephrology at Tygerberg Hospital, Cape Town, between June 2015 and October 2018. Patients attending routine outpatient appointments or individuals being worked up for potential kidney donation were screened by a renal physician to exclude acute renal failure, concurrent illness, cancer, expanded extracellular fluid volumes (ascites, oedema or pleural effusions), pregnancy or breastfeeding. After screening, adult patients (>18 years) who self-classified as South Africans of mixed ancestry were invited to participate. All participants provided written informed consent. The study was approved by the Stellenbosch University Health Ethics Research Committee (ref. no. S14/10/217).
GFR measurement
GFR was measured in the Nuclear Medicine Division of Tygerberg Hospital following our departmental protocol, which is based on the methodology in the 2004 British Nuclear Medicine Society GFR guideline.[17] On arrival, the height and weight of the participant was recorded. Approximately 40 MBq of 99mTc-diethylenetetraaminepenta-acetic acid (99mTc-DTPA) was injected through an intravenous catheter. Extravasation was excluded by imaging the injection site using a gamma camera. A similar dose of 99mTc-DTPA was used for preparation of the standard. Patient and standard doses were calibrated accurately by weighing the syringes before and after administration of the doses on a Precisa 620C balance (precision = 0.005 g) (Precisa Balances Ltd, UK). In order to avoid excessively high count rates, a double dilution of the standard was performed, resulting in an effective volume of 5 L. Duplicate 1 mL samples of the standard were pipetted into counting tubes. Venous blood samples were taken from the contralateral arm at 2, 3 and 4 hours after 99mTc-DTPA administration. After centrifugation at 1 000 g for 10 minutes, duplicate 1 mL plasma samples were pipetted into counting tubes. The plasma and standard samples were counted simultaneously in a multichannel well counter (VIDEOGAMMA 4880; l'acn Scientific Laboratories, Italy) together with two empty counting tubes for background correction. GFR was calculated using the slope-intercept method.[17,18] The clearance values obtained were corrected for body surface area (BSA) using the Haycock formula,[19] and to correct for the systematic underestimation of GFR that is inherent to the slope-intercept method, the mean Bröchner-Mortensen correction was applied.[17,20,21] Routine quality control checks were performed on each GFR study.
GFR estimation
A venous blood sample was taken for creatinine measurement immediately prior to administration of the 99mTc-DTPA dose. Serum creatinine (Scr) was measured by the Tygerberg Hospital National Health Laboratory Service. Initially a method based on the Jafte reaction was used (Siemens ADVIA 1800; Siemens Healthineers, Germany). In September 2016, the analyser was replaced with a Roche Cobas 6000, c501 module (Roche, Switzerland), where an enzymatic method is applied. Both methods have been standardised against isotope dilution mass spectrometry. The analytical imprecision and total error of the Siemens Advia 1800 were 2.0% and 2.4%, respectively, at Scr 79 umol/L, 2.1% and 7.2% at Scr 166 umol/L, and 1.8% and 6.7% at Scr 529 umol/L. Values for the Roche Cobas 6000 analyser were 1.9% and 2.4% at Scr 90.5 umol/L, and 1.3% and 4.1% at Scr 327.9 umol/L.
Estimated GFR was calculated using the following equations, both of which are corrected for BSA:
1. The re-expressed, 4-variable MDRD equation:[3]
eGFR (mL/min/1.73 m2) = 175 x (Scr/88.4)-1.154x age-0203x g x e, where Scr is serum creatinine in umol/L, g is a gender factor (male = 1, female = 0.742), and e is an ethnicity factor (African American = 1.212, other ethnic groups = 1).
2. The CKD-EPI equation:[4]
eGFR = 141 x min(Scr/k,l)° x max(Scr/k,l)-1.209x 0.993agex g x e, where Scr is serum creatinine in umol/L, k is 61.9 for females and 79.6 for males, a is -0.329 for females and -0.411 for males, min(x,y) and max(x,y) indicate the minimum and maximum of x and y, respectively, g is a gender factor (male = 1, female = 1.108), and e is an ethnicity factor (African American = 1.159, other ethnic groups = 1).
Data analysis
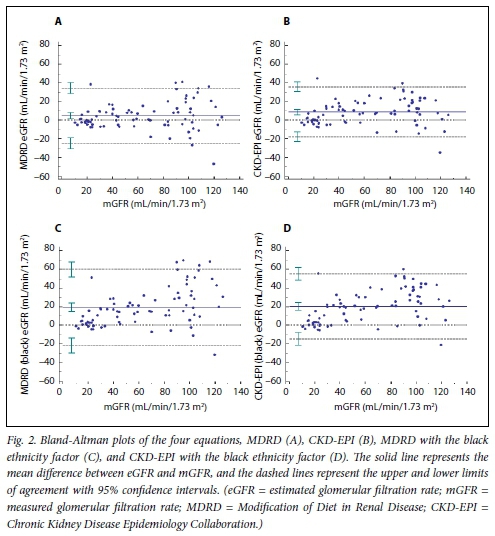
Bias was calculated as the median difference between eGFR and measured GFR (mGFR). Precision was expressed as the interquartile range (IQR) of the differences, and as the root mean square error of the regression of eGFR v. mGFR. As measures of accuracy, the root mean square error (RMSE) values (calculated as the square root of mean (log eGFR - log mGFR)2) and percentages of GFR estimates that fell within 30% (P30) and 20% (P20) of the mGFR were calculated. Bland-Altman analyses[22] were used to determine the agreement between eGFR and mGFR. The sensitivity, specificity and positive predictive value for identifying individuals with an mGFR <60 mL/ min/1.73 m2 were calculated for each equation. The Shapiro-Wilk test was used to test for normality. The McNemar test was used to compare proportions.
Statistical analysis was performed using MedCalc Statistical Software for Windows v.18.10.2 (MedCalc Software, Belgium (https://www.medcalc.org), 2018).
Results
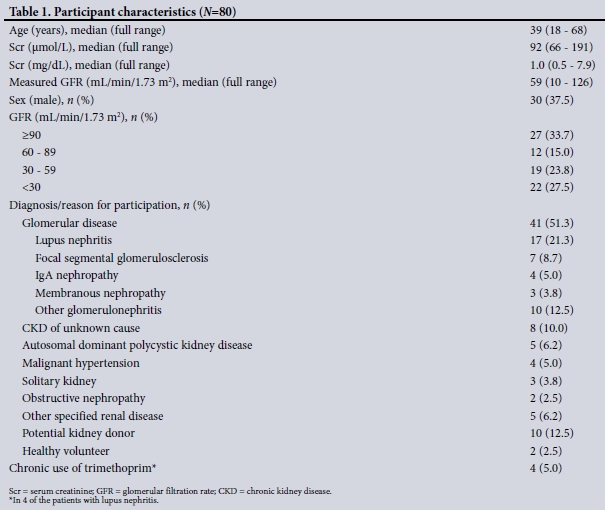
In total, 80 participants were included (30 male, median age 39 years, full age range 18 - 68 years). Sixty-eight had a diagnosis of CKD, 10 were potential kidney donors, and 2 were healthy volunteers. The median mGFR was 59 mL/min/1.73 m2 (full range 10 - 126 mL/ min/1.73 m2) (Fig. 1 and Table 1).
In 46 individuals, Scr was measured using the Jaffe (alkaline picrate) method, and in 34 the enzymatic method on the new analyser was used. There was no significant difference in bias or precision of the equations between the alkaline picrate and enzymatic groups (data not shown).
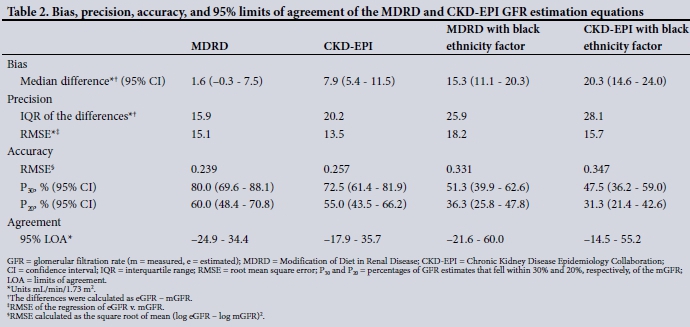
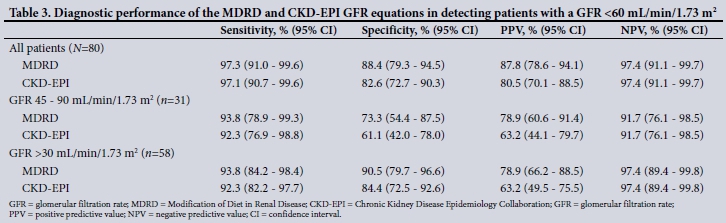
The performance of the GFR estimation equations is shown in Table 2. The bias of the MDRD equation was 1.6 mL/min/1.73 m2, whereas the CKD-EPI equation overestimated GFR by 7.9 mL/ min/1.73 m2. The RMSE values of the regression of MDRD and CKD-EPI v. mGFRwere 15.1 and 13.5 mL/min/1.73 m2, respectively, whereas the IQR of the differences was narrower for the MDRD equation than the CKD-EPI (15.9 v. 20.2 mL/min/1.73 m2). The P30 values did not differ significantly (MDRD 80.0%, CKD-EPI 72.5%; p=0.18). When the black ethnicity factor was applied, bias, precision and accuracy of both equations deteriorated. The Bland-Altman analyses are shown in Fig. 2. Both equations had non-significantly higher P30 values in the subgroup of individuals with a GFR >60 mL/ min/1.73 m2 (MDRD 84.6%, CKD-EPI 82.1%) than in the GFR <60 mL/min/1.73 m2 subgroup (MDRD 75.6%, CKD-EPI 63.4%). For identification of individuals in whom the GFR was <60 mL/ min/1.73 m2, the sensitivities of the MDRD and CKD-EPI equations were >90% in the three subgroups analysed (Table 3).
Discussion
The performance of both equations was satisfactory in this mixed-ancestry SA population. The MDRD equation was less biased than the CKD-EPI equation, over-estimating mGFR by 1.6 mL/min/1.73 m2 compared with 7.9 mL/min/1.73 m2 (p<0.001). The IQRs of the differences were 15.9 mL/ min/1.73 m2 for the MDRD equation and 20.2 ml/min/1.73 m2 for the CKD-EPI equation, and the RMSE values were 16.0 and 16.4 mL/min/1.73 m2, respectively. Accuracy was not significantly different, with P30 values of 80% and 72.5% (p=0.18). In the original CKD-EPI study, the CKD-EPI equation was compared with the MDRD equation using a large validation set of 6 646 individuals.[4] Although the majority of participants were white and had CKD, the population was fairly diverse in terms of ethnicity (19% black, ~4% Asian/Hispanic) and pathology (29% diabetes, 19% transplant recipients, 14% healthy kidney donors). The mean GFR was 68 mL/min/1.73 m2. The median difference, IQR and P30 of the MDRD equation were -5.5 mL/min/1.73 m2, 18.3 mL/min/1.73 m2 and 80.6%. The CKD-EPI equation performed marginally better, with a bias of 2.5 mL/min/1.73 m2, an IQR of 16.6 mL/min/1.73 m2 and a P30 of 84.1%. In an earlier study, the MDRD equation was evaluated in a large population pooled from 10 studies (mean GFR 68 mL/min/1.73 m2, 32% black, 5% Asian/Native American, 29% diabetes, 5% transplant recipients).[23] Median bias was -2.7 mL/min/1.73 m2, IQR 16.4 mL/min/1.73 m2 and P30 83%. The results in our study, specifically for the MDRD equation, are comparable to these and some of the other large validation studies from North American, European and Australian populations.[6]
For identification of individuals with a GFR <60 mL/min/1.73 m2, both equations performed well, with sensitivities >97% and specificities and positive predictive values >80%. This is useful information for screening programmes or for researchers conducting epidemiological studies on the prevalence of CKD in local communities. Although sensitivity decreased slightly when individuals with a GFR <30 mL/min/1.73 m2 were excluded from the analysis, it remained >90% for both equations. For the GFR subgroups analysed, the MDRD equation tended to perform better than the CKD-EPI; however, as expected from the small numbers in each group, the differences were not significant.
A few investigators have evaluated the MDRD and CKD-EPI equations in other SA populations. One consistent finding across all the studies in black South Africans was that incorporation of an African American ethnicity factor resulted in a substantial increase in bias and a decrease in precision and accuracy[7,9-11] It is therefore not surprising that similar results were found in our mixed-ancestry population (Table 2). In a study of 100 black South Africans with CKD, the bias, precision and accuracy of the MDRD equation were similar to our values.[7] In half of the same population (i.e. 50 black South Africans), the CKD-EPI equation had a median bias of 4.9 mL/min/1.73 m2 and a P30 of 74%, values also very similar to ours.[8] In a separate study of 91 black South Africans with CKD, bias of the MDRD equation was negligible but the precision was poor as reflected by the wide 95% limits of agreement in the Bland-Altman analyses (-37.9 - 40.0 mL/min/1.73 m2).[10] The P30 of the MDRD equation in this study ranged between 36% and 69% depending on the GFR. In a more recent study of 188 black South Africans, the P30 value of the MDRD equation was 53 - 54% and that of the CKD-EPI equation 53 - 54%, whereas the P30 values in 99 Indian South Africans were 49 - 66% and 54 - 66% for the MDRD and CKD-EPI equations, respectively[11] This population included individuals with malignancy (58%) and CKD (38%).
Possible reasons for the poorer performance of eGFR in previous SA studies include differences in ethnicity, mean GFR, pathology and/or methodology. Many other studies in populations outside the USA, Europe and Australia have shown similarly poor results, and in most cases these have been attributed to ethnic differences.[6] Although South Africans of mixed ancestry are genetically diverse, with Khoisan (32 - 43%), Bantu-speaking African (20 - 36%), European (21 - 28%) and Asian (9 - 11%) ancestral components,[14] this diversity did not significantly limit eGFR performance in this population. Furthermore, the fact that some studies in black Africans with CKD had similar results suggests that ethnicity may be less important than other factors.[7,8]
Possibly one of the most important determinants of the effectiveness of eGFR equations is patient pathology. The population in our study comprised CKD patients (85%) and healthy individuals (15%), a composition similar to the development populations of the MDRD and CKD-EPI equations, which is likely to have contributed towards the good performance of the equations in our study. In contrast, in the most recent of the SA studies, 58% of patients had cancer.[11] A lower average Scr concentration in this population[11] may explain the positive bias found for both MDRD and CKD-EPI equations, as cancer and other chronic illnesses are known to reduce creatinine generation through muscle wasting.[24]
In the measurement of GFR, factors such as the use of a different filtration marker or method to calculate GFR will result in systematic differences in mGFR; however, provided measurement of GFR is performed correctly, the effect should be small. This is because the error on eGFR - mGFR is equal to V[( error on eGFR)2 + (error on mGFR)2], so if the error in mGFR « error in eGFR, the latter would contribute little to the error on the difference. In the present study, meticulous care was paid to methodology for GFR measurement. Our departmental guideline adheres strictly to the 2004 British Nuclear Medicine Society GFR guideline,[17] and we perform rigorous quality control checks on each GFR study. Furthermore, an analysis of measurement errors in our unit, taking into account error in all aspects of the investigation (e.g. measuring patient height and weight, preparation of the standard, measuring of doses, recording of time, pipetting technique and counting of samples), revealed an error in mGFR of ~2 mL/min/1.73 m2.[25]
All participants in the present study were screened meticulously by a renal physician, a factor that may contribute to the relatively good performance of eGFR. Patients with expanded extracellular fluid volumes (ascites, oedema or pleural effusions), acute renal failure, any acute concurrent illness, or any other reason to suspect unstable kidney function were not considered for inclusion. Furthermore, GFR and Scr were measured on the same day in every patient. Although fluctuations in Scr may to a degree mirror fluctuations in GFR, with coefficients of variation (CV) for repeat measurements of ~8 - 10% for GFR and 6% for Scr,[17,26] measurement of these parameters on different days will limit the precision that is attainable. Use of a Jaffe assay rather than an enzymatic method for creatinine measurement will further limit the precision considering analytical CVs of -5.5% and 2%, respectively.[26]
Study limitations
The main limitation of this study is the sample size; however, the study was sufficiently powered to draw conclusions about the performance of the equations in the population. The primary outcome variable is the P30 proportion. A sample size of 80 is sufficient to estimate the true population value of P30 using a 95% confidence interval (CI) to within 10% of the true value (i.e. a CI width of 20%), given that the P30 is 70 - 80%. While a better estimation of P30 is ideal, an estimation within 10% can be regarded as acceptable. On the other hand, a sample size of -150 would be required to detect a significant difference between the MDRD and CKD-EPI equations at P30 values of 80% and 72.5%, respectively. It therefore cannot be concluded that the MDRD equation outperformed the CKD-EPI equation in this study. Ideally, more patients with normal kidney function would have been included. This might have resulted in better performance of the CKD-EPI equation, as (!) the MDRD equation has been shown to have poorer accuracy at higher GFR levels,[23] and (ii) the CKD-EPI equation was found to be more accurate than the MDRD in most GFR subgroups.[27] Based mainly on a CKD population, our results are not necessarily generalisable to other populations, e.g. patients with cancer. Four of the patients with lupus nephritis who were included used trimethoprim chronically. Trimethoprim is known to interfere with the tubular secretion of creatinine, thus raising Scr levels.[28] However, the effect of this factor on the overall results of the study is thought to be minimal.
Conclusions
The MDRD and CKD-EPI equations have both shown satisfactory performance in this SA mixed-ancestry adult population, with comparable accuracy. This information is reassuring to physicians treating patients with CKD and to researchers conducting epidemiological studies.
Declaration. This article emanated from JLH's PhD dissertation (Stellenbosch University December 2019).
Acknowledgements. The authors thank Dr Katrien Kruger of the National Health Laboratory Service, Tygerberg Hospital, for her assistance with the technical aspects of creatinine measurement and for providing the performance data for the analysers.
Author contributions. JLH: data analysis, manuscript preparation. KB: participant recruitment, manuscript review. MRD: co-supervisor, manuscript review. JMW: supervisor, manuscript review.
Funding. JMW received funding from the National Research Foundation, SA (grant no. 93471). JLH received funding from the South African Medical Research Council (SAMRC) through its Division of Research Capacity Development, under the Clinician Researcher Development PhD Scholarship Programme. The funding is provided by the SA National Treasury. The content of the article is the sole responsibility of the authors and does not necessarily represent the official views of the SAMRC or the hinders.
Conflicts of interest. None.
References
1. Kidney Disease. Improving Global Outcomes (KDIGO) CKD Work Group. KDIGO 2012 Clinical Practice Guideline for the Evaluation and Management of Chronic Kidney Disease. Kidney Int Suppl 2013;3(1):1-150. https://doi.org/10.1038/kisup.2012.73 [ Links ]
2. Levey AS, Bosch JP, Lewis JB, Greene T, Rogers N, Roth D. A more accurate method to estimate glomerular filtration rate from serum creatinine. A new prediction equation. Ann Intern Med 1999;130(6):461-470. https://doi.org/10.7326/0003-4819-130-6-199903160-00002 [ Links ]
3. Levey AS, Coresh J, Greene T, et al. Expressing the Modification of Diet in Renal Disease Study Equation for estimating glomerular filtration rate with standardized serum creatinine values. Clin Chem 2007;53(4):766-772. https://doi.org/10.1373/clinchem.2006.077180 [ Links ]
4. Levey AS, Stevens LA, Schmid CH, et al. A new equation to estimate glomerular filtration rate. Ann Intern Med 2009;150(9):604-612. https://doi.org/10.7326/0003-4819-150-9-200905050-00006 [ Links ]
5. South African Renal Society. Guideline for the Optimal Care of Patients on Chronic Dialysis in South Africa. Durban. SARS, 2015. http://sa-renalsociety.org/guidelines (accessed 17 January 2019). [ Links ]
6. Earley A, Miskulin D, Lamb EJ, Levey AS, Uhlig K. Estimating equations for glomerular filtration rate in the era of creatinine standardization. A systematic review. Ann Intern Med 2012;156(11):785-795. https://doi.org/10.7326/0003-4819-156-11-201203200-00391 [ Links ]
7. Van Deventer HE, George JA, Parker JE, Becker PJ, Katz IJ. Estimating glomerular filtration rate in black South Africans by use of the Modification of Diet in Renal Disease and Cocker oft-Gault equations. Clin Chem 2008;54(7):1197-1202. https://doi.org/10.1373/clinchem.2007.099085 [ Links ]
8. Van Deventer HE, Paiker JE, Katz IJ, George JA. A comparison of cystatin C- and creatinine-based prediction equations for the estimation of glomerular filtration rate in black South Africans. Nephrol Dial Transplant 2011;26(5):1553-1558. https://doi.org/10.1093/ndt/gfq621 [ Links ]
9. Stevens LA, Claybon MA, Schmid CH, et al. Evaluation of the Chronic Kidney Disease Epidemiology Collaboration equation for estimating the glomerular filtration rate in multiple ethnicities. Kidney Int 2011;79(5):555-562. https://doi.org/10.1038/ki.2010.462 [ Links ]
10. Madala ND, Nkwanyana N, Dubula T, Naiker IP. Predictive performance of eGFR equations in South Africans of African and Indian ancestry compared with 99mTc-DTPA imaging. Int Urol Nephrol 2011;44(3):847-855. https://doi.org/10.1007/s11255-011-9928-7 [ Links ]
11. Moodley N, Hariparshad S, Peer F, Gounden V. Evaluation of the CKD-EPI creatinine based glomerular filtration rate estimating equation in black African and Indian adults in KwaZulu-Natal, South Africa. Clin Biochem 2018;59:43-49. https://doi.org/10.1016/j.clinbiochem.2018.06.014 [ Links ]
12. Statistics South Africa. Mid-year population estimates, 2018. Statistical release P0302. Pretoria. Stats SA, 2018. http://www.statssa.gov.za/?page_id=1854&PPN=P0302&SCH=7362 (accessed 7 February 2019). [ Links ]
13. Statistics South Africa. Census 2011. Statistical release P0301.4. Pretoria. Stats SA, 2012. https://www.google.com/url?sa=t&rct=j&q=&esrc=s&source=web&cd=3&ved=2ahUKEwj9sfyzy4rnAhWyURUIHanVB-IQFjACegQIARAB&url=https%3A%2F%2Fwww.statssa.gov.za%2Fpublications%2FP03014%2FP030142011.pdf&usg=AOvVaw31vxy_oSdHFEAD2sbljzgQ (accessed 7 February 2019). [ Links ]
14. De Wit E, Delport W, Rugamika CE, et al. Genome-wide analysis of the structure of the South African coloured population in the Western Cape. Hum Genet 2010;128(2):145-153. https://doi.org/10.1007/s00439-010-0836-1 [ Links ]
15. Matsha TE, Yako YY, Rensburg MA, Hassan MS, Kengne AP, Erasmus RT. Chronic kidney diseases in mixed ancestry South African populations. Prevalence, determinants and concordance between kidney function estimators. BMC Nephrol 2013;14(1):75. https://doi.org/10.1186/1471-2369-14-75 [ Links ]
16. Adeniyi AB, Laurence CE, Volmink JA, Davids MR. Prevalence of chronic kidney disease and association with cardiovascular risk factors among teachers in Cape Town, South Africa. Clin Kidney J 2017;10(3):363-369. https://doi.org/10.1093/ckj/sfwl38 [ Links ]
17. Fleming JS, Zivanovic MA, Blake GM, Burniston M, Cosgriff PS. Guidelines for the measurement of glomerular filtration rate using plasma sampling. Nucl Med Commun 2004;25(8):759-769. https://doi.org/10.1097/01.mnm.0000136715.71820.4a [ Links ]
18. Chantler C, Garnett ES, Parsons V, Veali N. Glomerular filtration rate measurement in man by the single injection methods using 51Cr-EDTA. ClinSci 1969,37(1):169-180. [ Links ]
19. Haycock GB, Schwartz GJ, Wisotsky DH. Geometric method for measuring body surface area: A height-weight formula validated in infants, children, and adults. J Pediatr 1978;93(1):62-66. https://doi.org/10.1016/S0022-3476(78)80601-5 [ Links ]
20. Bröchner-Mortensen J. A simple method for the determination of glomerular filtration rate. Scand J Clin Lab Invest 1972;30(3):271-274. https://doi.org/10.3109/00365517209084290 [ Links ]
21. Bröchner-Mortensen J, Haahr J, Christoffersen J. A simple method for accurate assessment of the glomerular filtration rate in children. Scand J Clin Lab Invest 1974;33(2):139-143. [ Links ]
22. Bland JM, Altman D. Statistical methods for assessing agreement between two methods of clinical measurement. Lancet 1986;327(8476):307-310. https://doi.org/10.1016/S0140-6736(86)90837-8 [ Links ]
23. Stevens LA, Coresh J, Feldman HI, et al. Evaluation of the modification of diet in renal disease study equation in a large diverse population. J Am Soc Nephrol 2007;18(10):2749-2757. https://doi.org/10.1681/ASN.2007020199 [ Links ]
24. Stevens LA, Coresh J, Greene T, Levey AS. Assessing kidney function - measured and estimated glomerular filtration rate. N Engl J Med 2006;354(23):2473-2483. https://doi.org/10.1056/NEJMra054415 [ Links ]
25. Holness JL, Fleming JS, Chirehwa MT, Warwick JM. Propagation of measurement errors in glomerular filtration rate determination. A comparison of si ope-intercept, single-sample and si ope-only methods. Nucl Med Commun 2019;40(4):333-342. https://doi.org/10.1097/MNM.0000000000000977 [ Links ]
26. Delanaye P, Cavalier E, Pottel H. Serum creatinine. Not so simple! Nephron 2017;136(4):302-308. https://doi.org/10.1159/000469669 [ Links ]
27. Stevens LA, Schmid CH, Greene T, et al. Comparative performance of the CKD Epidemiology Collaboration (CKD-EPI) and the Modification of Diet in Renal Disease (MDRD) study equations for estimating GFR levels above 60 mL/min/1.73 m2. Am J Kidney Dis 2010;56(3):486-495. https://doi.org/10.1053/j.ajkd.2010.03.026 [ Links ]
28. Perrone RD, Madias NE, Levey AS. Serum creatinine as an index of renal function. New insights into old concepts. Clin Chem 1992;38(10):1933-1953. [ Links ]
 Correspondence:
J L Holness
jen.holness@uct.ac.za
Accepted 15 July 2019

