


Servicios Personalizados
Articulo
 Inglés (pdf)
 Articulo en XML
 Referencias del artículo
Indicadores

Links relacionados
-
 Citado por Google
 -
 Similares en Google
Compartir

 Permalink
SAMJ: South African Medical Journal
versión On-line ISSN 2078-5135
versión impresa ISSN 0256-9574
SAMJ, S. Afr. med. j. vol.109 no.12 Pretoria dic. 2019
http://dx.doi.org/10.7196/samj.2019.v109i12.13895
RESEARCH
Descriptive analysis of World Health Organization-recommended second-line antiretroviral treatment: A retrospective cohort data analysis
S B GumedeI, II; A FischerIII; W D F VenterIV; S T Lalla-EdwardV
IMSc; Ezintsha, a sub-division of Wits Reproductive Health and HIV Institute, University of the Witwatersrand, Johannesburg, South Africa
IIMSc; Public Health, Department of Interdisciplinary Social Science, Utrecht University, The Netherlands
IIIMPH; Ezintsha, a sub-division of Wits Reproductive Health and HIV Institute, University of the Witwatersrand, Johannesburg, South Africa
IVPhD, FCP (SA); Ezintsha, a sub-division of Wits Reproductive Health and HIV Institute, University of the Witwatersrand, Johannesburg, South Africa
VPhD; Ezintsha, a sub-division of Wits Reproductive Health and HIV Institute, University of the Witwatersrand, Johannesburg, South Africa
ABSTRACT
BACKGROUND. World Health Organization guidelines recommend that HIV patients who do not achieve viral suppression on efavirenz-based first-line antiretroviral therapy (ART) should be changed to a protease inhibitor (Pl)-based regimen. In South Africa (SA), -200 000 people are on second-line treatment, but little is known about these patients.
OBJECTIVES. To describe second-line black African patients in a large urban area.
METHODS. A quantitative retrospective study of 825 second-line patients in central Johannesburg, SA (subdistrict F), was performed with data extracted from government databases. Demographic characteristics, treatment status and laboratory information were gathered, then analysed with CD4+ cell count, viral load (VL) and retention-in-care data as outcome variables.
RESULTS. The average recorded time to VL measurement after the switch to a Pi-based ART regimen was 20 months, and 83.1% (570/686) of patients with a recent VL achieved viral suppression while on second-line treatment. The most recent median CD4+ cell count for the cohort was 286 cells/uL (interquartile range 160 - 478), which represented a 177 cells/uL increase from the baseline count at the start of first-line ART. Slightly less than three-quarters (72.4%) of the population remained active in care in the study clinics from initiation on first-line ART. Demographic characteristics such as being <25 years of age, male sex and geographical transfer (started initial treatment in a different region) independently predicted low CD4+ cell counts and virological failure on second-line treatment. Patients with virological failure were most likely (odds ratio (OR) 3.13, 95% confidence interval (CI) 1.50 - 6.56) to be lost to follow-up after the switch, while patients from Hillbrow Community Health Centre (OR 0.27, 95% CI 0.16 - 0.44), South Rand Hospital (OR 0.24, 95% CI 0.12 - 0.47) and Jeppe Clinic (OR 0.38, 95% CI 0.16 - 0.88), three larger sites, were most likely to remain active in care.
CONCLUSIONS. VL suppression was high in patients on second-line treatment, but one-fifth of patients were lost to follow-up. Younger age, male sex and transfer from other treatment sites predicted poor treatment outcomes, highlighting opportunities for prioritisation of adherence interventions.
South Africa (SA) has the world's highest HIV burden, with 7.52 million people (13.1% of the world's HIV population) living with HIV. However, AIDS-related deaths and new HIV infections have both been reduced by approximately half since 2004.[1] A national antiretroviral therapy (ART) programme provides free medication to -4.4 million people living with HIV[2] The goals of ART are to prolong life expectancy, decrease opportunistic illnesses and improve quality of life, while also preventing transmission of the virus. These goals are achieved by suppressing the HIV viral load (VL), allowing restoration of immune function, as measured partly by increasing CD4+ cell counts.[3,4]
Since 2012, all HIV-positive patients in SA have commenced treatment with a preferredfirst-line fixed-dose combination regimen of efavirenz/tenofovir/emtricitabine (EFV/TDF/FTC).[5,7] This treatment regimen is favoured because of its tolerability, simplicity and cost-effectiveness, but it provides a low barrier for resistance, which results in treatment failure for a proportion of patients.[8] Patients who experience virological failure (VL >1 000 copies/mL) on at least two occasions 2 months apart are offered second-line treatment containing protease inhibitors (Pis), in accordance with local guidelines.'71 Although the exact transfer rates are unknown, it is estimated that there are almost 200 000 second-line patients in SA.[5,9]
This progression from first- to second-line treatment is in accordance with World Health Organization (WHO) guidelines.[10] Up to 30% of second-line patients still experience virological failure in some SA cohorts.[11] Second-line treatment is complex, involving numerous tablets with substantial toxicity and twice-daily dosing. However, there are limited studies that explore second-line treatment outcomes.[8,12,13] Little is known about the long-term clinical outcomes of second-line patients. This study followed a large second-line cohort in Johannesburg, while also identifying demographic characteristics and laboratory and clinical factors that predict virological failure, which may allow for future targeted adherence and support interventions.
Methods
Study design
This retrospective cohort study used the TIER.Net database for secondary data on adult second-line patients. TIER.Net is the ART monitoring and evaluation system used by the SA National Department of Health for recording HIV, pre-ART, ART and tuberculosis (TB) patient-level information including HIV diagnosis dates, HIV results, ART start dates, ART switch dates, HIV/TB co-infection, treatment retention, VL and CD4+ cell count results. Second-line patients were defined as patients who experienced virological failure (VL >1 000 copies/mL) on at least two occasions 2 months apart and were then switched to a Pi-based regimen.
Setting
Records were reviewed for all ART patients from eight public health facilities in central Johannesburg (subdistrict F). The facilities were two hospitals, one community health centre (CHC) and five primary healthcare clinics.
Data collection
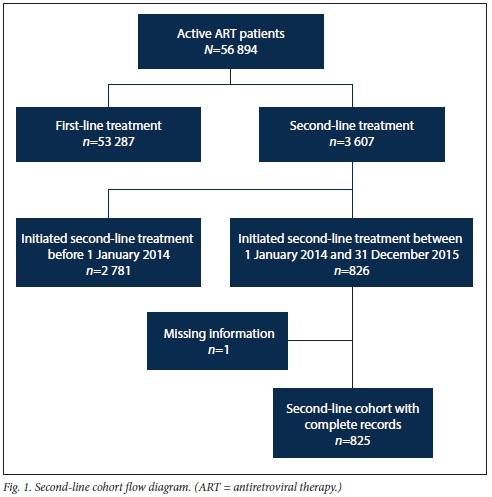
The total cohort of 825 represented all patients from the facilities who initiated their second-line treatment between 1 January 2014 and 31 December 2015. This cut-off period was chosen to give the cohort patients a minimum of 1 year to receive their annual standard-of-care VL test. In order to isolate this cohort, data were extracted from the TIER.Net database for all patients active on ART (N=56 894). A total of 53 287 patients on first-line treatment were then excluded, leaving a total of 3 607 active patients on second-line treatment. Of these second-line patients, 2 781 were excluded because they initiated their second-line treatment before 1 January 2014. Of the remaining 826 patients who met the inclusion criteria, one had missing information and was omitted, and the remaining 825 were followed until data collection ended in July 2017. The participant flow diagram is shown in Fig. 1.
All data were exported from TIER.Net to Excel 2016 Professional Plus (Microsoft, USA), where data were cleaned and formatted. The following variables were extracted for further analysis: treatment facility, gender, date of birth, age at ART switch, ART start date, second-line treatment start date, baseline ART regimen, baseline CD4+ cell count at start of ART, most recent CD4+ cell count (after ART switch), most recent VL (after ART switch), and retention-in-care status.
CD4+ cell counts were presented in four ranges for values <500 cells/uL and as a single category for all values >500 cells/uL. Since this cohort started ART before 2017, the CD4+ cell count disaggregation reported here was guided by the WHO guidelines.[14-16] VL was categorised into suppressed or unsuppressed based on the WHO threshold for suppression of <1 000 copies/mL.[7,17] Retention-in-care status was assessed as at 31 July 2017, and categorised into active in care (AIC), lost to follow-up (LTFU), transferred out (moved outside a facility included in the analysis), or known to be dead.
The datasets analysed during the study are available from the corresponding author (SBG) on reasonable request.
Data analysis
Data from the Excel spreadsheets were exported to Stata version 15.1 (StataCorp, USA) for analysis. Continuous data were summarised using medians (and interquartile ranges where appropriate) and then grouped into categories to define demographic characteristics. Three outcome variables, CD4+ cell count levels, VL and retention-in-care status, were quantified at the cohort level, then analysed further to identify associations between outcome variables and selected demographic characteristics with Pearson's χ2 tests. Furthermore, multiple logistic regression models were built for the outcome variables to identify independent predictors. These predictors were reported as unadjusted and adjusted odds ratios (ORs), with 95% confidence intervals (CIs) and p-values; p<0.05 was considered significant. Survival analysis (for the LTFU category) was conducted using the Kaplan-Meier estimator to understand the pattern of attrition.
Ethical considerations
Ethical clearance was received from the University of the Witwatersrand Human Research Ethics Committee (ref. no. Μ170691). In addition, approval was granted by the Johannesburg Health District (ref. no. 2017-08-003) and the National Health Research Database (ref. no. GP_201708_030).
Results
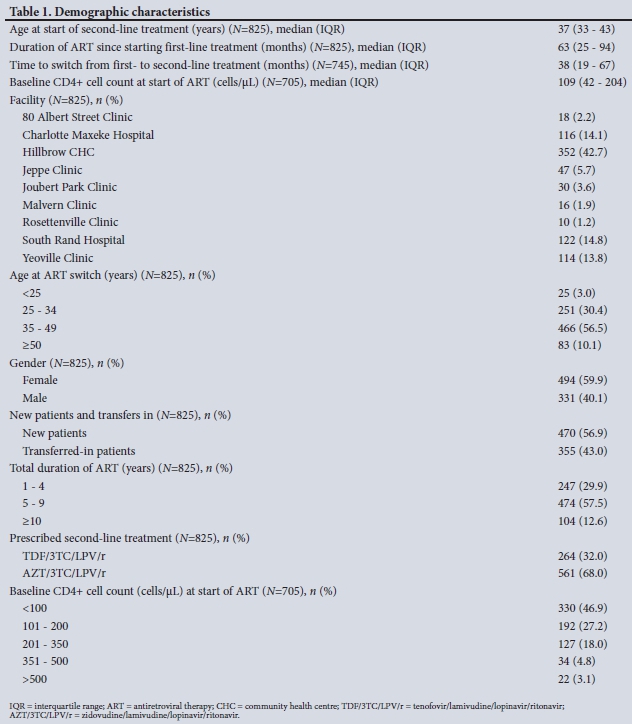
Demographic profile (Table 1)
At the start of first-line ART, the cohort had an average baseline CD4+ count of 109 cells/uL, and 59.9% of the patients were female. The median age at the start of second-line treatment was 37 years, the median duration of first-line ART was 63 months, and patients switched from first-line to second-line treatment after 38 months on average. Zidovudine/ lamivudine/lopinavir/ritonavir (AZT/3TC/ LPV/r) was the most common second-line antiretroviral, with 68.0% of the cohort on this combination. The other 32.0% were on tenofovir/lamivudine/lopinavir/ritonavir (TDF/3TC/LPV/r).
For the cohort, a single site (Hillbrow CHC) provided 352 (42.7%) of patients, while Charlotte Maxeke Johannesburg Academic Hospital, South Rand Hospital and Yeoville Clinic were the only other facilities that provided more than 100 patients. Just under half of the patients had been transferred to their current treatment facilities from outside subdistrict F, while the other 56.9% were new patients who had commenced treatment in subdistrict F.
Outcome variables
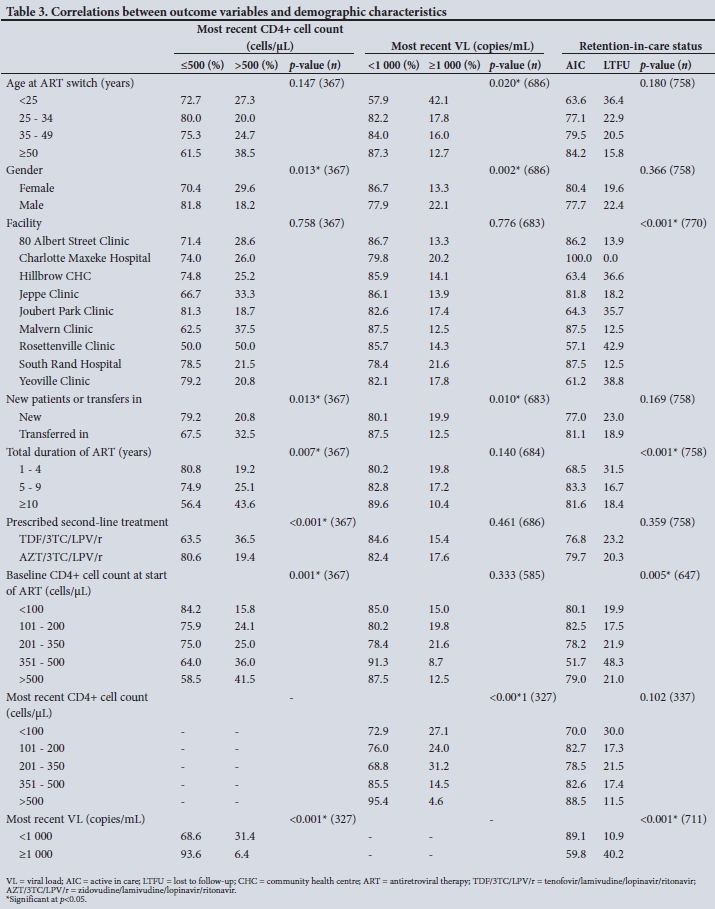
A summary of the cohort outcome variables is set out in Table 2. In order to evaluate predictors for the three outcome variables, CD4+ cell count, VL and retention-in-care status, correlations were explored with different demographic characteristics.
Gender, new v. transferred-in patients, total duration of ART, second-line regimen, baseline CD4+ cell count at ART start and most recent VL were all correlated with the CD4+ cell count outcome. Age at ART switch, gender, new v. transferred-in patients (patients who were now on second-line treatment in subdistrict F, but started their initial treatment in a different region) and most recent CD4+ cell count were all correlated with VL outcomes, while facility, duration of ART, baseline CD4+ cell count at start of ART and most recent VL were all significantly correlated with retention-in-care status outcomes. The Pearsons χ2 values are presented in Table 3, and to ensure that there were no affirmative confounders, all variables underwent further logistical analysis with ORs and adjusted ORs.
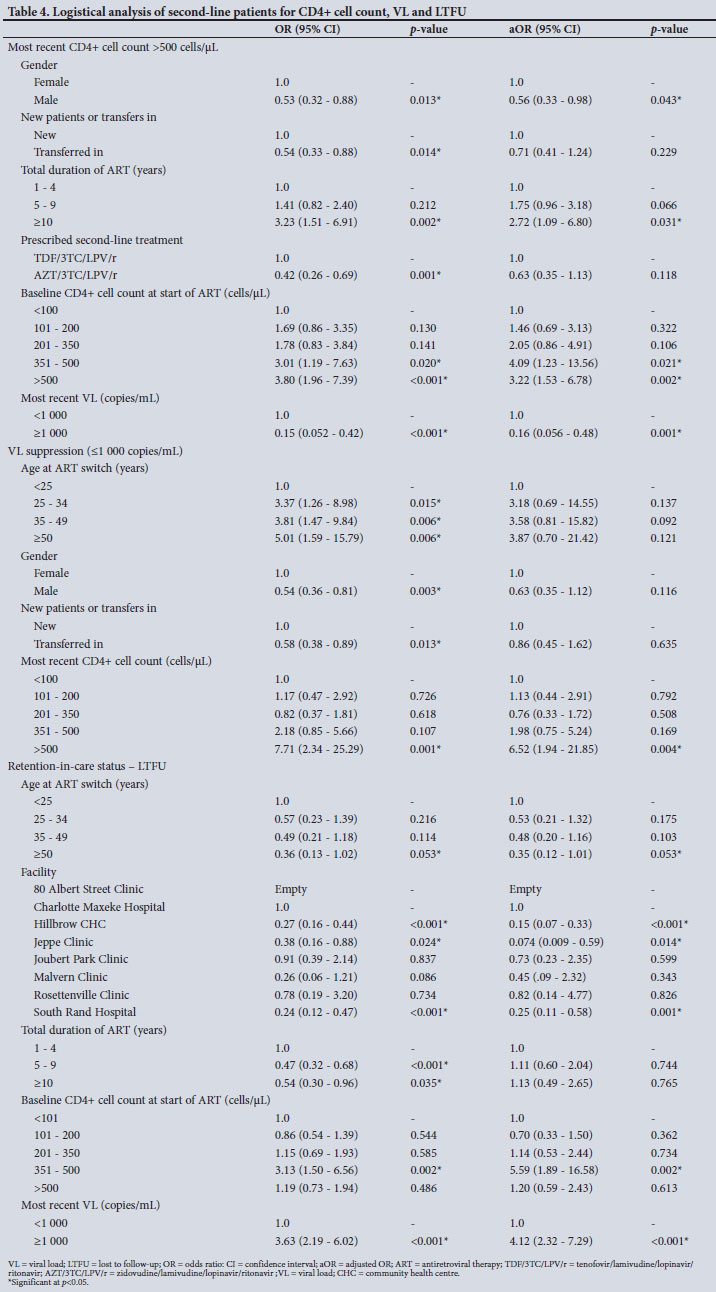
One affirmative confounder was identified (age at ART switch and retention-in-care status) and added to the statistically significant correlations, which are presented in Table 4.
CD4+ cell count
For the cohort, the most recent median CD4+ cell count was 286 cells/uL, which represented a 177 cells/uL (270%) increase from the 109 cells/uL baseline count at the start of ART. Of the patients, 132 (22.5%) achieved healthy CD4+ cell counts >500 cells/uL, whereas only 22 (3.1%) were above this threshold with their baseline CD4+ cell counts.
Males (OR 0.53, 95% CI 0.32 - 0.88) and patients transferred in to their current ART facility (OR 0.54, 95% CI 0.33 - 0.88) were both less likely to have a CD4+ cell count >500 cells/uL at last measurement than females and new patients, respectively. Patients taking AZT/3TC/ LPV/r as their regimen were also less likely (OR 0.42, 95% CI 0.26 -0.69) to have a CD4+ cell count >500 cells/uL than patients taking TDF/3TC/LPV/r. Patients who had been on ART for at least 10 years were more likely to achieve CD4+ cell counts >500 cells/uL than patients who had been on ART for <4 years, with an OR of 3.23 (95% CI 1.51 -6.91). Patients with virological failure on second-line treatment (OR 0.15, 95% CI 0.052 - 0.42) were less likely to achieve CD4+ cell counts >500 cells/uL than virologically suppressed patients.
VL suppression
The average time (based on VL dates included in patient records) to VL measurement after ART switch was 20 months, and the most recent median VL was 124 copies/mL. A total of 570 patients (83.1%) achieved viral suppression based on the 1 000 copies/mL threshold.
VL suppression was less likely in male patients than in females (OR 0.54, 95% CI 0.36-0.81) and in patients transferred from ART facilities outside subdistrict F (OR 0.58, 95% CI 0.38 - 0.89). Suppression was also directly related to age at ART switch, with the oldest group (patients aged >50 years) far more likely to achieve viral suppression than the youngest group (<25 years) (OR 5.01, 95% CI 1.59 - 15.79).
Retention-in-care status
As a cohort, 597 patients (72.4%) remained AIC until data collection ended in July 2017. Of the outstanding patients, 161 (19.5%) were lost to follow-up, while 59 (7.2%) were transferred or moved out of subdistrict F, and 8 (1.0%) died. Total duration of ART was a significant predictor of retention-in-care status, as patients on ART for 5-9 years (OR 0.47, 95% CI 0.32 - 0.68) and >10 years (OR 0.54, 95% CI 0.30 - 0.96) were approximately twice as likely to remain AIC for the duration of the study as those on ART for <5 years. Age at ART switch showed that patients aged >50 years (OR 0.36, p=0.053) were most likely to be retained in care.
Three facilities, Hillbrow CHC (OR 0.27, 95% CI 0.16 - 0.44), Jeppe Clinic (OR 0.38, 95% CI 0.16 - 0.88) and South Rand Hospital (OR 0.24, 95% CI 0.12 - 0.47) were less likely than the others to have patients lost to follow-up. Patients with virological failure on second-line treatment were almost four times (OR 3.63, 95% CI 2.19 - 6.02) more likely to be lost to follow-up than virologically suppressed patients. Patients with baseline CD4+ cell counts between 351 and 500 cells/^L at the start of ART were three times (OR 3.13, 95% CI 1.50 -6.56) more likely to be lost to follow-up than patients with a CD4+ cell count < 101 cells/ μί. No other baseline CD4+ cell count categories or most recent CD4+ cell counts were significant predictors of retention-in-care status.
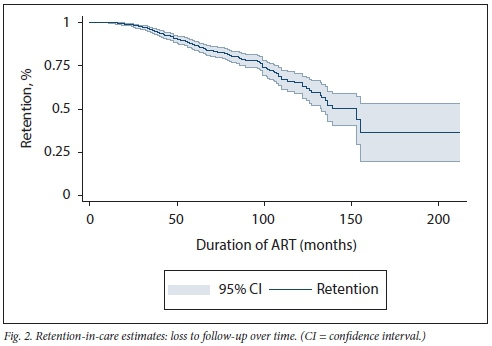
Survival analysis (Fig. 2) shows an expected decrease in patient retention in care. However, the drop becomes steadier from month 100 (just over 8 years on treatment) and declines sharply at month 150 (12.5 years on treatment).
Discussion
Global intentions for successful scaling up of ART include ensuring that 90% of all patients receiving WHO-endorsed ART are retained in care with suppressed VLs.[18] Switching treatment-failing patients from first-line to second-line regimens has been policy in the SA public health setting since inception of the ART programme in 2004.However, not much has been done to describe the long-term clinical outcomes of second-line cohorts,[19] particularly in this setting, highlighting the value of our findings. Patients starting second-line treatment tended to have low CD4+ cell counts, but 83.1% of our cohort showed viral suppression after switching from first-line treatment, demonstrating similar suppression rates to historical first-line treatment (85% suppression rate) in Johannesburg subdistrict E[20] The low CD4+ cell counts despite viral suppression could be indicative of slow CD4+ cell count recovery.[21] Just under three-quarters (72.4%) of our patients remained in care in the study sites over the reported period. The remaining 27.6% were no longer receiving care at the study sites (i.e. transferred out), were lost to follow-up or died. This is slightly lower than the reported retention rate of 78% in a first-line treatment cohort from inner-city Johannesburg.[22]
Recent VL suppression and recent CD4+ cell counts >500 cells/ μL were both correlated with a number of independent variables: males and transferred-in patients both had lower CD4+ cell counts and greater virological failure. Patients on TDF/3TC/LPV/r and patients with long durations of ART were correlated with CD4+ cell counts >500 cells/μL, but they did not show any statistically significant relationships with VL suppression. Age at ART switch did, however, show a strong stepwise correlation with virological failure, with patients aged 25 - 34 years, 35 - 50 years and >50 years each increasingly more likely to achieve viral suppression than patients aged <25 years.
There was also a correlation between age at ART switch and retention-in-care status, as patients >50 years of age were more likely to remain AIC. This is in keeping with recent findings from Kenya that older ART patients were more likely to remain in care than younger patients,[23] and older pooled Kenyan, Tanzania Mozambican and Rwandan data.[24] Only three facilities, Hillbrow CHC, Jeppe Clinic and South Rand Hospital, were strongly associated with raised AIC rates. These findings are consistent with various reports released between 2014 and 2018 that described these three facilities, together with a few others in the Johannesburg metropolitan municipality, as providing high standards of care, their patients having comparatively short waiting times and good clinical support services (within facilities and from external health systems-strengthening support partners) in terms of implementation of clinical guidelines and leadership.[25-27] Ensuring quality of care, a sufficient space to provide ART services and shorter waiting times for ART patients have long been associated with patient retention and adherence to treatment. [28, 29] Additionally, these findings demonstrate effective task shifting of ART services within the healthcare facilities and decentralisation of services between primary and higher levels of care (secondary and tertiary),[29-31] as well as out of the facility (e.g. Hillbrow CHC runs adherence clubs for stable, adherent ART patients). These three facilities could therefore be identified as providing models in terms of retention in care and adherence to treatment for other health facilities to follow.
Patients with baseline CD4+ cell counts at the start of ART of 351 - 500 cells/uL were approximately three times more likely to be lost to follow-up than patients with CD4+ cell counts <100 cells/uL. It could be assumed that since patients with low CD4+ cell counts are at an increased risk of opportunistic infections and other HIV-related complications, and of experiencing drug toxicity related to ART and HIV complications, they tend to remain in HIV care because they are ill and/or accessing care for multiple illnesses.[32-34] Patients who have been on ART for >5 years are -50% less likely to be lost to follow-up than patients in their first 4 years of treatment. This evidence provides an opportunity for engaging patients from treatment initiation by providing additional support and counselling to ensure that they remain engaged throughout their treatment span.[35] Support and counselling benefits have been reported in first-line treatment cohorts where similar retention-in-care patterns were identified. [35,36]
Mberi et al.[36]described a group receiving care from 2002 to 2012 at a high-volume SA ART clinic. They reported 40% of the patients being LTFU within 12 months of starting ART, a slight subsequent decrease in retention, a sharp decline from year 5, and plateauing at year 8. Our group displayed better long-term retention, with the initial sharp decline only being seen at year 8 and plateauing halfway through year 12. Patient and programme monitoring, actively implementing adherence and retention programmes, better-quality service delivery (described above) and possible improved accountability on the part of patients may have resulted in these slightly enhanced retention rates. The implication is that aggressively enforcing adherence and retention strategies will lead to better clinical outcomes and higher retention-in-care rates.
Study limitations
The analysis was performed for a limited number of facilities in one SA district and may not necessarily be generalisable to all the other districts. Owing to inconsistencies in data quality from TIER.Net it was difficult to accurately calculate time to second-line treatment from the exact time of treatment failure, as well as the time to suppression data. A standard VL result of 124 copies/mL is captured into TIER.Net for patients who have a laboratory result reported as lower than detectable level (instead of actual values). This affects the calculated median and interquartile range values.
Conclusions
Our study described the long-term clinical outcomes of second-line patients and identified demographic, laboratory and clinical factors that predicted virological failure in this group. The patients in this cohort did well virologically after switching to second-line therapy although poorer outcomes remain an issue, especially among younger and male patients. The study also identified transfer of patients and patients on AZT/3TC/LPV/r as subdemographics that were likely to be associated with poorer laboratory outcomes. All these are easily identifiable factors that may trigger added adherence and support interventions including intensive patient engagement during the first few years of ART, targeted population-specific adherence support programmes, using mobile health solutions for patient communication and appointment reminders, prioritising male and youth-friendly ART adherence and retention initiatives, and implementing a single patient identifier to accurately monitor patient and programme outcomes.
Declaration. Although this publication is not a direct requirement for degree purposes, this study provides formative information for SBG's doctoral project. As such, it will be included in the appendices of the doctoral thesis.
Acknowledgements. We thank all the facilities and relevant health and research authorities from the City of Johannesburg for allowing the Wits Reproductive Health and HIV Institute to engage in a partnership to strengthen health service delivery through technical assistance and research.
Author contributions. SBG and STL-E designed the study and supervised the data extraction at the facilities. SBG and STL-E analysed the data with assistance from WDFV. SBG interpreted the data and prepared the first draft of the manuscript, which was revised by STL-E, AF and WDFV All authors read and approved the final manuscript.
Funding. This study was embedded within the OPTIMIZE project. OPTIMIZE (AID-OAA-A-15-00069) is funded by the US Agency for International Development (USAID) under the US President's Emergency Plan for AIDS Relief (PEPFAR). This assistance is from the American people. The views expressed do not necessarily reflect the views of the US government. SBG was supported by the Consortium for Advanced Research Training in Africa (CARTA). CARTA is j ointly led by the African Population and Health Research Center and the University of the Witwatersrand and funded by the Carnegie Corporation of New York (grant no. Β 8606. R02), Sida (grant no. 54100113), the DELTAS Africa Initiative (grant no. 107768/Z/15/Z) and Deutscher Akademischer Austauschdienst. The DELTAS Africa Initiative is an independent funding scheme of the African Academy of Sciences Alliance for Accelerating Excellence in Science in Africa and supported by the New Partnership for Africa's Development Planning and Coordinating Agency with funding from the Wellcome Trust (UK) and the UK government. The statements made and views expressed are solely the responsibility of the Fellow
Conflicts of interest. None.
References
1. Statistics South Africa. Mid-year population estimates 2018. Statistical release P0309.3. Pretoria. Stats SA, 2018. http://ww.statssa.gov.za/publications/P0302/P03022018.pdf (accessed 3 December 2018). [ Links ]
2. Human Sciences Research Council. South African National HIV Prevalence, Incidence, Behaviour and Communication Survey, 2017. http://www.hsrcac.za/uploads/pageContent/9234/FINAL%20Presentation%20for%2017%20July%201aunch.pdf (accessed 9 January 2019). [ Links ]
3. Burton R, Giddy J, Stinson K. Prevention of mother-to-child transmission in South Africa. An ever-changing landscape. Obstet Med 2015;8(1).5-12. https://doi.org/10.1177/1753495X15570994 [ Links ]
4. Barron P, Pillay Y, Doherty T, et al. Eliminating mother-to-child HIV transmission in South Africa. Bull World Health Organ 2013;1:70-74. https://doi.org/10.2471/BLT.12.106807 [ Links ]
5. Venter WF, Kaiser B, Pillay Y, et al. Cutting the cost of South African antiretroviral therapy using newer, safer drugs. S Afr Med J 2016;107(1).28-30. https://doi.org/10.7196/SAMJ.2016.vl07.il.12058 [ Links ]
6. Meyer-Rath G, Johnson LF, Pillay Y, et al. Changing the South African national antiretroviral therapy guidelines. The role of cost modelling. PLoS One 2017;12(10).1-15. https://doi.org/10.1371/journal.pone.0186557 [ Links ]
7. National Department of Health, South Africa. South African Antiretroviral Treatment Guidelines (Adult) 2015. http://www.micuct.ac.za/sites/default/ffies/image_tool/images/51/MIC_Poster_Adult_2015_No%20Logo.pdf (accessed 9 January 2019). [ Links ]
8. Onoya D, Nattey C, Budgeli E, et al. Predicting the need for third-line antiretroviral therapy by identifying patients at high risk for failing second-line antiretroviral therapy in South Africa. AIDS Patient Care STDS 2017;31(5):205-212. https://doi.org/10.1089/apc.2016.0291 [ Links ]
9. Joint United Nations Programme on HIV and AIDS (UNAIDS). Ending AIDS-. Progress towards the 90-90-90 targets. Global AIDS Update 2017. https://www.unaids.org/en/resources/documents/2017/20170720_Global_AIDS_update_2017 (accessed 9 October 2019). [ Links ]
10. World Health Organization. Clinical guidance across the continuum of care. Antiretroviral therapy 2013. https://www.who.int/hiv/pub/guidelines/arv2013/art/arv2013_chapter07_lowpdf?ua=l (accessed 9 January 2019). [ Links ]
11. BarnettW, Patten G,Kerschberger B, et al Perceived adherence barriers amongpatientsfailing second-line antiretroviral therapy in Khayelitsha, South Africa. South Afr J HIV Med 2013;14(4):170-176. https://doi.org/10.7196/SAJHTVMED.981 [ Links ]
12. Murphy RA, Court R, Maartens G, Sunpath H. Second-line antiretroviral therapy in sub-Saharan Africa: Its time to mind the gaps. AIDS Res Hum Retroviruses 2017;33(12).1181-1184. https://doi.org/10.1089/aid.2017.0134 [ Links ]
13. Rohr JK, Ive P, Horsburgh RC, et al. Marginal structural models to assess delays in second-line HIV treatment initiation in South Africa. PLoS One 2016;11(8).1-11. https://doi.org/10.1371/journal.pone.0161469 [ Links ]
14. World Health Organization. Consolidated guidelines on the use of antiretroviral drugs for treating and preventing HIV infection. Recommendations for a public health approach. 2013. https://www.who.int/hiv/pub/guidelines/arv2013/download/en/ (accessed 9 October 2019). [ Links ]
15. World Health Organization. March 2014 supplement to the 2013 Consolidated Guidelines on the Use of Antiretroviral Drugs for Treating and Preventing HIV Infection. 2014. https://apps.who.int/iris/bitstream/handle/10665/104264/9789241506830_eng.pdf,jsessionid=16F90596A18C3F58BB2490AF (accessed 9 January 2019). [ Links ]
16. World Health Organization. Consolidated Guidelines on the Use of Antiretroviral drugs for Treating and Preventing HIV Infection. Recommendations for a Public Health Approach. Second edition. 2016. https://www.who.int/hiv/pub/arv/arv-2016/en/ (accessed 10 October 2019). [ Links ]
17. National Department of Health, South Africa. National Consolidated Guidelines for the Prevention of Mother-to-Child Transmission of HIV (PMTCT) and the Managment of HIV in Children, Adolescents and Adults. 2015. https://doi.org/10.1109/ICSE.2000.870489 (accessed 9 January 2019). [ Links ]
18. Joint United Nations Programme on HIV/AIDS (UNAIDS). 90-90-90. An ambitious treatment target to help end the AIDS epidemic Geneva. UNAIDS. 2014. https://www.unaids.org/sites/default/files/media_asset/90-90-90_en.pdf (accessed 9 January 2019). [ Links ]
19. Patrikar S, Subramaniam S, Vasudevan B, et al. Profile of HIV patients on second line antiretroviral therapy. The Indian experience. J AIDS Clin Res 2015;6.459. https://doi.org/10.4172/2155-6113.1000459 [ Links ]
20. Davey DJ, Abrahams Z, Feinberg Μ, et al. Factors associated with recent unsuppressed viral load in HIV-l-infected patients in care on first-line antiretroviral therapy in South Africa. Int J STD AIDS 2018;29(6).603-610. https://doi.org/10.1177/0956462417748859 [ Links ]
21. Engsig FN, Zangerle R, Katsarou O, et al. Long-term mortality in HIV-positive individuals virally suppressed for >3 years with incomplete CD4 recovery. Clin Infect Dis 2014;58(9).1312-1321. https://doi.org/10.1093/cid/ciu038 [ Links ]
22. Hirasen K, Evans D, Maskew M, et aL The right combination - treatment outcomes among HIV-positive patients initiating first-line fixed-dose antiretroviral therapy in a public sector HIV clinic in Johannesburg, South Africa. Clin Epidemiol 2018;10.17-29. https://doi.org/10.2147/CLEP.S145983 [ Links ]
23. Kiplagat J, Mwangi A, Keter A, et al. Retention in care among older adults living with HIV in western Kenya. A retrospective observational cohort study. PLoS One 2018;13(3).1-12. https://doi.org/10.1371/journal.pone.0194047 [ Links ]
24. Eduardo Ε, Lamb MR, Kandula S, et al. Characteristics and outcomes among older HIV-positive adults enrolled in HIV programs in four sub-Saharan African countries. PLoS One 2014;9(7).8-10. https://doi.org/10.1371/journal.pone.0103864 [ Links ]
25. Office of Health Standards Compliance (OHSC). Annual Inspection Report 2016/17. 2018. http://ohscorg.za/wp-content/uploads/OHSC-2016-17-ANNUAL-INSPECTION-REPORT.pdf (accessed 10 January 2019). [ Links ]
26. Gauteng Department of Health. Gauteng Department of Health Annual Report 2016/17. 2017. https://www.gauteng.gov.za/Publications/PublicationDetails?id=28272FlA-EA58-488D-A251-E6DBACACCDFC (accessed 10 October 2019). [ Links ]
27. National Department of Health, South Africa. DHIS Routine health data. Gauteng Province, https://gp.dhis.dhmis.org/dhis-web-pivot/# (accessed 10 January 2019). [ Links ]
28. World Health Organization. The InnovS approach for reviewing national health programmes to leave no one behind. 2016. http://apps.who.int/iris/bitstream/handle/10665/250442/9789241511391-eng.pdf?ua=l (accessed 9 January 2019). [ Links ]
29. Mukora R, Charalambous S, Dahab M, Hamilton R, Karstaedt A. A study of patient attitudes towards decentralisation of HIV care in an urban clinic in South Africa. BMC Health Serv Res 2011,11.205. https://doi.org/10.1186/1472-6963-11-205 [ Links ]
30. Fatti G, Grimwood A, Bock P. Better antiretroviral therapy outcomes at primary healthcare facilities. An evaluation of three tiers of ART services in four South African provinces. PLoS One 2015(9):e12888. https://doi.org/10.1371/journal.pone.0012888 [ Links ]
31. Rachlis B, Bakoyannis G, Easterbrook P, et al. Facility-level factors influencing retention of patients in HIV care in East Africa. PLoS One 2016,ll(8).e0159994. https://doi.org/10.1371/journal.pone.0159994 [ Links ]
32. Yehia BR, French B, Fleishman JA, et al. Retention in care is more strongly associated with viral suppression in HIV-infected patients with lower versus higher CD4 counts. J Acquir Immune Defic Syndr 2014;65(3):333-339. https://doi.org/10.1097/QAI.0000000000000023 [ Links ]
33. Mohammadpour A, Yekta ZP, Nikbakht Nasrabadi AR. HIV-infected patients1 adherence to highly active antiretroviral therapy. A phenomenological study. Nurs Health Sei 2010;12(4).464-469. https://doi.org/10.111l/j.1442-2018.2010.00560.x [ Links ]
34. Prosperi MCF, Fabbiani M, Fanti I, et al. Predictors of first-line antiretroviral therapy discontinuation due to drug-related adverse events in HIV-infected patients. A retrospective cohort study. BMC Infect Dis 2012,12.296. https://doi.org/10.1186/1471-2334-12-296 [ Links ]
35. Fox MP, Berhanu R, Steegen Κ, et al. Intensive adherence counselling for HIV-infected individuals failing second-line antiretroviral therapy in Johannesburg, South Africa. Trop Med Int Health 2016-,21(9).1131-1137. https://doi.org/10.1111/tmi.l2741 [ Links ]
36. Mberi MN, Kuonza LR, Dube NM, Nattey C, Manda S, Summers R. Determinants of loss to follow-up in patients on antiretroviral treatment, South Africa, 2004 - 2012. A cohort study. BMC Health Serv Res 2015*,15:259. https://doi.org/10.1186/sl2913-015-0912-2 [ Links ]
 Correspondence:
S Β Gumede
sgumede@wrhi.ac.za
Accepted 10 July 2019

