


Serviços Personalizados
Artigo
 Inglês (pdf)
 Artigo em XML
 Referências do artigo
Indicadores

Links relacionados
-
 Citado por Google
 -
 Similares em Google
Compartilhar

 Permalink
SAMJ: South African Medical Journal
versão On-line ISSN 2078-5135
versão impressa ISSN 0256-9574
SAMJ, S. Afr. med. j. vol.109 no.7 Pretoria Jul. 2019
http://dx.doi.org/10.7196/samj.2019.v109i7.13717
RESEARCH
doi:10.7196/samj.2019.v109i7.13717
Child mortality trends and causes of death in South Africa, 1997 - 2012, and the importance of a national burden of disease study
N N NannanI; P GroenewaldII; V Pillay-van WykIII; E NicolIII; W MsemburiIV; R E DorringtonV; D BradshawVI
IMSc, PhD; Burden of Disease Research Unit, South African Medical Research Council, Cape Town, South Africa
IIMB ChB, MPH; Burden of Disease Research Unit, South African Medical Research Council, Cape Town, South Africa
IIIPhD; Burden of Disease Research Unit, South African Medical Research Council, Cape Town, South Africa
IVMPhil; Department of Statistics, Faculty of Science, University of Cape Town, South Africa
VBCom, BSc Hons, BA, MPhil, FASSA; Centre for Actuarial Research, Faculty of Commerce, University of Cape Town, South Africa
VIMSc, DPhil; Burden of Disease Research Unit, South African Medical Research Council, Cape Town, South Africa
ABSTRACT
BACKGROUND: The Rapid Mortality Surveillance System has reported reductions in child mortality rates in recent years in South Africa (SA). In this article, we present information about levels of mortality and causes of death from the second SA National Burden of Disease Study (SA NBD) to inform the response required to reduce child mortality further
OBJECTIVES: To estimate trends in and causes of childhood mortality at national and provincial levels for the period 1997 - 2012, to highlight the importance of the SA NBD
METHODS: Numbers of registered child deaths were adjusted for under-reporting. Adjustments were made for the misclassification of AIDS deaths and the proportion of ill-defined natural causes. Non-natural causes were estimated using results from the National Injury Mortality Surveillance System for 2000 and the National Injury Mortality Survey for 2009. Six neonatal conditions and 11 other causes were consolidated from the SA NBD and the Child Health Epidemiological Reference Group lists of causes of death for the analysis. The NBD cause-fractions were compared with those from Statistics South Africa, the United Nations Children's Fund (UNICEF) and the Institute for Health Metrics and Evaluation (IHME
RESULTS: Under-5 mortality per 1 000 live births increased from 65 in 1997 to 79 in 2004 as a result of HIV/AIDS, before dropping to 40 by 2012. The neonatal mortality rate declined from 1997 to 2001, followed by small variations. The death rate from diarrhoeal diseases began to decrease in 2008 and the death rate from pneumonia from 2010. By 2012, neonatal deaths accounted for 27% of child deaths, with conditions associated with prematurity, birth asphyxia and severe infections being the main contributors. In 1997, KwaZulu-Natal, Free State, Mpumalanga and Eastern Cape provinces had the highest under-5 mortality, close to 80 per 1 000 live births. Mortality rates in North West were in the mid-range and then increased, placing this province in the highest group in the later years. The Western Cape had the lowest mortality rate, declining throughout the period apart from a slight increase in the early 2000s
CONCLUSIONS: The SA NBD identified the causes driving the trends, making it clear that prevention of mother-to-child transmission of HIV, the Expanded Programme on Immunisation and programmes aimed at preventing neonatal deaths need to be equitably implemented throughout the country to address persistent provincial inequalities in child deaths. The rapid reduction of childhood mortality since 2005 suggests that the 2030 Sustainable Development Goal target of 25 per 1 000 for under-5 mortality is achievable for SA. Comparison with alternative estimates highlights the need for cause-of-death data from civil registration to be adjusted using a burden-of-disease approach
Tracking child mortality and identifying its causes received prominence through the global initiative of the Millennium Development Goals (MDGs),[1] which has continued with the Sustainable Development Goals (SDGs).[2] In South Africa (SA), the 1996 census and the 1998 Demographic and Health Survey recorded a reversal of childhood mortality rates at the beginning of the 1990s, coinciding with an expected increase due to HIV/AIDS.[3] However, since then the paucity of sources of reliable estimates of child mortality and incomplete vital registration have made it difficult for the country to track this key indicator, leaving policymakers with limited information to guide interventions.[4] An investigation into the available data sources for measuring child mortality,[5] as well as a demographic analysis,[6] highlighted substantial improvements in the completeness of registration of child deaths between the mid-1990s and mid-2000s.
While the Rapid Mortality Surveillance System'[7] provides empirical estimates of childhood mortality to monitor trends in the level of childhood mortality, extensive misclassification of HIV/ AIDS as a cause of death,[8] together with other challenges with medical certification of cause,[9] make it impossible to use the cause-of-death information at face value. Recently, Bamford et al.[10] called for improved data on child deaths in SA. In addition, the second SA National Burden of Disease Study (SA NBD)[11] has confronted the data issues and provides estimates of the levels and causes of mortality for all ages for the period 1997 - 2012.
Objectives
In this article, we present the trends and causes of childhood mortality in SA and the differences between provinces, demonstrating the value of an NBD study in informing health policy.
Methods
Full details of the methods of the second SA NBD are outlined elsewhere.[11,12] Briefly, the study used Statistics South Africa (Stats SA) cause-of-death data for 1997 - 2012, adjusted for under-reporting of deaths.
These adjustments were derived from a comparison of registered deaths with those expected based on rates of infant and under-5 mortality estimated from various surveys and censuses. The SA NBD list of cause categories, comprising 140 specific causes of death within 24 disease categories and four broad-cause groups, was created using lists from the 2000 SA NBD[13] and the Global Burden of Disease studies[14,15] to reflect local cause-of-death patterns.
Misclassified HIV/AIDS deaths were identified by regressing excess mortality on a lagged indicator of HIV prevalence of pregnant women attending public antenatal clinics.[8] Specific causes for non-natural deaths were derived using results of a national mortuary survey[16] and a national injury surveillance system[17] with multivariate analysis. Garbage codes and ill-defined deaths were redistributed proportionally by age, sex and population/racial group.
The causes of death for children aged <5 years were then aggregated into a cause list adapted from one proposed by the Child Health Epidemiological Reference Group,[18] comprising six neonatal conditions and 11 other causes of death common in children.
Age-specific mortality rates were calculated from the adjusted number of deaths and estimates of the mid-year population,[19] using life-table methods[20] and an estimate of the years of life lived by babies who died in infancy of 0.157 years. The probabilities of death due to neonatal and postneonatal causes were estimated using the same denominator as used to estimate the probability of dying in the first year of life, equivalent to the infant mortality rate.
Cause-specific mortality of children aged <5 years was analysed using mortality rates, calculated by dividing the number of deaths for each cause by the under-5 population.
Bamford et al.[10] contrasted the cause of-death fractions for 2015 from the registered deaths reported by Stats SA[21] with estimates produced by the United Nations Children's Fund (UNICEF).[22] We compared the SA NBD estimates for 2012 with these profiles as well as estimates for SA in the 2015 Global Burden of Disease Study produced by the Institute for Health Metrics and Evaluation (IHME).[23] Cause groupings are broadly consistent across the studies, but nomenclature differs. In the SA NBD, the term 'injuries' is used for 'non-natural', 'diarrhoeal diseases' is used for 'intestinal infections' and 'gastroenteritis', 'HIV/AIDS' is used for 'HIV' and 'AIDS', and 'lower respiratory infections' is used for 'pneumonia' and 'influenza and pneumonia'.
Results
Age-specific mortality rates
Under-5 mortality per 1 000 live births increased between 1997 and 2004 from 65 to 79 before dropping to 40 by 2012 (Fig. 1).

Corresponding increases occurred in postneonatal and infant mortality, peaking 1 year earlier, and in child mortality. The neonatal mortality rate is estimated to have declined from 1997 to 2001, followed by an increase in 2002 and then a gradual decrease in the following years.
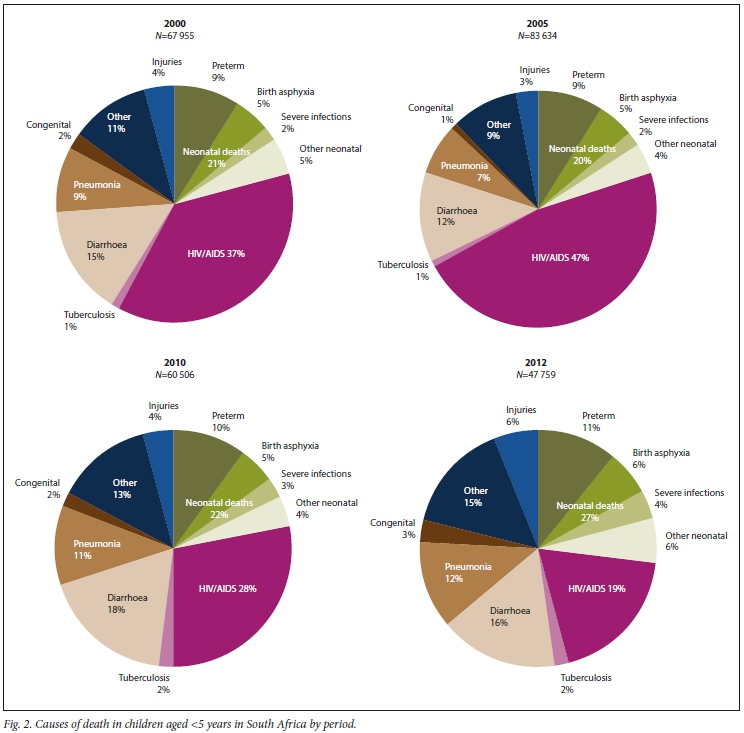
Cause-of-death profile
The cause-of-death profile is shown in Fig. 2 for selected years. The increase in the under-5 mortality rate was accompanied by a corresponding increase in the proportion of HIV/AIDS deaths (35% in 2000 to 47% in 2005), while the decrease in the rate was accompanied by a substantial drop of this proportion to 19% in 2012. By the end of the period, the proportion of deaths that were neonatal, with conditions associated with prematurity, birth asphyxia and severe infections being the main contributors, had risen from 21% to 27%.
Diarrhoea and pneumonia were persistent major causes of death among young children, but, as shown in Fig. 3, the death rate from diarrhoeal diseases began decreasing from 2008 and the death rate from pneumonia from 2011. The trend in the HIV/AIDS mortality rate was very similar in shape to that of the infant and under-5 mortality rate, peaking in 2004 and declining sharply thereafter. The rate of the combined category of other causes of death declined slightly after 2006, whereas the death rates from injuries, congenital abnormalities and tuberculosis were much lower, exhibiting little change over the period.

Comparison of the cause-of-death profile
The SA NBD cause-of-death profile is compared with registered deaths (Stats SA) and estimates produced by UNICEF and the IHME in Table 1. The SA NBD estimate of the total number of deaths of children aged <5 years in 2012 is considerably higher than the Stats SA number of registered deaths 3 years later. The SA NBD estimate of the total number is 12% and 11% higher than the UNICEF and IHME, respectively, 3 years later. In terms of the cause profile, apart from the 15% of Stats SA's deaths which the other studies have reallocated, there appears to be little agreement on TB and HIV/AIDS (even in combination), diarrhoeal diseases and pneumonia. While there is reasonable agreement, particularly between the two burden of disease studies (SA NBD and IHME), there are differences in the estimates of congenital, injuries and deaths combined in the group 'other'.
Provincial differences in trends and causes
The under-5 mortality rate differs for the nine provinces (Fig. 4). KwaZulu-Natal, Free State, Mpumalanga and Eastern Cape had the highest rates at the beginning of the period, with levels close to 80 per 1 000 live births. These increased to levels >100 per 1 000 live births in 2004, after which the rates fell to close to half that level by 2012.
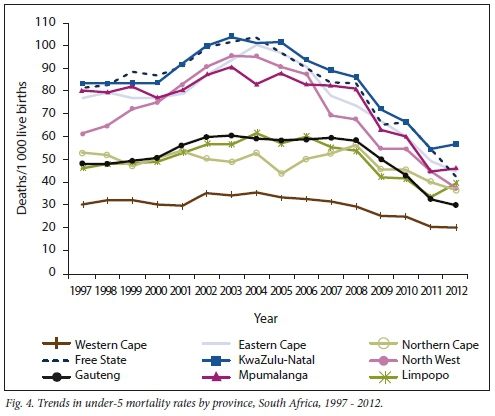
Under-5 mortality rates in North West were in the mid-range in 1997 and then increased rapidly, placing this province in the highest group in the later years. Gauteng, Northern Cape and Limpopo provinces increased slightly over the period, but also declined from 2008 (2006 in the case of Limpopo).
The Western Cape had the lowest under-5 mortality rate throughout the period, with only a slight increase from 2001 to 2002, after which it declined gradually.
The provincial profiles of the causes of deaths of children aged <5 years show considerable variation between provinces (Fig. 5). The proportion of deaths due to HIV/AIDS in 2012 ranged from <15% in the Western Cape, Gauteng, Free State and Mpumalanga to 25% in KwaZulu-Natal and Limpopo. Deaths from diarrhoeal disease accounted for a high proportion of the child deaths in Mpumalanga (24%). Deaths in the neonatal period ranged from 20 - 21% in the Eastern Cape and Limpopo to 36% in the Northern Cape and Western Cape, in both of which prematurity accounted for relatively high proportions.

Discussion
The impact of HIV/AIDS on childhood mortality in SA has been profound, accounting for a rapid increase in the level of mortality at a time during which there might have been a decreasing trend had there not been an HIV/AIDS epidemic.
However, the present study shows that this trend of increasing mortality reversed from 2003 among post-neonatal infants and from 2004 among the 1 - 4-year-olds.
Despite this devastating effect of the HIV/ AIDS epidemic in SA, child mortality has declined to levels below those in the early stages of the epidemic, largely owing to the provision of prevention of mother-tochild transmission (PMTCT) and ARVs to women. Nevertheless, the study suggests that by 2012, there were still young children dying from AIDS. PMTCT programmes would need to be strengthened further to reduce the incidence of HIV/AIDS in children. The issue of non-adherence to treatment by pregnant women living with HIV has been reported in various settings. [24]
In a qualitative review of the notes from provincial stock-taking workshops, Goga et al.[25] identified several potential gamechangers that could contribute to the elimination of mother-to-child transmission of HIV. These include preconception counselling to optimise maternal-partner health, improved follow-up and response to abnormal laboratory results, use of wardbased outreach teams and community caregivers to trace HIV-infected mothers and their infants to link them into care, inclusion of a unique identifier in patientheld infant Road to Health booklets to facilitate infant tracing, and continuous quality improvement processes in facilities and districts.
Neonatal problems have become the leading cause of death, and future efforts to reduce childhood mortality further will need to strengthen programmes to address the emerging relative importance of neonatal mortality. Conditions related to prematurity and birth asphyxia together with infections account for a large proportion of the neonatal deaths. The National Perinatal Morbidity and Mortality Committee has advocated several initiatives to improve maternal healthcare services.[26]
Interventions to address the persistence of diarrhoeal disease and lower respiratory infections as major contributors to child mortality have shown some encouraging results from about 2010, coinciding with the inclusion of the pneumococcal and rotavirus vaccines in the Expanded Programme on Immunisation. Evaluation of the impact of the pneumococcal conjugate vaccine in Soweto suggests that as a result of the introduction of the vaccine there were 39% fewer hospitalisations in 2014. [27] Similarly, in Soweto, introduction of the rotavirus vaccine into the SA immunisation programme was temporally associated with a decrease of between 34% and 57% in the overall incidence of all-cause hospitalisations for diarrhoea of children aged <5 years of age. [28]
Estimates from the 2016 Rapid Mortality Surveillance Report,[29] however, suggest that there had been only a slight improvement in under-5 mortality after 2012, indicating that the impact of the interventions to reduce diarrhoeal disease and pneumonia in children together with PMTCT of HIV may have reached a limit. However, based on the modelled impact of known cost-effective interventions, Chola et al.[30] demonstrated that further investment in 15 interventions, including labour and delivery management, early HIV treatment in pregnancy, PMTCT and handwashing with soap, will enable SA to reduce child mortality considerably.
Our study highlights considerable inequities in health in SA, indicating the underlying effect of socioeconomic factors on health. The risk of a 5-year-old child dying in KwaZulu-Natal, a relatively poor, rural province experiencing the highest levels of HIV prevalence, was in 2012 still 2.8 times higher than the risk of death for a child living in the Western Cape, one of the wealthiest provinces, experiencing the lowest levels of HIV (Fig. 4). The level of mortality is strongly associated with the cause-of-death profile (Figs 4 and 5). The high-mortality provinces, KwaZulu-Natal, Mpumalanga, Free State and the Eastern Cape, display a predominance of pretransitional infections and HIV. In contrast, the provinces with the lowest mortality, the Western Cape and Gauteng, experience proportionally more deaths due to neonatal causes than deaths due to infections.
Comparison of the NBD estimates of child deaths with other sources, and allowing for the fact that the number in 2012 would be higher than the number experienced in 2015, highlights the fact that the Stats SA figures under-represent total deaths as a result of under-registration. While there are differences in the cause-fractions between the different estimates, the Stats SA profile differs considerably from the cause-fractions of the other estimates. In part, this arises from the relatively high proportion of illdefined causes that have been redistributed across other causes, but the low proportion of HIV/AIDS in the Stats SA data also stands out. It is clear that the Stats SA data do not yet provide an accurate profile of causes of death and that urgent intervention is required to improve registration and the quality of medical certification.
There are also differences in the causefractions between the estimates, which are largely a consequence of different approaches used in global estimation by United Nations agencies as opposed to academic groups.[31] The IHME uses a 'methodologically complex'[26] ensemble modelling approach. On the other hand, UNICEF's estimates are based on vital registration data for early and late neonatal deaths, with the post-neonatal causes being derived from a multinomial model based on verbal autopsy data used for high-mortality countries, with an average under-5 mortality rate >35 for 2000 - 2010.[32] The distribution of all-cause mortality fractions is strongly influenced by the proportion of deaths that are due to HIV/ AIDS, because it is relatively large. The NBD estimate of 19.5%, 3 years earlier than the other estimates based on deaths in 2015, lies between UNICEF's 8.7% and IHME's 38.6%.
UNICEF relies on the Joint United Nations Programme on HIV and AIDS (UNAIDS) estimates of HIV/AIDS mortality,[33] while the IHME[21] modifies the UNAIDS estimate through its use of ensemble modelling.
In contrast, the NBD used a regression approach to estimate misclassified HIV/ AIDS deaths.[9] Thembisa is a mathematical model of the HIV epidemic in SA. The most recent version, Thembisa 4.1, estimates the proportion of deaths due to HIV/AIDS in 2012 to be 17.9% v. the NBD's 19.5%, and that in 2015 HIV/AIDS accounted for 10.4% of deaths,[34] which are roughly consistent with the NBD and the UNICEF estimates, respectively.
In the face of less than perfect causeof-death data, an NBD study makes an important contribution to describing causes of death, ensuring internal consistency across causes and geographical regions.
However, it is important to keep in mind that there remains some uncertainty around the estimates and that there have been substantive changes over time.
Conclusions
Consistent with estimates of childhood mortality from the Rapid Mortality Surveillance System, the present study highlights that SA was not on track to meet its 2015 MDG goal. Furthermore, the study highlights the persistent provincial inequalities in childhood deaths and points to the major disease burdens that need to be addressed. By 2011, neonatal causes had taken over from HIV/AIDS as leading causes of death among children aged <5 years.
While poverty and social determinants need to be addressed, access to basic health services aimed at preventing neonatal deaths and mother-to-child transmission of HIV and provision of the Expanded Programme on Immunisation need to be equitably implemented across districts throughout the country. Ward-based outreach programmes need to be expanded to support the delivery of these services[35] as well as health promotion activities.
The rapid reduction of childhood mortality since 2005, to a level where under-5 mortality is 40 per 1 000 live births, suggests that the 2030 SDG target of 25 per 1 000 is achievable for SA, but attention needs to focus on reducing deaths in high-mortality provinces. In this regard the NBD is an important resource for monitoring progress in the provinces. It is therefore important to update the NBD study in order to continue monitoring progress towards the SDG.
Declaration. None.
Acknowledgements. We thank the other members of the SA NBD team, including Jané Joubert, Ria Laubscher, Richard Matzopoulos, Ian Neethling, Beatrice Nojilana, Megan Prinsloo, Nomfuneko Sithole and Ntuthu Somdyala. We thank Leigh Johnson for providing output from the Thembisa model.
Author contributions. DB, NNN and VP-vW conceptualised the study. All authors contributed to the methods. RED and NNN led the demographic analysis, PG led the classification of causes, and WM led the programming and modelling. All authors reviewed the estimates, contributed to the interpretation and drafting of the manuscript, and agreed on the final version of the manuscript.
Funding. This research and the publication thereof were partly funded by the South African Medical Research Council's Flagships Awards Project (SAMRC-RFA-IFSP-01-2013/SA CRA 2).
Conflicts of interest. None.
References
1. United Nations. United Nations Millennium Declaration. Resolution adopted by the General Assembly 55th session, agenda item 60 (b). A/RES/55/2. New York: United Nations, 2000. http://www.un.org/millennium/declaration/ares552e.htm (accessed 6 June 2019). [ Links ]
2. Leadership Council of the Sustainable Development Solutions Network. Indicators and a monitoring framework for the Sustainable Development Goals: Launching a data revolution for the SDGs. 12 June 2015. http://unsdsn.org/wp-content/uploads/2015/05/150612-FINAL-SDSN-Indicator-Report1.pdf (accessed 11 June 2019). [ Links ]
3. Nannan N, Timeus IM, Laubscher R, Bradshaw D. Levels and differentials in childhood mortality in South Africa, 1977 - 1998. J Biosoc Sci 2007;39(4):613-632. https://doi.org/10.1017/S0021932006001702 [ Links ]
4. Bradshaw D, Dorrington RE. Child mortality in South Africa - we have lost touch. S Afr Med J 2007;97(8):582-583. [ Links ]
5. Nannan N, Dorrington RE, Laubscher R, et aL Under-5 Mortality Statistics in South Africa: Shedding Some Light on the Trends and Causes 1997 - 2007. Technical Report. Cape Town: South African Medical Research Council, 2012. http://www.mrc.ac.za/sites/default/nles/nles/2017-05-26/MortalityStatisticsSA.pdf (accessed 11 June 2019. [ Links ]
6. Darikwa TB, Dorrington RE. The level and trends of child mortality in South Africa, 1996 - 2006. J Afr Popul Stud 2011;25(1 Suppl):158-172. [ Links ]
7. Bradshaw D, Dorrington RE, Laubscher R. Rapid Mortality Surveillance Report 2011. Cape Town: South African Medical Research Council, 2012. http://www.mrc.ac.za/sites/default/files/files/2017-05-26/RapidMortality2011.pdf (accessed 11 June 2019). [ Links ]
8. Bradshaw D, Msemburi W, Dorrington R, Pillay-van Wyk V, Laubscher R, Groenewald P; on behalf of the SA NBD team. HIV/AIDS in South Africa: How many people died from the disease between 1997 and 2010? AIDS 2016;30(5):771-778. https://doi.org/10.1097/QAD.0000000000000947 [ Links ]
9. Pillay-van Wyk V, Bradshaw D, Groenewald P, Laubscher R. Improving the quality of medical certification of cause of death: The time is now! S Afr Med J 2011;101(9):626. [ Links ]
10. Bamford LJ, McKerrow NH, Barron P, Aung Y. Child mortality in South Africa: Fewer deaths, but better data are needed. S Afr Med J 2018;108(3 Suppl 1):S25-S32. https://doi.org/10.7196/SAMJ.2017.v108i3b.12779 [ Links ]
11. Pillay-van Wyk V, Msemburi W, Laubscher R, et al. Mortality trends and differentials in South Africa from 1997 to 2012: Second National Burden of Disease Study. Lancet Glob Health 2016;4(9):e642-e653. https://doi.org/10.1016/S2214-109X(16)30113-9 [ Links ]
12. Pillay-van Wyk V, Laubscher R, Msemburi W, et al. Second South African National Burden of Disease Study: Data Cleaning, Validation and SANBD List. Cape Town: South African Medical Research Council, 2014. http://www.mrc.ac.za/sites/default/files/files/2016-07-04/SANBDReport.pdf (accessed 11 June 2019). [ Links ]
13. Bradshaw D, Groenewald P, Laubscher R, et al. Initial Burden of Disease estimates for South Africa, 2000. S Afr Med J 2003;93(9):682-688. [ Links ]
14. Murray CJL, Lopez AD. The Global Burden of Disease: A Comprehensive Assessment of Mortality and Disability from Diseases, Injuries, and Risk Factors in 1990 and Projected to 2020. Cambridge, Mass: Harvard University Press on behalf of the World Health Organization and the World Bank, 1996. [ Links ]
15. Murray CJL, Ezzati M, Flaxman AD, et al. GBD 2010: Design, definitions, and metrics. Lancet 2012;380(9859):2063-2066. https://doi.org/10.1016/S0140-6736(12)61899-6 [ Links ]
16. Matzopoulos R, Prinsloo M, Pillay-van Wyk V, et al. Injury-related mortality in South Africa: A retrospective descriptive study of postmortem investigations. Bull World Health Organ 2015;93:303-313. https://doi.org/10.2471/BLT.14.145771 [ Links ]
17. Burrows S, Bowman B, Matzopoulos R, van Niekerk A, eds. A Profile of Fatal Injuries in South Africa 2000: Second Annual Report of the National Injury Mortality Surveillance System (NIMSS) 2000. Technical Report. Cape Town: MRC/UNISA Crime, Violence and Injury Lead Programme, 2001. [ Links ]
18. Black R, Cousens S, Johnson HL, et al. Global, regional and national causes of child mortality in 2008: A systematic analysis. Lancet 2010;375(9730):1969-1987. https://doi.org/10.1016/S0140-6736(10)60549-1 [ Links ]
19. Dorrington RE. Alternative South African Mid-year Estimates, 2013. Centre for Actuarial Research Monograph 13. Cape Town: University of Cape Town, 2013. [ Links ]
20. Coale AJ, Demeny P. Regional Model Life Tables and Stable Population. Princeton, NY: University Press, 1966. [ Links ]
21. Statistics South Africa. Mortality and causes of death in South Africa, 2015: Findings from death notification. Statistical release P0309.3. Pretoria: Stats SA, 2017. https://www.statssa.gov.za/publications/P03093/P030932015.pdf (accessed 11 June 2019). [ Links ]
22. United Nations Children's Fund. Under-5 mortality: Current Status and Progress. New York: UNICEF 2017. https://data.unicef.org/wp-content/uploads/2017/10/Cause-of-Death-2017.xlsx (accessed 11 June 2019). [ Links ]
23. Global Burden of Disease Study 2016. GBD compare. https://vizhub.healthdata.org/gbd-compare/ (accessed 11 June 2019). [ Links ]
24. Adeniyi OV, Ajayi AI, Ter Goon D, Owolabi EO, Eboh A, Lambert J. Factors affecting adherence to antiretroviral therapy among pregnant women in the Eastern Cape, South Africa. BMC Infect Dis 2018;18(1):175. https://doi.org/10.1186/s12879-018-3087-8 [ Links ]
25. Goga A, Chirinda W, Ngandu NK, et al. Closing the gaps to eliminate mother-to-child transmission of HIV (MTCT) in South Africa: Understanding MTCT case rates, factors that hinder the monitoring and attainment of targets, and potential game changers. S Afr Med J 2018;108(3 Suppl 1):S17-S24. https://doi.org/10.7196/SAMJ.2018.v108i3.12817 [ Links ]
26. National Perinatal Morbidity and Mortality Committee. Saving Babies 2014 - 2016: Triennial Report on Perinatal Mortality in South Africa. https://www.westerncape.gov.za/assets/departments/health/napemmco_triennial_report_2014-2016_saving_babies.pdf (accessed 11 June 2019). [ Links ]
27. Lzu A, Solomon F, Nzene SA, et al. Pneumococcal conjugate vaccines and hospitalization of children for pneumonia: A time-series analysis, South Africa, 2006 - 2014. Bull World Health Organ 2017;95(9):618-628. https://doi.org/10.2471/BLT.16.187849 [ Links ]
28. Groome MJ, Zell ER, Solomon F, et al. Temporal association of rotavirus vaccine introduction and reduction in all-cause childhood diarrheal hospitalizations in South Africa. Clin Infect Dis 2016;62(Suppl 2): S188-S195. https://doi.org/10.1093/cid/civ1204 [ Links ]
29. Dorrington RE, Bradshaw D, Laubscher R, Nannan N. Rapid Mortality Surveillance Report 2016. Cape Town: South African Medical Research Council, 2018. http://www.mrc.ac.za/sites/default/files/files/2018-02-22/RapidMortalitySurveillanceReport2016.pdf (accessed11 June 2019). [ Links ]
30. Chola L, Pillay Y, Barron P, Tugendhaft A, Kerber K, Hofman K. Cost and impact of scaling up interventions to save lives of mothers and children: Taking South Africa closer to MDGs 4 and 5. Glob Health Action 2015;8(1):27265. https://doi.org/10.3402/gha.v8.27265 [ Links ]
31. Byass P. The imperfect world of global estimates. PLoS Med 2010;7(11)e1001006. https://doi.org/10.1371/journal.pmed.1001006 [ Links ]
32. World Health Organization. MCEE-WHO methods and data sources for child causes of death 2000 -2016. Global Health Estimates Technical Paper WHO/HMM/IER/GHE/2018.1. February 2018. https://www.who.int/healthinfo/global_burden_disease/childcod_methods_2000_2016.pdf (accessed 11 June 2019). [ Links ]
33. Joint United Nations Programme on HIV/AIDS. UNAIDS data 2017. UNAIDS, 2017:40. http://www.unaids.org/sites/default/files/media_asset/20170720_Data_book_2017_en.pdf (accessed 11 June 2019). [ Links ]
34. Johnson LF, May MT, Dorrington RE, et al. Estimating the impact of antiretroviral treatment on adult mortality trends in South Africa: A mathematical modelling study. PLoS Med 2017;14(12):e1002468. https://doi.org/10.1371/journal.pmed.1002468 [ Links ]
35. Doherty T, Kroon M, Rhoda N, Sanders D. Ending preventable child deaths in South Africa: What role can ward-based outreach teams play? S Afr Med J 2016;106(7):672-674. https://doi.org/10.7196/SAMJ.2016.v106i7.10790 [ Links ]
 Correspondence:
D Bradshaw
debbie.bradshaw@mrc.ac.za
Accepted 29 May 2019

