


Services on Demand
Article
 English (pdf)
 Article in xml format
 Article references
Indicators

Related links
-
 Cited by Google
 -
 Similars in Google
Share

 Permalink
SAMJ: South African Medical Journal
On-line version ISSN 2078-5135
Print version ISSN 0256-9574
SAMJ, S. Afr. med. j. vol.109 n.5 Pretoria May. 2019
http://dx.doi.org/10.7196/samj.2019.v109i5.13314
RESEARCH
Evidence for high sugar content of baby foods in South Africa
N C MaraisI; N J ChristofidesII; A ErzseIII; K J HofmanIV
IMPH; School of Public Health, Faculty of Health Sciences, University of the Witwatersrand, Johannesburg, South Africa
IIMPH, PhD; School of Public Health, Faculty of Health Sciences, University of the Witwatersrand, Johannesburg, South Africa
IIIMSc; PRICELESS SA, School of Public Health, Faculty of Health Sciences, University of the Witwatersrand, Johannesburg, South Africa
IVMB BCh; PRICELESS SA, School of Public Health, Faculty of Health Sciences, University of the Witwatersrand, Johannesburg, South Africa
ABSTRACT
BACKGROUND: Early-life exposure to excess sugar affects eating behaviour and creates a predisposition to non-communicable diseases (NCDs). While reducing sugar consumption has been high on the public health agenda, little is known about the sugar content of baby foods
OBJECTIVES: To describe and analyse the sugar content of baby foods in South Africa (SA
METHODS: A cross-sectional study was conducted to analyse the sugar content of baby foods. The study sample included commercially available baby foods targeted at children aged <12 months, sold in supermarkets and by other major retailers in SA. Primary data were obtained from the packaging, and sugar content was compared with recommended intake guidelines. Bivariate analyses were conducted to determine whether there were any associations between the sugar content, added sugar and the characteristics of foods
RESULTS: Over 70% of products were sweet in taste, with one in four containing added sugars. Sugar content was high in 78% of the foods sampled. Over 80% of cereals and pureed desserts contained added sugar. Fewer than 10% of pureed composite meal and pureed fruit and vegetable categories contained added sugar. Most products adhered to SA labelling standards, but none had front-of-pack nutritional information
CONCLUSIONS: The SA baby food market is characterised by products with a high sugar content, promoting an environment that encourages development of sweet-taste preferences and in the long term contributing to the rising burden of NCDs. There is an urgent need for mandatory regulation of sugar in baby foods
The focus of the commercial food and beverage industry has increasingly shifted from high-income settings to emerging markets.[1] South Africa (SA), characterised by a large youthful population, low but steadily growing incomes, relatively cheap advertising and little regulation, is no exception. The rapid growth of a commercial food industry led the shift from traditional rural diets, which are high in fibre and low in sugar and fat, to a more westernised diet based on processed commercially available foods.[2]
The pursuit of sales growth in the food and beverage markets is already having an impact in terms of increasing levels of consumption and caloric intake in SA. Research shows a rising tide of sugar consumption across the population, with children consuming ~50 g per day.[3,4] This increasing consumption is problematic, as high energy intake is the main dietary factor associated with childhood obesity.[5] The effects of early nutritional imbalance are already shown in SA by the high number of overweight children. Data from 2016 show that 13% of SA children are overweight, which is more than twice the global average of 6%.[6,7] Childhood obesity increases the odds of obesity later in life and also leads to a rise in the prevalence of chronic disorders associated with obesity.[8-10] Larger numbers of patients with obesity-associated diseases will place additional pressure on already fragile health systems. Proactively addressing high rates of obesity plays a crucial role in reducing non-communicable diseases (NCDs), which are projected to be the leading cause of death in the region by 2030.[11]
The SA government is committed to the prevention and control of NCDs through its National Strategic Plan. Several public health interventions have been introduced over the past decade in response to the high levels of sugar consumption, including taxation of sugar-sweetened beverages (SSBs), regulations limiting advertising to children, and recommendations for front-of-pack (FOP) labelling. To date, however, commercially available baby foods have been overlooked by both public health researchers and policymakers. In view of the crucial role early exposure to sugar plays in developing later taste preferences,[12-15] this gap in research represents a missed opportunity in addressing concerns around high intakes of sugar in SA.
Objectives
To address this knowledge gap, this study was designed to examine the sugar content of available baby foods in the SA market. Evidence on sugar content will add to the knowledge on nutrition, thereby providing informative value for public health efforts.
Methods
A cross-sectional descriptive and analytical study of baby food products in SA was conducted in 2015. The study sample included commercially available replacement, supplementary and complementary baby food products, specifically targeted at children aged <12 months and sold in supermarkets and by any other retailers that sold baby food products during the 2-month period July - August 2015. In alignment with the Nielsen Company 2015 report on the SA baby food market,[16] infant formulas were excluded because they represent a separate segment of the market. The sample also excluded beverages and any foods to be mixed with milk or formula if the total sugar content of prepared food could not be evaluated from the label (i.e. the label did not include nutritional information on whole prepared food for both serving size and per 100 g/mL of food). Products that were out of stock or not available in any of the stores at the time of data collection were not included in the study sample.
Data were collected through photographs of the back and front of the packaging in purposefully selected flagship stores and their online stores. Stores were chosen based on the following criteria: they were major SA retailers of baby foods targeted at children aged <12 months as stated on packaging with a large national footprint; and they sold brands mentioned in the Euromonitor Baby Food in South Africa report.[17] The investigator (NM) visited two or three branches of four major retailers in Gauteng Province. Baby foods were compared against a list of products in each brand obtained from the manufacturers' websites. For the purpose of comprehensive data collection, shelf labels were also reviewed for products that were out of stock and not available at the time of data collection, allowing the investigator to estimate how many items were not captured in the sample. Brands that were mentioned in the Brandshare LBN section of the Euromonitor report but were not available in any of the stores or the SA online stores were the Harley's brand, Nestlé Baby Delight and Nestlé Baby Menu. Both Nestlé brands seem to have been discontinued, as they were not available in Nestlé's current brand list in 2015. The Harley's brand listed in the Euromonitor report was not available in stores sampled or online. It was found that 17 baby food products (one from Bumbles brand, seven from Ella's Kitchen brands, two from Organix brand and seven from Purity brand) were out of stock or not available at the time of the study.
Data collected were product name, product description, brand, ingredients and nutritional information. The latter included sugar per 100 g (g), sugar per serving (g), energy per 100 mL/g (kJ), energy per serving (kJ), and any phrases indicating sugar content.
Data categorisation
We used the Euromonitor Baby Food in South Africa report[17] to create categories for food type (dry baby food, prepared baby food, other) and food subtype (snacks, cereals, pureed fruit, pureed fruit and vegetables, pureed vegetables, pureed composite meal, pureed dessert) based on the product name and product description. Dry baby foods included products that had to be reconstituted with water, which in this study solely included cereals. Baby food products were further classified as sweet or savoury based on a previously published study.[18] Sweet included all foods sweetened with sugar, honey or fruit, and this included snacks, pureed fruit, pureed fruit and vegetables, pureed desserts and most of the cereals. Savoury was all other foods - mainly composite meals excluding fruit and pureed vegetables only. Products were classified as having added sugar if their list of ingredients included sugar. The initial aim to group products further by the different types of added sugar was hindered because no sample in our study indicated such information. To interpret total sugar content, we relied on a guideline used by Elliott and Conlon. [19] The guideline classified baby foods as having high levels of sugar if they had >20% of total calories derived from sugar, and as having acceptable levels of sugar when <20% of total calories were derived from sugar. The total sugar content of each product was compared with recommended intake values and placed into one of two categories, namely high (above the recommended daily limit) and acceptable (within the recommended guidelines).
Adherence to labelling standards
To assess the extent to which baby food products conform to SA food-labelling regulations, data were compared against the mandatory requirements around labelling. These include that nutritional information is to be presented in tabular format with a heading 'Typical nutritional information'. Mass/volume of a single serving must be also indicated, accompanied by minimum mandatory information as prescribed per single serving and per 100 g/mL.[20]
The front of the pack of all items was also assessed for nutritional information relating to sugar content. 'No added sugar' and 'Sugar free' were the only two phrases that were used as an indication of sugar content in a product.
Statistical analysis
All statistical analysis was performed using Stata software version 9.0 (StataCorp, USA).[21] The Shapiro-Wilk test and Q-norm plot test were used for continuous variables (sugar content per 100 g, sugar content per serving), while the distribution of the data was determined by using skewness and kurtosis (D'Agostino test) for normality. All distributions were found to be non-normal except for the sugar content variables.
Descriptive statistics were used to describe the sugar content and the added sugar of the sample. Pearson's χ2 test was used to detect associations between categorical variables. Fisher's exact test was used when one or more of the categories had an expected frequency of <5.
A waiver was obtained from the Human Research Ethics Committee at the University of the Witwatersrand as data were obtained from products that are in the public domain, and no human subjects were involved in this study. Permission to take photographs was verbally requested at each store.
Results
General characteristics
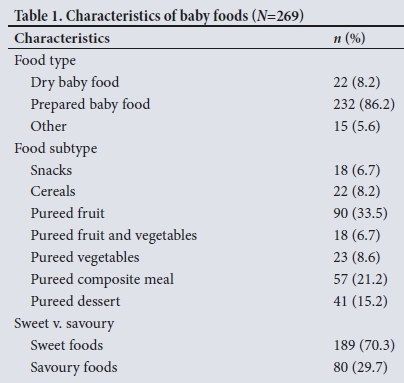
A sample of 269 baby food items was collected for general characteristics and sugar content data, but there were 34 products that did not detail sugar per serving or sugar per 100 g on the label required for the sugar content analysis. This left a sample size of 235 for the analysis of sugar per 100 g and sugar per serving. Products were available from 12 different manufacturers. The characteristics of the baby foods are set out in Table 1. Nearly ninety percent (86.2%) of the products were prepared baby food, of which 33.5% was pureed fruit and 21.2% was pureed composite meals. The sweet food subtypes included snacks, pureed fruit and pureed desserts, and most of the cereals. Of 22 cereal samples, only an organic plain rice cereal was not sweetened with sugar or fruit. The sample included a 'spinach and carrot' cereal that was sweetened with sugar, despite its name implying a savoury product. Composite meals that contained added sugar, including in the form of honey, were a carrot blend with semolina and two types of breakfast oats.
Sugar content and added sugar
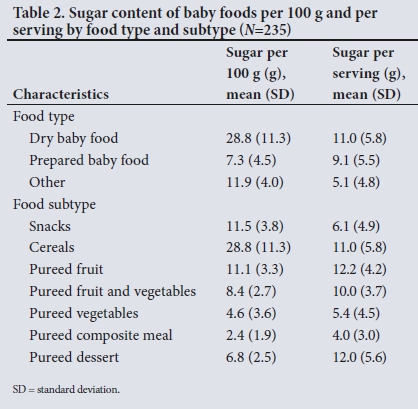
Even though three-quarters (74.3%) of baby foods did not include sugar in their list of ingredients, thereby falling in the 'no added sugar' category, the total sugar content was high in 77% of the products. When broken down by food type, results indicated that pureed fruit had the highest sugar content per serving, followed by pureed desserts, with an average of 12.2 g per serving and 12.0 g per serving, respectively (Table 2). Snacks, cereals and pureed fruits all had high mean sugar concentrations (sugar per 100 g) yet differed with regard to added sugar (Table 3).
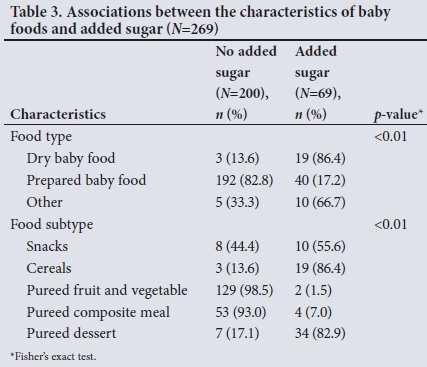
There were significant associations between food type and food subtype for added sugar. The majority (86.4%) of the dry baby food products had added sugar, while less than a quarter (17.2%) of the prepared baby food products had added sugar. The cereals and pureed desserts categories contained over 80% of the products containing added sugar. This contrasts with the pureed composite meal and pureed fruit and vegetable categories, where less than 10% of the products contained added sugar. In the snacks category, 55.6% of the products had added sugar. Nutritional information on the different types of added sugar or the percentage of sugar added during manufacturing was not available on any of the products in our sample.
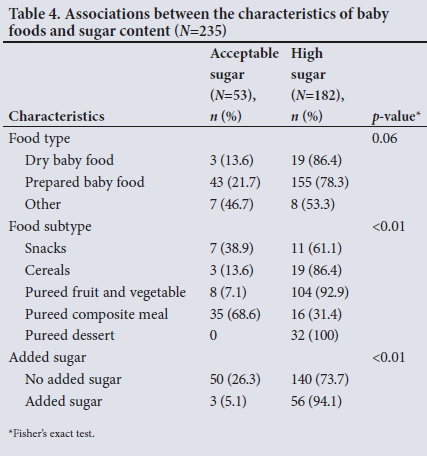
Only 22.6% of baby foods had acceptable levels of sugar (Table 4). There were significant differences in the proportion of products with acceptable and high levels of sugar by food subtype and added sugar for sugar content. Four manufacturers offered no baby food products with acceptable levels of sugar in certain categories, including cereals and yogurts from Nestlé, fruit purees from SMI International -Barney, and fruit and vegetable purees from Bumbles and Pure. In contrast, pureed composite meals contained two-thirds of the products with acceptable levels of sugar. No significant association was found between sugar content and food type.
Adherence to labelling standards
Labelling of most baby food products adhered to standards (85.1%). There were no products in the sample with FOP nutritional information, and only 1.1% of packages sampled mentioned sugar FOP.
Discussion
This is the first study to examine the sugar content of baby food products available in SA supermarkets. Relying on total sugar content, it critically reviews how these foods conform to the recommendations. Its strength lies in its informational value, that provides a benchmark against which public health policy and nutritional changes can be compared in SA.
Main findings
Our results resonate with findings in other countries, such as the UK, Canada and the USA.[17,18,22,23] While a large proportion of baby foods did not contain added sugars, over 70% of the baby foods were classified as sweet because they contained free sugars. The importance of this finding lies in the possible role that the disproportionate availability of sweet-flavoured products relative to those with savoury tastes plays in influencing consumer choice. If parents purchase and feed their children baby foods with sweet flavours, this is likely to affect subsequent food preferences and eating behaviour,[4] predisposing individuals to obesity and related metabolic disorders. The large quantity of cereals with added sugar is particularly important in the SA rural context, where cereals are the dominant commercial products given as first foods to infants. A recent study from rural North West Province found that 35% of mothers fed their infants commercial cereals, which together with home-made maize-meal porridge made up a large proportion of first weaning foods.[24] Similar findings were recorded in the more urban Gauteng Province, where commercial infant cereal was fed to 32% of infants as a first food.[25]
Despite the majority of baby foods having no added sugar, 78.7% of the commercial products sampled had a high total sugar content. This can be explained by the large proportion of pureed fruit in our sample, which made up >30% of all products sampled. Since fruits are high in natural sugars, it is to be expected that the total sugar content of fruit-based products and their overall calorie content will also be high. In SA, fresh fruit and commercially prepared food products are often introduced as second- and third-stage weaning foods,[24] which suggests that many infants are exposed to sweet tastes through fruit. Mashed and pureed whole fruits, prepared at home or purchased in shops, are important sources of vitamins, minerals and fibre, nutrients that make them good first-stage weaning foods that are easily digested. Sweet flavours from fruits are also an integral part of the feeding experience and paired with other flavours may help with the introduction of less readily accepted foods. Mashed and pureed whole fruits are therefore valuable in enhancing diet quality, providing a strong foundation for lifelong nutrition.[26] However, simple pureed foods with no added sugar but with a high total sugar content should be consumed in moderation. Pureed foods rich in sugar are equally likely to contribute to excess energy intake and can alter eating behaviour.[12,13]
Adherence to labelling standards
The majority of baby food products adhere to SA labelling standards. However, this finding should be interpreted with caution. In contrast to international guidelines on sugar (including the World Health Organization guidelines), the SA labelling regulations do not require the separation of different types of sugars in the nutritional information provided on packaging.[19,27,28] The lack of such regulatory measures for labelling was reflected in our analysis, where no study sample provided information on the type of sugars in its nutrition table. This deficiency limits consumers' ability to make informed nutrition decisions and select products that will lower their consumption of added sugar, and in turn their risk of developing adverse health conditions. It also prevents them from monitoring their daily added sugar intake against international recommendations, notably limiting added sugar intake to <5% or <10% of total daily calories.[29]
FOP labels are also seen as an effective method of informing consumers' nutritional choice based on nutritional content.[30] Despite the relatively large number of baby foods that were classified as high in sugar in our sample, we found that no product had a FOP label that showed nutritional information in any form. Given the requirement to provide nutritional details on portion sizes on nutritional tables and packaging[27] and the importance of this information in controlling obesity,[31] the presentation of details on nutrients per portion and the number of portions per package would be necessary.
Study limitations
The primary limitation of this analysis is that the researcher solely relied on nutritional information reported on the packaging; no laboratory analysis was undertaken to verify the true nutritional content of the products. Future studies should replicate the analysis with laboratory testing before strong conclusions can be made concerning the validity of the nutritional information presented on the packages. An additional limitation is that some items were out of stock at the time of data collection. Should these products have consistently higher or lower sugar content, they could have affected our results. An assumption can be made that if some of these brands are not easily available, general consumers would not purchase them. Finally, since the completion of data collection additional products have appeared and some of the packaging has changed.
Policy implications
Despite the study limitations, our research contributes invaluable knowledge to the literature on prevention and control of food-related NCDs in SA and serves as a call for urgent policy action. The National Department of Health (NDoH) is committed to the prevention and control of NCDs, including obesity;[30] however, our study findings highlight that to date the proposed goal has not been adequately translated into action.
In the light of our results, there are at least three multipronged policy opportunities through which SA could work towards the goals outlined in its national strategic documents. First, there is an urgent need for legislation for the mandatory disclosure of added sugar by manufacturers, separating added and natural sugars on the nutritional information provided on packaging. Such policy should be applied in parallel with the establishment of enforcement and monitoring mechanisms. Research in the UK suggests that consumers want to be able to identify which products have added sugars v. intrinsic sugars only.[32]
Second, in conjunction with disclosure of added sugar, FOP labelling has also been identified as a cost-effective tool in encouraging healthy food choices,[33,34] as easily understandable caloric and nutritional information alters the context in which the public makes choices about food.[35] One promising and effective food labelling system is Chile's octagonal warning logos informing consumers that a product exceeds a recommended limit of sugar. In SA, urban consumers showed a clear demand for such health information and preferred products that are represented on the label as healthy.[36] Evidence suggests that the provision of information on sugar and health further empowers parents or caregivers of infants by improving their knowledge and awareness on the topic.[37] In order to provide a multipronged approach when improving awareness around sugar, educational messages should be included in the health promotion messages section of the Road to Health booklet and should be dated and signed by the sisters when they have explained the information to the carer.
Enforcement of regulations on labelling could have a knock-on effect of manufacturers relooking at recipes to see if they can eliminate or decrease added sugar rather than advertising on labels that their food is high in sugar.
Lastly, incentivisation is key. The number of sweet baby food products and those that have added sugar needs to be reduced in favour of healthier alternatives. The Strategic Plan for the Prevention and Control of Non-Communicable Diseases 2013 - 17 showed that the most cost-effective interventions to reduce diet-related NCDs were mandatory regulations (e.g. the regulation of sodium levels in certain foods) and fiscal measures (e.g. food taxes on unhealthy food).[38] In view of the significant burden of hypertension in SA and its link to the high level of sodium intake, a mandatory guideline for sodium levels in processed foods was signed into law in 2013.[39] Beyond the number of lives saved, research showed that a reduction in salt consumption would also result in fiscal benefits.[40] Future research should explore the potential implementation of similar regulations in SA for sugar in baby foods and its impact on childhood obesity.
A tax on foods high in added sugar would make such products more expensive and is likely to result in a reduction in consumption of those foods. It has been demonstrated in a mathematical simulation that a 20% taxation on SSBs in SA as part of a multifaceted effort could reduce energy intakes and reduce obesity by 3.8% in men and 2.4% in women.[41]
Conclusions
The baby food market is expanding in emerging economies like that of SA, especially as more women enter the workforce. Our findings confirm this trend and show that the availability of baby food products that are sweet in taste, cereals with added sugar and dessert-type products promote an environment that enhances sweettaste preferences. This study found that while many baby foods are high in sugar and/or have added sugar, there is no regulation in place with regard to labelling to help consumers make informed decisions. In a country with the dual problem of stunting and obesity, there is an urgent need to move to counter this environment. Easy-to-understand transparent nutritional labelling to promote healthy food choices should be mandatory on all packaging along with messages sanctioned by the NDoH. The absence of legitimate and transparent efforts by industry to voluntarily reduce the sugar content of baby foods indicates the need for population-level policies that would make healthy choices easy for parents in SA. These might include fiscal measures and mandatory regulations to limit the sugar content in baby food products.
Declaration. The paper was based on a study done as partial fulfilment of NCM's MPH degree.
Acknowledgements. None.
Author contributions. NCM conceived and designed the study and conducted the data analysis. NJC contributed to the conceptualisation and supported data analysis. NCM and AE wrote the paper. NJC and KJH provided critical review and edited drafts. All authors approved the version to be published.
Funding. NCM received a small seed grant from the School of Public Health, Faculty of Health Sciences, University of the Witwatersrand, to purchase the Euromonitor report. KJH and AE are supported by PRICELESS SA. Funding for this analysis was provided by the South African Medical Research Council (D1305910-01).
Conflicts of interest. None.
REFERENCES
1. Taylor AL, Jacobson MF. Carbonating the World: The Marketing and Health Impact of Sugar Drinks in Low- and Middle-income Countries. Washington, DC: Center for Science in the Public Interest, 2016. https://cspinet.org/sites/default/nles/attachment/carbonatingreport.pdf (accessed 24 July 2018). [ Links ]
2. Tathiah N, Moodley I, Mubaiwa V, Denny L, Taylor M. South Africa's nutritional transition: Overweight, obesity, underweight and stunting in female primary school learners in rural KwaZulu-Natal, South Africa. S Afr Med J 2013;103(10):718-723. https://doi.org/10.7196/SAMJ.6922 [ Links ]
3. Steyn NP, Temple NJ. Evidence to support a food-based dietary guideline on sugar consumption in South Africa. BMC Public Health 2012;12(1):502. https://doi.org/10.1186/1471-2458-12-502 [ Links ]
4. Maunder EMW, Nel JH, Steyn NP, Kruger HS, Labadarios D. Added sugar, macro- and micronutrient intakes and anthropometry of children in a developing world context. PLoS One 2015;10(11):e0142059. https://doi.org/10.1371/journal.pone.0142059 [ Links ]
5. Moreno LA, Rodriguez G. Dietary risk factors for development of childhood obesity. Curr Opin Clin Nutr Metab Care 2007;10(3):336-341. https://doi.org/10.1097/MCO.0b013e3280a94f59 [ Links ]
6. South Africa Demographic and Health Survey 2016. Pretoria: Statistics South Africa, 2017. http://www.mrc.ac.za/bod/SADHS2016.pdf (accessed 8 November 2017). [ Links ]
7. Development Initiatives. Global Nutrition Report 2017: Nourishing the SDGs. Bristol, UK: Development Initiatives, 2017. https://www.globalnutritionreport.org/files/2017/11/Report_2017.pdf (accessed 8 November 2017). [ Links ]
8. Nader PR, O'Brien M, Houts R, et al. Identifying risk for obesity in early childhood. Pediatrics 2006;118(3):e594-601. https://doi.org/10.1542/peds.2005-2801 [ Links ]
9. Eriksson J, Forsén T, Tuomilehto J, Osmond C, Barker D. Size at birth, childhood growth and obesity in adult life. Int J Obes 2001;25(5):735-740. https://doi.org/10.1038/sj.ijo.0801602 [ Links ]
10. Paul IM, Bartok CJ, Downs DS, Stifter CA, Ventura AK, Birch LL. Opportunities for the primary prevention of obesity during infancy. Adv Pediatr 2009;56(1):107-133. https://doi.org/10.1016/j.yapd.2009.08.012 [ Links ]
11. Marquez PV, Farrington JL. The challenge of non-communicable diseases and road traffic injuries in sub-Saharan Africa. An overview. World Bank, 2013. http://documents.worldbank.org/curated/en/844381468209068874/pdf/792930WP0WB0NC0l0Box07929300PUBLIC0.pdf (accessed 8 November 2017). [ Links ]
12. Birch LL, Doub AE. Learning to eat: Birth to age 2 y. Am J Clin Nutr 2014;99(3):723S-728S. https://doi.org/10.3945/ajcn.113.069047 [ Links ]
13. Ventura AK, Worobey J. Early influences on the development of food preferences. Curr Biol 2013;23(9):R401-R408. https://doi.org/10.1016/j.cub.2013.02.037 [ Links ]
14. Mennella JA, Griffin CE, Beauchamp GK. Flavor programming during infancy. Pediatrics 2004;113(4):840-845. https://doi.org/10.1542/peds.113.4.840 [ Links ]
15. Mennella JA, Jagnow CP, Beauchamp GK. Prenatal and postnatal flavor learning by human infants. Pediatrics 2001;107(6):e88-e88. https://doi.org/10.1542/peds.107.6.e88 [ Links ]
16. The Nielsen Company. Global Baby Care Report: Oh, baby! Trends in the baby food and diaper markets around the world. Nielsen Company, USA, 2015. https://www.nielsen.com/content/dam/nielsenglobal/jp/docs/report/2015/20150829%20Global%20Baby%20Care%20Report%20Revised%20FINAL.PDF (accessed 11 March 2019). [ Links ]
17. Euromonitor International. Baby Food in South Africa report and database. Euromonitor International, 2014. http://www.euromonitor.com/baby-food-in-south-africa/report (accessed 8 November 2017). [ Links ]
18. Garcia AL, Raza S, Parrett A, Wright CM. Nutritional content of infant commercial weaning foods in the UK. Arch Dis Child 2013;98(10):793-797. https://doi.org/10.1136/archdischild-2012-303386 [ Links ]
19. Elliott CD, Conlon MJ. Packaged baby and toddler foods: Questions of sugar and sodium. Pediatr Obes 2015;10(2):149-155. https://doi.org/10.1111/j.2047-6310.2014.223.x [ Links ]
20. South Africa. Regulations Relating to the Labelling and Advertising of Foodstuffs R146 of 1st March 2010, as amended by R1091 of 19 November 2010. http://www.foodfocus.co.za/assets/documents/Regulation%20of%201091%20of%2019%20Nov%202010%20summary%20march%202011.pdf (accessed 2 April 2017). [ Links ]
21. Data Analysis and Statistical Software | Stata. https://www.stata.com/ (accessed 29 November 2017). [ Links ]
22. Elliott CD. Sweet and salty: Nutritional content and analysis of baby and toddler foods. J Public Health Oxf Engl 2011;33(1):63-70. https://doi.org/10.1093/pubmed/fdq037 [ Links ]
23. Maalouf J, Cogswell ME, Bates M, et al. Sodium, sugar, and fat content of complementary infant and toddler foods sold in the United States, 2015. Am J Clin Nutr 2017;105(6):1443-1452. https://doi.org/10.3945/ajcn.116.142653 [ Links ]
24. Kruger R, Gericke GJ. A qualitative exploration of rural feeding and weaning practices, knowledge and attitudes on nutrition. Public Health Nutr 2003;6(2):217-223. https://doi.org/10.1079/PHN2002419 [ Links ]
25. MacIntyre UE, de Villiers FPR, Baloyi PG. Early infant feeding practices of mothers attending a postnatal clinic in Ga-Rankuwa. South Afr J Clin Nutr 2005;18(2):70-75. https://doi.org/10.1080/16070658.2005.11734042 [ Links ]
26. Gerrish CJ, Mennella JA. Flavor variety enhance food acceptance in formula-fed infants. ResearchGate. 2001. https://www.researchgate.net/publication/11955661_Flavor_variety_enhance_food_acceptance_in_formula-fed_infants (accessed 12 February 2018). [ Links ]
27. South Africa. Foodstuffs, Cosmetics and Disinfectants Act, 1972 (Act 54 of 1972). Regulations relating to the labelling and advertising of foodstuffs. Published under Government Notice R146. Government Gazette No. 32975, 1 March 2010. http://www.danone.co.za/upload/R146%20of%201%20March%202010.pdf (accessed 8 November 2018). [ Links ]
28. South Africa. Foodstuffs, Cosmetics and Disinfectants Act, 1972 (Act 54 of 1972). Regulations relating to the labelling and advertising of foodstuffs, R146 of 1 March 2010: Amendment. Published under Government Notice R45. Government Gazette No. 34957, 19 January 2012. [ Links ]
29. World Health Organization. Diet, nutrition and the prevention of chronic diseases. WHO Tech Rep Ser 2003; No. 916. http://www.who.int/dietphysicalactivity/publications/trs916/en/ (accessed 24 July 2018). [ Links ]
30. National Department of Health, South Africa. Strategy for the prevention and control of obesity in South Africa 2015 - 2020. 2016. https://www.health-e.org.za/wp-content/uploads/2015/12/National-Strategy-for-prevention-and-Control-of-Obesity-4-August-latest.pdf (accessed 24 July 2018). [ Links ]
31. Ledikwe JH, Ello-Martin JA, Rolls BJ. Portion sizes and the obesity epidemic. J Nutr 2005;135(4):905-909. https://doi.org/10.1093/jn/135.4.905 [ Links ]
32. Food Standards Agency, UK. Front of pack nutritional signpost labelling: Technical guidance. January 2007. https://www.foodwatch.org/fileadmin/Themen/Ampelkennzeichnung/guidance_ampel_issue_1_januar_2007.pdf (accessed 27 November 2017). [ Links ]
33. Bleich SN, Herring BJ, Flagg DD, Gary-Webb TL. Reduction in purchases of sugar-sweetened beverages among low-income black adolescents after exposure to caloric information. Am J Public Health 2012;102(2):329-335. https://doi.org/10.2105/AJPH.2011.300350 [ Links ]
34. Gortmaker SL, Swinburn BA, Levy D, et al. Changing the future of obesity: Science, policy, and action. Lancet 2011;378(9793):838-847. https://doi.org/10.1016/S0140-6736(11)60815-5 [ Links ]
35. Roberto CA, Khandpur N. Improving the design of nutrition labels to promote healthier food choices and reasonable portion sizes. Int J Obes 2014;38(Suppl 1):S25-S33. https://doi.org/10.1038/ijo.2014.86 [ Links ]
36. Bosman MJ, van der Merwe D, Ellis SM, Jerling JC, Badham J. South African adult metropolitan consumers' opinions and use of health information on food labels. Br Food J 2014;116(1):30-43. https://doi.org/10.1108/BFJ-12-2011-0298 [ Links ]
37. Ilic D, Rowe N. What is the evidence that poster presentations are effective in promoting knowledge transfer? A state of the art review. Health Inf Libr J 2013;30(1):4-12. https://doi.org/10.1111/hir.12015 [ Links ]
38. National Department of Health, South Africa. Strategic Plan for the Prevention and Control of Non-Communicable Diseases 2013 - 17. 2013. http://www.hsrc.ac.za/uploads/pageContent/3893/NCDs%20STRAT%20PLAN%20%20CONTENT%208%20april%20proof.pdf (accessed 24 July 2018). [ Links ]
39. Hofman KJ, Lee R. Intersectoral case study: Successful sodium regulation in South Africa. World Health Organization, 2013. http://www.who.int/iris/handle/10665/205179 (accessed 1 February 2018). [ Links ]
40. Bertram MY, Steyn K, Wentzel-Viljoen E, Tollman S, Hofman KJ. Reducing the sodium content of high-salt foods: Effect on cardiovascular disease in South Africa. S Afr Med J 2012;102(9):743-745. [ Links ]
41. Manyema M, Veerman LJ, Chola L, et al. The potential impact of a 20% tax on sugar-sweetened beverages on obesity in South African Adults: A mathematical model. PLoS One 2014;9(8):e105287. https://doi.org/10.1371/journal.pone.0105287 [ Links ]
 Correspondence:
K J Hofman
karen.hofman@wits.ac.za
Accepted 8 October 2018

