


Services on Demand
Article
 English (pdf)
 Article in xml format
 Article references
Indicators

Related links
-
 Cited by Google
 -
 Similars in Google
Share

 Permalink
SAMJ: South African Medical Journal
On-line version ISSN 2078-5135
Print version ISSN 0256-9574
SAMJ, S. Afr. med. j. vol.109 n.5 Pretoria May. 2019
http://dx.doi.org/10.7196/samj.2019.v109i5.13775
IN PRACTICE
HEALTHCARE DELIVERY
Measuring quality outcomes across hospital systems: Using a claims data model for risk adjustment of mortality rates
R Moodley NaidooI; G A TimothyII; L SteenkampIII; S CollieIV; Μ J GreylingV
IMB ChB, MPH, MBA; Strategic Risk Management, Discovery Health, Johannesburg, South Africa
IIMB ChB, DA (SA), FCPHM, MMed (Community Health); Strategic Risk Management, Discovery Health, Johannesburg, South Africa
IIIMComm (Statistics); Risk Intelligence, Discovery Health, Johannesburg, South Africa
IVBSc (Actuarial Science) Hons, FASSA, FIA; Risk Intelligence, Discovery Health, Johannesburg, South Africa
VBSc (Mathematical Statistics) Hons, BSc (Industrial Psychology) Hons, MSc (Mathematical Statistics); Data Management and Statistical Analysis, Johannesburg, South Africa
ABSTRACT
Healthcare delivery systems around the world are designing care through value-based models where value is defined as a function of quality of care outcomes and cost. Mortality is a sentinel outcome measure of quality of care, of fundamental importance to patients and providers. Discovery Health (DH), an administrative funder of healthcare in South Africa (SA), uses service claims data of client medical schemes to examine standardised mortality rates (SMRs) at condition level across hospital systems for the purpose of healthcare system improvement. To accurately examine and contrast variation in condition-level SMRs across acute hospital systems, this outcome metric needs to be risk-adjusted for patient characteristics that make mortality more, or less, likely to occur. This article describes and evaluates the validity of risk-adjustment methods applied to service claims data to accurately determine SMRs across hospital systems. While service claims data may have limitations regarding case risk adjustment, it is important that we do not lose the important opportunity to use claims data as a reliable proxy to comment on the quality of care within healthcare systems. This methodology is robust in its demonstration of variation of performance on mortality outcomes across hospital systems. For the measurement period January 2014 - December 2016, the average risk-adjusted SMRs across hospital systems where DH members were hospitalised for acute myocardial infarction, stroke, pneumonia and coronary artery bypass graft procedures were 9.7%, 8.0%, 5.3% and 3.2%, respectively. This exercise of transparently examining variation in SMRs at hospital system level is the first of its kind in SAs private sector. Our methodological exercise is used to establish a local pattern of variation of SMRs in the private sector as the base off which to scrutinise reasons for variation and off which to build quality of care improvement strategies. High-performing healthcare systems must seek out opportunities for learning and continuous improvement such as those offered by examining important quality of care outcome measures across hospitals.
Healthcare delivery around the world is advancing to value-based models. The reimbursement structure for the delivery of care in South Africa (SA)'s private sector is predominantly fee for service. Such models are recognised for favouring volume of care services over value of care services, where a value unit of care is defined as the quality outcomes achieved per costs incurred in the delivery of care.[1]
Discovery Health (DH), an administrative funder of healthcare in SA, routinely measures certain quality outcomes such as standardised mortality rates (SMRs) and shares these with providers of care for the purpose of healthcare improvement. Owing to DHs role in the funding of healthcare, measurement of outcomes is based predominantly on service claims data. Where other sources of data are used, such as audits of case notes and administrative data, these are limited in application and used to support claims analysis.
Mortality is a sentinel outcome measure of quality of care and is helpful in understanding the performance of healthcare systems for the purpose of improvement. The measurement of SMRs occurs across hospitals that serve members of schemes administered by DH, referred to as client schemes'. We share these results with hospitals and health professional care teams through standardised reports. Our intention is to demonstrate variation in care patterns to spur improvement. We hold the view that sharing SMRs with hospitals and care teams will support improvement efforts in the reduction of preventable deaths associated with acute inpatient care.
For the purpose of assessing variation of SMRs between hospitals, risk-adjustment methods are applied to source service claims data The single goal of risk-adjustment SMR models is to accurately consider and adjust for patient clinical and demographic factors, so-called 'demand-side factors' that may skew results owing to disproportionately weighted demand factors across hospitals.[2-4]
Objectives
To describe and evaluate the validity of risk-adjustment methods applied to claims data to accurately determine condition-specific SMRs of individual hospitals in the private sector in SA, allowing for comparison of SMRs between hospitals.
Methods
Condition-specific mortality rates
The SMRs were calculated for specific conditions. The Agency for Healthcare Research and Quality (AHRQ) (the health services research arm of the US Department of Health and Human Services) has constructed a set of measures that provide a view on hospital quality of care using administrative data, called inpatient quality indicator (IQI) mortality measures.[5] Conditions for reporting are chosen based on variation in mortality rates across the USA, suggesting that high mortality may be associated with deficiencies in quality of care. From the IQI list, we chose to initially measure pneumonia, stroke, acute myocardial infarction (AMI) and coronary artery bypass graft (CABG) procedures as relevant to the SA private sector setting. These four conditions collectively contributed to 14% of all deaths (for individuals aged >18 years) occurring within 30 days of an admission and 3.1% of all discharges during the years 2014, 2015 and 2016 (DH administrative claims data, 2014 - 2016, unpublished). By concentrating on the SMRs for specific conditions, we hope to contribute meaningfully to the focused approach by hospitals and care teams to optimising the management of these and related conditions.
Definitions
The SMRs for specific conditions were calculated as follows (AHRQ Quality Indicators, 2016[5]):
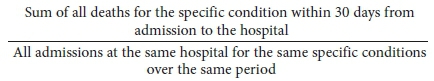
All causes of death were measured as an outcome, within 30 days of admission for that specific medical condition or procedure. Thirty days from admission is considered an appropriate time frame in which a death may reasonably be attributed to care in hospital, the transitional period to a non-acute setting and suitability of the patient for discharge.[6] Quality of care can affect outcomes in a 30-day time frame, and many current hospital interventions are known to decrease the risk of death within 30 days of an admission.[7] The concept that evaluating an outcome using a standardised period such as 30 days complies with standards for such measures and is included in scientific statements by the American College of Cardiology and the American Heart Association.
The metric of death within 30 days of admission is counted irrespective of whether death occurred in or out of hospital, and is chosen instead of inpatient deaths only to ensure a consistent measurement time frame from admission, as length of hospital stay varies across patients and hospitals.
The denominator: Included population
The data used to calculate the condition-specific mortality rates were obtained from claims data submitted to client schemes of DH for a 3-year period from 2014 to 2016. The included population in the denominator calculation for stroke, pneumonia or AMI had to be >18 years of age, and hospitalised during the measurement period with a principal discharge diagnosis of stroke, pneumonia or AMI. The included population age requirement for inclusion for CABG was >40 years. Members were excluded from the cohort if discharged against medical advice (refused hospital treatment), or if pregnant.
To allow for a full view of claims data regarding comorbid diseases and other clinical risk factors, members who met the criteria for the included population further had to have been enrolled in the client scheme for at least 12 months prior to the admission used in the included population sample.
For specific conditions, criteria unique to the condition were applied in determining suitability of inclusion in the included population. For AMI and pneumonia, patients discharged alive on the day of the admission or the subsequent day, who were not transferred to another acute hospital, were excluded from the included population.[6] The rationale for this exclusion is based on the notion that given the very short hospitalisation of these cases, it is questionable whether the clinical diagnosis of AMI and pneumonia was accurate, resulting in the exclusion of such cases.
Internationally, ischaemic strokes are the most common type of stroke and account for the majority of stroke hospitalisations. In our data set for the 2014 - 2016 period, ischaemic strokes accounted for 92% of strokes. The causes, prognosis and treatment of ischaemic stroke can be quite different from those of haemorrhagic stroke, making the stroke cohort mixed if the two stroke types are combined. This heterogeneous picture is further confounded by differences in risk factors, making the risk adjustment difficult in this combined scenario. Haemorrhagic strokes were therefore excluded from the stroke population, with only ischaemic strokes included.
Only isolated CABG procedures were included in the calculation of CABG SMRs. Isolated CABG surgeries were defined as CABG procedures performed without concomitant valve or other major cardiac, vascular, or thoracic procedures.
For members transferred from one facility to another where a death occurred, such a death can only be assigned to one of these facilities. In these situations the first hospital, considered the first entry point into the healthcare system, was allocated the death if the patient was transferred from that hospital >24 hours after the initial admission. If the transfer occurred within 24 hours, the receiving hospital was accountable for the outcome of the patient.[6]
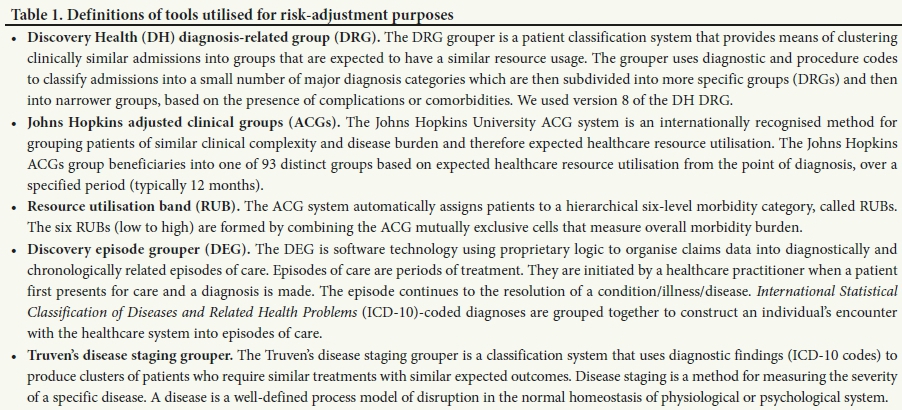
To avoid survival bias and to comply with model independence, for each condition one admission was randomly selected during the 3-year rolling period of data collection for patients with multiple admissions for the same diagnosis during this time. This was performed using simple random sampling without replacement in R, with a set seed value of 50. While patients with multiple admissions are anticipated to have an increased morbidity profile, this is accounted for by the ACG Resource Utilisation Band and Truvens disease staging risk factors (Table 1).
Hospitals with <25 cases for the diagnosis of any one of the four conditions during the 3-year rolling period were not reported on for that condition.
The numerator: Identifying deaths
The claims data used to calculate the condition-specific SMRs were analysed through a manual auditing process to confirm that the death did occur. All deaths were identified by a withdrawal from the client scheme with reason provided for death, International Statistical Classification of Diseases and Related Health Problems (ICD-10) coding of death on claims data (hospital-submitted claims or provider claims), or submission of a death certificate to the client scheme for the purpose of withdrawal from the scheme. Such errors are mainly due to administrative issues or human error factors involving incorrect dates of death captured on death certificates by the Department of Home Affairs, or issues of delayed member withdrawal from client schemes. For this data period, 18 203 deaths were audited and 16 446 were deemed true and included in the cohort (numerator) for the specified conditions.
Statistical analysis to achieve case risk adjustment: A two-stepped approach
Certain clinically high-risk members may be vulnerable to death during or shortly after an admission, given the associated underlying clinical risk profile. As such, an analysis of the impact of a hospital system on the probability of death needs to account for the impact of individual differences in the clinical risk profile of the treated population. A statistical risk-adjustment model is developed to understand, for the general admitted population, its relative risk of dying and the various risk factors that influence the probability of death. The relative distribution of individual risks for each hospital system is then statistically modelled to obtain a relative risk score per hospital after accounting for the individual patient differences. There are therefore two steps to the risk-adjustment approach.
In brief, the two-stepped modelling approach models data at the patient level and subsequently at a hospital system level to account for the variance in SMRs within and between hospitals.
The patient-level model
The relative risks for each individual were estimated by means of the gradient boosting machine (GBM) family of models. A linear mixed model was then used to estimate the relative risk score per hospital, adjusted for the individual risks as determined by the GBM model.
The GBM model is a newer machine learning model that in general, segments the data in more accurate risk cells and consequently provides stronger prediction power than conventional statistical regression. Generally, GBM models are an ensemble family in that they combine a collection of simpler models to generate a prediction from the combination. The term 'boosting' in the model title describes the method of choosing the simpler models. Each subsequent model is chosen on the basis that it improves the prediction of observations currently poorly predicted by the available set of simple models. As the outcome of this study was a binary variable (death = yes/no), the class of simpler models used was the decision tree. Elith et α/.[8] provide an accessible description of the features of this subclass of the GBM family of models. All predictive models are at risk of over-fitting the model to the data. The GBM family of models addresses this risk in a number of ways. The approach of using simple models is generally resistant to over-fitting,[9] but in addition this can be reduced by stochastically selecting subsamples for the fitting of each simple tree and similarly stochastically selecting subsets of the independent variables for each pass. Finally the results are assessed using an independent validation sample distinct from the training sample.[10]
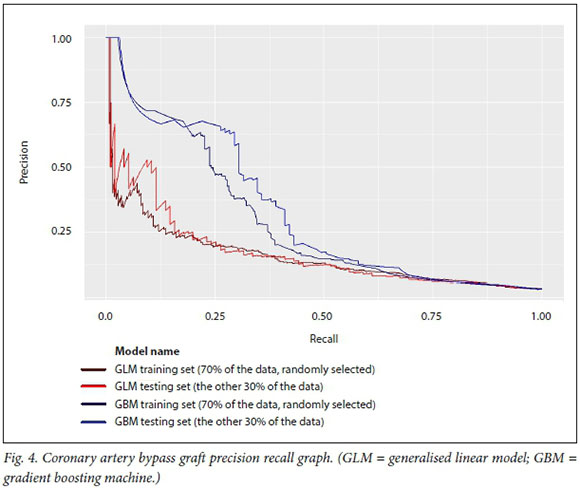
This GBM model is used to predict the probability of mortality (within 30 days of admission for medical admissions and within 30 days of the procedure date for CABG). Models were fitted on randomly selected 2009 - 2013 client scheme data, referred to as the training data. These trained models were then tested on the remaining 30% of 2009 - 2016 client scheme data, the output of this being referred to as the testing data.
The GBM model includes as predictors age at admission date gender, base diagnosis-related grouper (DRG) of the evaluated admission, base DRG disease stage (as per the Truven model), clinical emergency (ICD-10 as per PMB (Prescribed Minimum Benefit) billed on event), resource utilisation bands (12 months prior to admission month), count of prior relevant events per month (last 12 months prior to event month), and all validated chronic disease staging conditions (as per the Discovery episode grouper) and Truven disease stage of that condition 12 months prior to the event (only where >10 patients have a stage for this condition).[11,12]
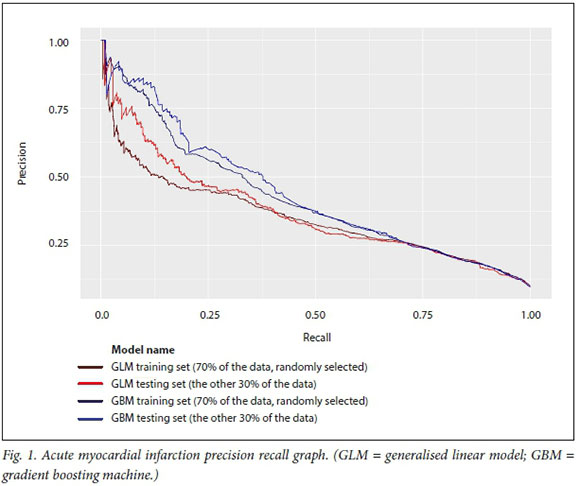
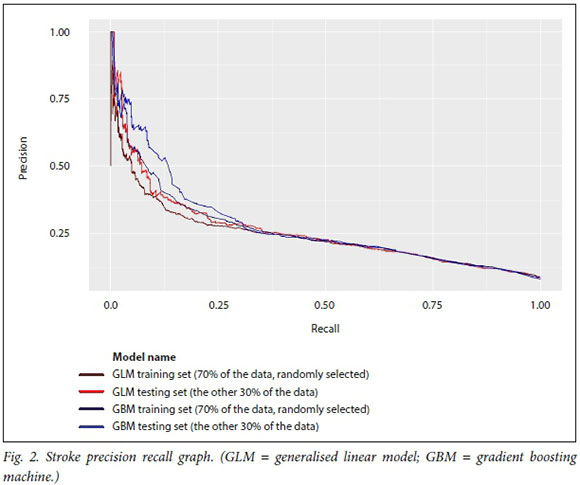
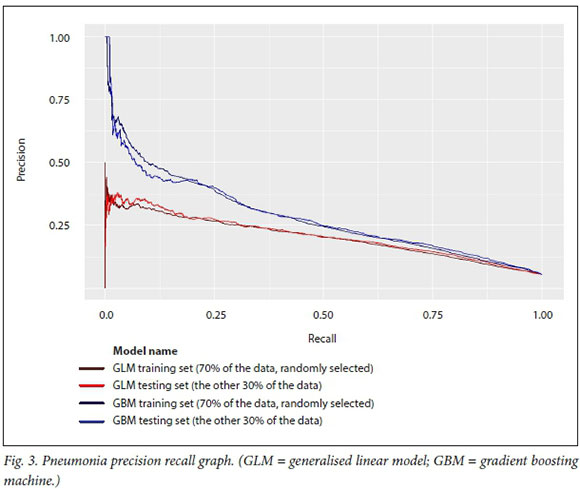
In this analysis, the GBM model predicts at a higher level of accuracy for the four medical conditions and surgical procedures than a linear model of the same data. This is evident from the operating characteristic curves in Figs 1-4, which show that the test dataset has better precision (probability that a predicted positive is in fact a true positive) and recall (or specificity, the probability that a true positive is identified as such) for the whole range of the predicted probability.
The hospital system-level model
The second step of the two-step model is at the hospital system level, and models the hospital-specific effects as a term in the model indicating the degree to which patients in a given hospital have a higher or lower risk of death after adjusting for the estimated patient risk of death based on the outcomes of the model in step 1. As such, the hospital system effect represents the underlying risk of mortality at the hospital, after accounting for patient clinical risk. In particular the probability scores from the first model for the measurement period of 2014 - 2016 were used as a covariate to create the final relative risk score per hospital system, which is the metric that we report on.
The distribution of hospital-specific effects is estimated to account for the clustering (non-independence) of patients within the same hospital. If there are no differences among hospitals, after adjusting for patient risk, the hospital system effects should be identical across all hospitals and as such the outcomes should show no more than random variation across the hospitals. However, if the variation between hospitals is non-negligible, the effect size for each hospital reflects the relative risk for patients in that hospital.
To report the findings, the random effect for each hospital was estimated and a 90% confidence interval (CI) was generated per hospital, given its underlying patient distribution. Hospitals were noted where the effect size was significantly different from 0 (0 falls in the CI), indicating that the hospital had significantly better or worse performance than the pool of hospitals.
The random effects estimator is a shrinkage estimator where the mean shrinks towards the global mean in the case of a small number of observations for that particular hospital. This has the advantage that hospitals with few results are not inadvertently penalised (or provided undue benefit) owing to a few unusual results.
Bedside case notes verification of case risk adjustment
Internationally, clinical case review of bedside case notes is widely used to validate administrative claims data that have been risk-adjusted, to determine accuracy of the fit of claims data as a proxy for clinical outcomes data such as those provided through registries, in determining condition-specific SMRs.[13] A clinical team undertook to achieve this purpose to validate the case risk-adjustment findings of the GBM model. A retrospective review of hospital case files was done on a random sample of 271 members across 54 hospitals from the data set used in the GBM model.
The case notes review sought specifically to verify the accuracy of comorbid conditions that were used in the claims case risk-adjustment purposes, and therefore to determine alignment between claims case risk adjustment and clinical risk stratification. Data obtained from this verification process showed that 82.2% of comorbid diseases described in bedside notes were accounted for in the claims risk adjustment for the four conditions chosen. The pneumonia cohort had risk factors that were 96.6% matched, while CABG was 90.5% matched. AMI and stroke had risk factors that were 75% and 72% factor matches, respectively. It is not possible to comment on the relevance of mismatched factors between the claims risk adjustment and the clinical case notes review without a review of the treating health professional's files. It is worth noting that it is unlikely that comorbid conditions exist that are not captured through claims analysis, as claims need to be submitted for reimbursement of clinical services and for the entitlement of benefits. However, it remains possible that other patient records outside claims submitted to client schemes may include conditions not captured in the history of submitted claims and administrative data, and such conditions could have a bearing on the claims case risk adjustment.
Results
Following clinical risk adjustment of the data and the resulting output of hospital-level SMRs, each hospital system is analysed relative to the average of all hospitals analysed. The total cohort of hospitals analysed is regarded as a national representation, so each individual hospital SMR is reported on as follows:
• More deaths than the national average
• Deaths no different from the national average
• Fewer deaths than the national average.
The national average referred to here is the average of SMRs for all hospital systems in our analysis, which is restricted to members of client schemes of DH included in the numerator and denominator populations as defined elsewhere in the article.
For the measurement period January 2014 - December 2016, for which the risk-adjusted SMRs are calculated, a total of 8 809 admissions for stroke, 29 159 admissions for pneumonia, 5 791 admissions for AMI and 2 955 cases of CABG were included in the data. The numbers of deaths for these conditions over the time period evaluated were 707, 1 556, 564 and 95, respectively.
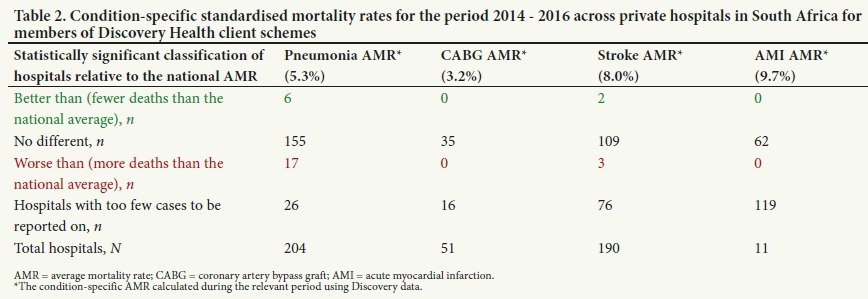
The average mortality rates for AMI, stroke, pneumonia and CABG were 9.7%, 8.0%, 5.3% and 3.2%, respectively. While the aim is not to compare with international benchmarks, it is interesting to note that none of these rates is alarming in comparison. The rates measured in the SA setting compared with the US setting are either similar or lower for the four conditions.
The mortality rates across all hospitals with >25 admissions for the particular condition during the data period ranged as follows: CABG 0 - 14.5%, AMI 0 - 32.1%, stroke 0 -34.8% and pneumonia 0 - 17.7%.
All hospitals with adequate numbers of cases for calculation of a mortality rate in the CABG and AMI categories were deemed to have mortality rates no different from the national average. For pneumonia and stroke, some variation in terms of hospital performance was evident, as illustrated in Table 2.
Discussion
Donabedian's[14] component approach to evaluating the quality of care delivered by healthcare systems is the foundation of measuring quality for the improvement of healthcare systems. The three Donabedian components of quality are structure, process and outcome measures. Each of these components is important to measuring and improving quality, but according to Donabedian,[14] and similar to Michael Porter's[1] construct of value-based healthcare, outcome measures remain the 'ultimate validators' of the effectiveness of healthcare. Quality outcomes can be difficult to define and there may be time lags from initiation of an improvement to its materialising in a commensurate improvement in an outcome. Tracking outcome measures over time as well and presenting this information to healthcare providers is fundamental to developing sustainable changes in healthcare systems.
Mortality due to illness is the single most important and serious outcome measure of care. The reality is that some individuals die despite receiving the best care possible. Measuring mortality rates allows us to determine whether more deaths have occurred than would ordinarily be expected. However, for mortality to be a meaningful and fair hospital system indicator, we need to take account of differences in the case-mix of patients and system-related factors that may influence the likelihood of dying. This adjusted measure may help to avoid preventable deaths in the future by contributing to the evaluation of hospital performance, providing accountability guiding improvement programmes, and informing further research that will contribute to improving the safety and quality of care in hospitals.
Certain conditions requiring acute care in hospital are more susceptible than others to preventable deaths resulting from hospital system gaps. This situation is evidenced through variation in mortality rates across hospital care systems. This article describes a model that uses claims data to compare risk-adjusted SMRs for specific conditions at hospital system level towards developing an understanding of patterns of variation in quality of care delivered in the private healthcare setting in SA. Our goal is to support and spur improvement through transparently sharing these results with providers of care. It is our view that gaps that are highlighted in the delivery of care present an opportunity for learning and improvement. International studies have shown that reporting of mortality measures does lead to improvements in the quality of care delivered.[15]
This exercise of examining variation in SMRs at hospital system level is the first of its kind in SAs private sector. These results are not benchmarked against internationally reported mortality findings; the purpose of the exercise is rather to examine the variation in SMRs across local private hospital systems that becomes a base from which performance can be strengthened. It is our understanding that the private healthcare system strives for excellence and continuous improvement. Our analysis of hospital systems relative to each other therefore allows for reflection by private hospitals and care teams on improvement strategies towards an improved national benchmark. This practice of clustering facilities in a country or region, and determining variation among the chosen group, is international in its scope and has been reported in many countries (USA, UK, Canada, Australia). [16-19]
Audited data were used to confirm that a death occurred. We used a claims data model that has been validated internationally[3,6,13,20] as a good proxy for clinical data, such as bedside case notes, for the purpose of risk adjustment. Our claims data only include information that is known about the patient from our administrative systems, including claims submitted for acute and chronic clinical services, and the registration of members for chronic conditions. If an insured member chooses not to be registered for a chronic disease or does not submit claims for acute or chronic clinical services incurred, the claims case risk adjustment is vulnerable to not being fully case risk-adjusted for that member by missing potential risk factors. Despite this drawback, the verification clinical case review process has illustrated that the claims data used to risk-adjust for the modelling conducted have an adequate alignment with the clinical case information. Other considerations include the quality of ICD-10 coding that occurs.
While claims data may have limitations regarding case risk adjustment, it is important that we do not lose the opportunity to use claims data as a reliable proxy to comment on the quality of care within healthcare systems. We use this transparency of performance outcomes measures such as SMRs to support or improve the healthcare system. The results that are reported on are of the healthcare system as a whole, and not individual hospitals or individual health professionals. A single result cannot pinpoint reasons for a hospital's SMR. Healthcare systems consisting of hospital teams and health professionals should use these data to initiate dialogue and processes to determine the reasons for that healthcare system's SMR and what improvements are needed to improve quality of care. We advocate that even hospitals with the highest-performing SMRs strive to do better, as any continuing improvement framework would advise.
SMR results are currently shared with hospital and healthcare professionals. We intend to update the results on an annual basis and to share them with providers of care to support efforts to improve the quality of care delivered by healthcare systems.
Conclusions
It is our view that the measurement and reporting of quality of care outcome metrics, such as SMRs, is a valuable approach to enabling a culture of learning and continuous improvement within healthcare systems.
The method described in this article has not been described previously in the SA setting and shows that condition-specific mortality can be measured in a claims-based environment using a robust methodology adopted and adapted from international practice. While hospital groups and individual hospitals may struggle to replicate this particular claims-based methodology owing to lack of claims insight and access to data, other private sector medical funders can utilise this methodology to report, reflect and share these valuable outcomes. The tools used, as described in this article, were either proprietary to DH or proprietary to other international companies.
In the non-claims environment, clinical data such as bedside case notes available to hospitals and doctors can similarly be used to examine SMRs across hospital systems, for the purpose of initiating and tracking improvement.
The aim of this claims-based risk-adjustment methodology is not to compare local results against international benchmarks. Our intention with using this methodology is to establish a local distribution pattern that examines variation of SMRs across hospital systems, which is a standard approach in statistical quality improvement. Ultimately, one cannot improve on the unknown. Measuring quality outcomes in healthcare is important in ensuring that the consumer of healthcare services receives the best care possible. Not all deaths are preventable, but the goal of robustly measuring mortality is to encourage broad approaches to quality improvement to lower the general risk of mortality in hospital systems.
Declaration. None.
Acknowledgements. None.
Author contributions. RMN, GAT, LS: conceptualisation, review, write-up and editing of the manuscript; LS, SC, MJG: design, data analysis and interpretation of the data. All authors approved the final version of the manuscript.
Funding. None.
Conflicts of interest. None.
REFERENCES
1. Porter ME. What is value in health care? Ν Engl J Med 2010,363:2477-2481. https://doi.org/10.1056/nejmpl011024 [ Links ]
2. Tu JV, Sykora K, Naylor CD. Assessing the outcomes of coronary artery bypass graft surgery. J Am Coll Cardiol 1997,30(5).1317-1323. [ Links ]
3. Bratzier DW, Normand S-LT, Wang Y, et aL An administrative claims model for profiling hospital 30-day moratlity rates for pneumonia patients. PLoS One 2011,6(4).el7401. https://doi.org/10.1371/journalρone.0017401 [ Links ]
4. Normand S-LT, Shahian DM. Statistical and clinical aspects of hospital outcomes profiling. Stat Sei 2007;22(2)-.206-226. https://doi.org/10.1214/088342307000000096 [ Links ]
5. AHRQ Quality Indicators. 2016. https://www.qualityindicators.ahrq.gov/Modules/IQI_TechSpec_ICD10_v2018.aspx (accessed 15 September 2018). [ Links ]
6. Yale New Haven Health Services/Center for Outcomes Research & Evaluation. 2016 condition-specific measures updates and specifications report hospital-level 30-day risk-standardized mortality measures. 2016. http://aann.org/uploads/Condition_Specific_Readmission_Measures.pdf (accessed 25 March 2019). [ Links ]
7. Jha AK, Li Z, Orav EJ, Epstein AM. Care in US hospitals - the hospital quality alliance program. Ν Engl J Med 2005,353.265-274. https://doi.org/10.1056/nejmsa051249 [ Links ]
8. Elith J, Leathwick JR, Hastie T. A working guide to boosted regression trees. J Anim Ecol 2008-,77(4).802-813. http://doi.org/10.1111/j.l365-2656.2008.01390.x [ Links ]
9. Friedman J, Hastie T, Tibshirani R. Additive logistic regression. A statistical view of boosting. Ann Stat 2000,28(2).337-407. https://doi.org/10.1214/aos/1016218223 [ Links ]
10. Gradient Boosting Machine-H20 3.22.0.1 documentation. August 2018. http://docs.h2o.ai/h2o/latest-stable/h2o-docs/data-science/gbm.html (accessed 25 March 2019). [ Links ]
11. John Hopkins ACG System. 2017. https://www.hopkinsacg.org/ (accessed 25 March 2019). [ Links ]
12. White Paper. Truven Health Medical Episode Grouper. Applications and methodology. September 2013. http://truvenheaith.com/portais/0/assets/HP_12980_0913_MEG_Apps_Methods.pdf (accessed 25 March 2019). [ Links ]
13. Krumholz HM, Lin Ζ, Drye EE, et aJ. An administrative claims measure suitable for profiling hospital performance based on 30-day all-cause readmission rates among patients with acute myocardial infarction. Circ Cardiovasc Qua! Outcomes 2011,4(2).243-252. https://doi.org/10.1161%2FCIRCOUTCOMES.110.957498 [ Links ]
14. Donabedian A. Evaluating the quality of medical care. Miipark Q 2005,83(4).691-729. https://doi.org/10.1111/J.1468-0009.2005.00397.X [ Links ]
15. Jha AK, Oray EJ, Epstein AM. The inverse relationship between moratlity rates and performace in the Hospital Quality Alliance measures. Health Aff (Millwood) 2007,26(4).1104-1110. https://doi.org/10.1377/hlthaff.26.4.1104 [ Links ]
16. Chung SC, Sundström J, Gale CP, et ai. Comparison of hospital variation in acute myocardial infarction care and outcome between Sweden and United Kingdom. Population based cohort study using nationwide clinical registries. BMJ 2015*351*3913. https://doi.org/10.1136/bmj.h3913 [ Links ]
17. OECD. Health at a Glance 2017. OECD Indicators. Hospital mortality rates. https://doi.org/10.1787/health_glance-2017-35-en [ Links ]
18. Jarman B, Bottle A, Aylin P, Browne M. Monitoring changes in hospital standardised mortality ratios. BMJ 2005-,330-.329. https://doi.org/10.1136/bmj.330.7487.329 [ Links ]
19. Bureau of Health Information. The Insights Series. 30-day mortality following hospitalisation, five clinical conditions, NSW, July 2009 - June 2012. 2013. http://www.bhi.nsw.gov.au/_data/assets/pdf_file/0018/204309/30-day-Mortality_December2013.pdf (accessed 15 January 2019). [ Links ]
20. Scott I, Youlden D, Coory M. Are diagnosis specific outcome indicators based on administrative data useful in assessing quality of hospital care? Qua! Saf Health Care 2004,13(1).32-39. https://doi.org/10.1136/qhc.l3.1.32 [ Links ]
 Correspondence:
G A Timothy
geraldinet@discovery.co.za
Accepted 21 February 2019

