


Serviços Personalizados
Artigo
 Inglês (pdf)
 Artigo em XML
 Referências do artigo
Indicadores

Links relacionados
-
 Citado por Google
 -
 Similares em Google
Compartilhar

 Permalink
SAMJ: South African Medical Journal
versão On-line ISSN 2078-5135
versão impressa ISSN 0256-9574
SAMJ, S. Afr. med. j. vol.109 no.1 Pretoria Jan. 2019
http://dx.doi.org/10.7196/samj.2019.v109i1.13268
RESEARCH
Cost of intensive care services at a central hospital in South Africa
S MahomedI; O H MahomedII
IMB ChB, MMed (Public Health Medicine), PhD; School of Laboratory Medicine and Medical Sciences, College of Health Sciences, University of KwaZulu-Natal, Durban, South Africa
IIMB ChB, MBA, MMed (Public Health Medicine), PhD; School of Nursing and Public Health, College of Health Sciences, University of KwaZulu-Natal, Durban, South Africa
ABSTRACT
BACKGROUND. Intensive care services are one of the largest cost drivers in a hospital. Increasing life expectancy and comorbidities have resulted in an increased need for intensive care beds.
OBJECTIVES. To conduct a cost analysis of intensive care services at a central hospital in the public sector in South Africa (SA).
METHODS. A retrospective cost analysis for the 2015/16 financial year was conducted across two intensive care units (ICUs), a trauma ICU (10 beds) and a combined ICU for neurosurgery, medicine and surgery (18 beds). A mixed-methods costing approach was used based on the availability of data. The bottom-up approach was used to calculate the cost of clinical support, pharmaceuticals, consumables and human resources. The top-down approach was used to allocate the cost of equipment and goods and services.
RESULTS. There were 544 admissions resulting in 4 987 inpatient days during the study period. The total estimated inpatient cost across the two ICUs was ZAR114 055 104, with a cost per patient day of ZAR22 870. The combined ICU cost per patient day was 58% higher than the cost per patient day in the trauma ICU (ZAR26 954 v. ZAR17 021). The mean cost per admission was ZAR157 883 in the trauma ICU and ZAR245 087 in the combined ICU. Human resources costs were the highest ICU cost driver (55%), followed by direct patient activity costs (medical consumables, pharmaceuticals, laboratory tests, radiology and blood products), which contributed 24%.
CONCLUSIONS. This is the first reported cost analysis of intensive care services in SA. Our cost per patient day was higher than that reported in other lower-income countries, but lower than that in high-income countries. These costs vary owing to the different types of ICUs, wide spectrum of disease presentation and availability of diagnostic and treatment options. This study provides useful data that could assist in the planning and provision of intensive care services.
South Africa (SA) has a two-tiered healthcare system comprising a large public health service and a rapidly growing private for-profit sector. In 2015/16, hospital services accounted for an estimated ZAR87 billion (57%) of the total public health expenditure in SA, of which more than half was used for general regional hospitals (ZAR24 billion), central hospitals (ZAR18 billion) and tertiary hospitals (ZAR10 billion). Expenditure at these hospitals was mainly driven by personnel, laboratory tests, medicines and medical supplies. [1]In the province of KwaZulu-Natal, regional and tertiary hospitals and central hospitals accounted for 27% and 12%, respectively, of the total provincial health expenditure in the public sector in 2015/16.[2]Regional hospitals provide access to high care and short-term ventilation, while tertiary hospitals offer services that are more specialised and have intensive care units (ICUs). Central hospitals deliver highly specialised services, often in subspecialties that require skilled personnel and unique and expensive technologies, and have specialised ICUs. [3]
In 2008/09, there was a total of 4 719 ICU beds in the healthcare sector in SA, with 75% (3 533) in the private sector and 25% (1 186) in the public sector. [4] The majority of ICU beds were located in three provinces: Gauteng (49%), KwaZulu-Natal (14%) and Western Cape (15%).[4]KwaZulu-Natal had a total of 224 ICU beds in the public sector, translating to 1 bed per 45 000 population.[4] ICUs function differently in the two sectors. In public hospitals ICUs are closed units run by a specialist clinician, usually an intensivist, whereas in the private sector the ICUs are open units and any clinician can admit and manage a patient in the ICU.
Medical advances, together with increasing life expectancy, have increased the proportion of patients with multiple morbidities, thereby increasing demands for intensive care beds. [5] The need for ICU services often exceeds the availability of ICU beds. In the public sector, the development of new hospitals with ICUs has been constrained owing to the increasing focus on making primary healthcare accessible to the population. As a result, the growth in private sector ICUs has outstripped that in the public sector.
Although ICUs comprise <10% of all hospital beds, the cost of admissions in an ICU is significant.[6]In the USA, intensive care costs have increased from -13% to nearly a third of inpatient costs over the past two decades.[6,7] In SA, intensive care services, like all other health services in the public sector, are provided at no cost to patients who are unemployed. Previously, if a patient required intensive care services and there was no available ICU bed in the public sector, the KwaZulu-Natal Department of Health would 'buy' this service from the private sector. This arrangement met the healthcare needs of the patients, but presented challenges in terms of who took responsibility for the care of the patient, and the surmounting costs associated with private healthcare. It is therefore important for both managers and clinicians to be aware of the cost of patient stays in an ICU.
Objectives
Previous research has analysed the cost of primary healthcare services, district hospital services and specific health programmes,[8,10] but there has not been an analysis of the costs incurred in ICUs in the SA public sector. The objective of this research was to conduct a cost analysis of intensive care services in the public sector from the perspective of the health service provider.
Methods
The study was conducted at an 846-bed central hospital in the eThekwini Health District in KwaZulu-Natal. This hospital has a trauma ICU (10 beds), a combined neurosurgical, medical and surgical ICU (6 beds per discipline), a cardiothoracic ICU (8 beds), a burns ICU (4-7 beds) and a transplant ICU (2 beds). We included the trauma and combined neurosurgical, medical and surgical ICUs in this study. A retrospective cost analysis for the 2015/16 financial year (1 April 2015 - 31 March 2016) was conducted.
We used a mixed-methods costing approach based on the availability of data for the ICUs under consideration. The cost components utilised are outlined in Table 1. Land and building costs were excluded owing to unavailability of data. The equipment at the facility attracts a monthly usage charge that is reimbursed to the private managing agent, and depreciation was therefore not calculated. The bottom-up approach was used to calculate the cost of clinical support, and pharmaceuticals and consumables. These costs were assigned to each ICU based on resource utilisation. The hospital uses cost-centre accounting, and we were therefore able to obtain the total costs for equipment and goods and services for the ICUs. The top-down approach was used to allocate equipment and goods and services per ICU based on the proportion of patient days per ICU.
The unit costs of laboratory and radiography investigations, consumables, and goods and services were obtained from hospital administrative databases. Human resource costs were obtained from the hospital human resource database and included all nurses, doctors and managers employed full-time at each of the ICUs.
The clinical costs for the medical, surgical and neurosurgical ICU were disaggregated to the medical/surgical and neurosurgical sections using the bottom-up approach. The remaining costs were allocated to the medical and surgical and neurosurgical sections based on the number of inpatient days. All costs were based on SA rands at the average exchange rates for 2015: ZAR13.48 = USD1.00, ZAR14.85 = EUR1.00.[11] A sensitivity test based on including land and building costs at a rate of ZAR10 000.00 per square metre and varying inpatient days was conducted.
Permission to conduct the study was obtained from the hospital management and the KwaZulu-Natal Department of Health Research Committee. The study was approved by the Biomedical Research and Ethics Committee of the University of KwaZulu-Natal (ref. no. BE053/14).
Results
Cost per admission
During the 2015/16 financial year there were 544 admissions in the two ICUs with a total cost of ZAR114 055 104, which is equivalent to 5.3% of the total hospital expenditure for the financial year (Table 2). The 323 admissions to the combined ICU accounted for 59.4% of admissions, of which 215 (39.5%) were to the neurosurgical section and 108 (19.8%) to the medical and surgical section. The combined ICU accountedfor more than two-thirds of the cost (ZAR79 162 985). The mean cost per admission for both ICUs was ZAR209 660. The mean cost per admission was ZAR157 883 in the trauma ICU, ZAR201 347 in the neurosurgical section and ZAR332 161 in the medical and surgical section of the combined ICU.
Estimated cost per patient day
The cost per patient day in the two ICUs was ZAR22 870. The cost per patient day was 58% higher in the combined ICU (ZAR26 954) than the trauma ICU (ZAR17 021). Of the 2 937 inpatient days in the combined ICU, 1 636 were in the neurosurgical section of the combined ICU and 1 301 in the medical and surgical section. The cost per patient day in the neurosurgical section of the ICU and the medical and surgical section showed a very slight difference (ZAR26 461 v. ZAR27 574) despite the fewer inpatient days in the medical and surgical section.
Component costs
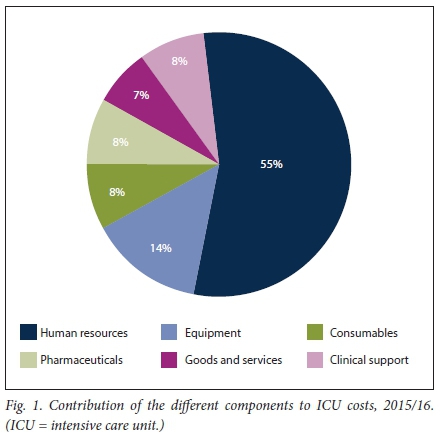
Human resources costs were the highest ICU cost driver (55%). Other direct patient activity costs (clinical support, consumables and pharmaceuticals) accounted for 24% of the total ICU costs. A fixed cost driver at this specific facility is the equipment cost, which accounts for 14% of the ICU cost (Fig. 1). The cost per day, excluding direct patient activity costs and clinician costs, was ZAR13 433.
Sensitivity analysis
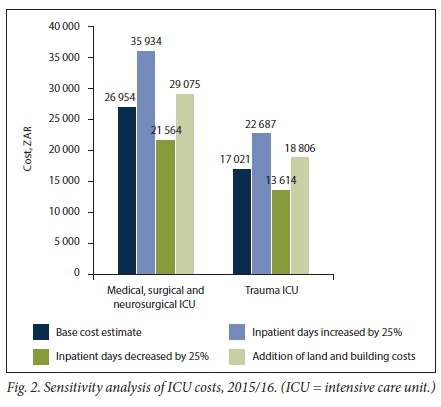
Two scenarios were modelled, taking into consideration the unique situation of the hospital. This hospital provides tertiary and quaternary levels of care, and patients are meant to be transferred back to the referring hospital once they are stable and no longer need specialised care. Owing to lack of availability of the patient transport system, patients may spend extra days in the ICU after they have been deemed fit for transfer. We therefore looked at the effect of inpatient days on the ICU costs by increasing and decreasing the inpatient days by 25%. We also estimated land and building costs to determine the effect these would have on the total costs.
The number of inpatient days has a major influence on the cost of managing patients in the ICU (Fig. 2). A 25% decrease in the number of inpatient days resulted in a 33% increase in the cost per inpatient day without adjusting any of the other fixed costs. Land and building costs increased the overall cost per inpatient day by -ZAR2 000.
Discussion
A limited number of studies have been conducted on the cost of treatment of patients admitted to ICUs in low- to middle-income countries. Owing to the different types of ICUs, the wide spectrum of disease presentation and the availability of numerous diagnostic and treatment options, the cost of ICU admissions varies tremendously. [12]The diversity of costing methodologies used to calculate ICU costs also makes comparative analyses a challenge.[13]
In the USA, ICUs accountedfor 13.5% of total hospital expenditure in 2005,[14]while an earlier study in The Netherlands estimated that ICU costs represent -20% of the total hospital budget. [15] In contrast to these studies, our study showed that the cost of ICU admission at a public sector hospital in SA accounts for an estimated 5% of the total hospital expenditure. However, it must be noted that we included costs for only two ICUs in the hospital. If costs of the specialised and paediatric ICUs were included, the proportion of ICU costs would be higher. In SA the ratio of public sector ICU beds to the population varies across provinces from 1:20 000 in the Western Cape to 1:150 000 in Limpopo.[4] The contribution of ICU costs to total public hospital expenditure is therefore likely to be lower in SA than in countries with higher ICU bed-to-patient ratios such as the USA, with an estimated 20 - 30 beds per 100 000 population.[16]
The cost per ICU day (USD2 000/EUR1 815 in the trauma ICU and USD1 263/EUR1 146 in the combined ICU) in the current study is higher than the cost per day of USA 193 in a medical ICU in a tertiary hospital in Sarajevo,[17] and EUR144 across 13 ICUs in Hungary. Our cost per ICU day is also higher than the USD255 reported in a tertiary ICU in India in 2011. Similarly, our cost per admission (USD 15 553) is more than five times higher than the reported cost in India (USD2 818)[18]In contrast, our findings indicate a much lower cost than the cost of ICU care at teaching hospitals in Canada (CAD4 186),[19] and our figures are slightly lower than but comparable to mean direct costs for an ICU day (EUR1 383) determined by the standardised costing methodology across four European countries. [20]Intensive care costs are influenced by the length of stay of the patients and the case mix. In our setting, which is the only hospital in the province providing quaternary services, it is likely that the patients in the ICUs had more complicated clinical conditions warranting a higher level of care than patients in ICUs at tertiary or regional hospitals. The costs calculated in this study are therefore likely to be higher than ICU costs incurred at these lower-level facilities. The association between length of stay and cost per patient day is important, and mechanisms should be in place for patients to be transferred out of the ICU as soon as this is possible. In our hospital setting, the trauma ICU in particular is faced with patients awaiting transport to the referring hospital, as there are no step-down trauma beds in the hospital.
The high cost in the current study can be attributed to the contribution of human resources costs, which has been demonstrated in other countries and other clinical settings such as Europe and the UK, where human resources costs in the ICU contributed 61% and 67%, respectively. [20,21]In a costing study conducted in SA in the 1990s, human resources was the highest contributing cost, with nurses accounting for the highest proportion of human resources costs.[22] The high human resources cost is due to the salaries of specialist professional nurses and specialist clinicians, and the involvement of a multidisciplinary team in patient care. In the present study, the actual contribution of human resources costs incurred by intensive care services would be higher than 55%, as we were unable to include the salaries of medical and surgical registrars who provide services in the ICUs on a rotational basis. These registrars are paid externally through a health professional training grant. We were also unable to allocate direct costs for other specialists who consult with patients in the ICU and for allied healthcare professionals (physiotherapists, occupational therapists, pharmacists) and hospital management.
Clinical support, pharmaceuticals and consumable costs accounted for 24% of the total cost of an ICU admission, lower than the 34% reported in the UK and 36% across four European countries. [20,23] Our study site is a public sector hospital, and it is likely that the lower prices of consumables and pharmaceuticals, obtained at government tender prices, resulted in a lower proportional cost of pharmaceuticals and consumables.
Equipment was the third contributing cost driver in our setting and may be explained by the financing mechanism of the hospital. The hospital runs on a public-private partnership agreement, in which the private consortium manages the medical equipment and non-clinical services and receives a monthly operational payment.
Interestingly, the cost per patient day in the public sector, excluding direct patient activity costs and clinician costs (ZAR13 433), is similar to the tariff charged to patients by private sector hospitals per day in ICUs (Mediclinic ZAR14 006, Netcare ZAR 12 943).[24,25] However, this finding must be viewed with caution as the hospital in which this cost analysis was conducted operates using a different financial model to other public sector hospitals. In the private sector patients are billed separately for all investigations, pharmaceuticals and consumables used during their ICU stay, and for clinician consultations. It is therefore likely that the cost per admission in the private sector would be higher than in the public sector. Obtaining private sector cost data is extremely difficult owing to the competitive nature of the industry. Although we are unable to determine the cost drivers for ICUs in the private sector, this study provides an initial cost estimate that could be used to inform the debate on cost recovery in both sectors, as well as to reconsider the feasibility of 'buying' ICU beds during shortages in the public sector.
The costs of managing a patient are often not considered in the public sector, as hospitals seldom bill patients for services received. This is likely to change with the introduction of National Health Insurance, as hospitals will be expected to be competitive and efficient while recovering their costs through the insurance system. Costing of individual patient services in both the public and private sectors is therefore an important precursor to the implementation of National Health Insurance.
Study limitations
The mixed-methods approach to our cost analysis has limitations. Microcosting using the bottom-up approach with all costs calculated per patient activity is the best approach to costing health services, but this was not possible in the current study owing to the unavailability of disaggregated costing data for all components at the patient level. Costs were apportioned based on inpatient days and do not include the time spent on the activity. The costs in the current study were calculated as a cost per admission and cost per day, but we did not consider the fluctuations in the intensity of treatment provided during the patient's ICU stay. Studies have shown a higher cost for the first day of admission in an ICU.[20,26]
Conclusions
Despite the limitations of this cost analysis, this study provides useful data that managers in the health sector could use in the planning and provision of intensive care services. These results may be of value when considering the financing and reimbursement model in National Health Insurance. Further research into the contribution of clinician costs in the private sector will provide a platform for the exploration of the use of closed ICUs, as in the public sector.
Declaration. None.
Acknowledgements. The authors thank Mr P Shezi, Mr S Raman, Mr T Pillay and Mr K Edward for providing the financial and human resource data. We also thank Prof. A W Sturm for reviewing the manuscript.
Author contributions. SM conceptualised the research, collected and analysed the data, and wrote all versions of the manuscript. OM assisted with data analysis and reviewed all versions of the manuscript.
Funding. None.
Conflicts of interest. None.
References
1. National Treasury, South Africa. Provincial Budgets and Expenditure Review. 2010/11 - 2016/17. Pretoria. National Treasury, 2015. [ Links ]
2. KwaZulu-Natal Department of Health. Annual Report 2015/16. Pietermaritzburg. KwaZulu-Natal DoH, 2016. [ Links ]
3. National Department of Health, South Africa. Detailed Definition of Regional and Tertiary Hospital Services Guideline. Pretoria. NDoH, 2013. [ Links ]
4. Naidoo K, Singh J, Lalloo U. A critical analysis of ICU/HC beds in South Africa. 2008 - 2009. S Afr Med I 2013,103(10).751-753. https://doi.org/10.7196/SAMJ.6415 [ Links ]
5. Seidel J, Whiting PC, Edbrooke DL. The costs of intensive care. Contin Educ Anaesth Crit Care Pain 2006-,6(4).160-163. https://doi.org/10.1093/bjaceaccp/mkl030 [ Links ]
6. Dasta JF, McLaughlin TP, Mody SH, Piech CT. Daily cost of an intensive care unit day. The contribution of mechanical ventilation. Crit Care Med 2005,33(6).1266-1271. https://doi.org/10.1097/01.CCM.0000164543.14619.00 [ Links ]
7. Halpern NA, Bettes L, Greenstein R Federal and nationwide intensive care units and healthcare costs. 1986 - 1992. Crit Care Med 1994,22(12).2001-2007. https://doi.org/10.1097/00003246-199422120-00019 [ Links ]
8. National Department of Health, South Africa. Actual and Normative Costing of Primary Healthcare Package of Services. Pretoria. NDoH, 2015. [ Links ]
9. Day C, Gray A, Budgell E. Health and related indicators. South African Health Review. Durban Health Systems Trust, 2011. [ Links ]
10. Rosen S, Long L, Sanne I. The outcomes and outpatient costs of different models of antiretroviral treatment delivery in South Africa. Trop Med Int Health 2008,13(8).1005-1015. https://doi.org/10.1111/j.l365-3156.2008.02114.x [ Links ]
11. Oanda CorporaUon. Average exchange rates 2017. https://www.oanda.com/currency/average (accessed 1 August 2017). [ Links ]
12. Kumar P, Jithesh V, Gupta SK. Does a single specialty Intensive care unit make better business sense than a multi-specialty Intensive care unit? A costing study In a trauma center in India. Saudi J Anaesth 2015-,9(2).189-194. https://doi.org/10.4103/1658-354X.152883 [ Links ]
13. Elliott D. Costingintensive care services. A review of study methods, results and limitaUons. Aust Crit Care 1997,10(2).55-63. https://doi.org/10.1016/S1036-7314(97)70710-0 [ Links ]
14. Halpern NA, Pastores SM. Critical care medicine In the United States 2000 - 2005. An analysis of bed numbers, occupancy rates, payer mix, and costs. Crit Care Med 2010,38(1):65-71. https://doi.org/10.1097/CCM.0b013e3181b090d0 [ Links ]
15. Oostenbrink JB, Buijs-van der Woude T, van Agthoven M, Koopmanschap MA, Rutten FF. Unit costs of inpatient hospital days. Pharmacoeconomlcs 2003:21(4).263-271. https://doi.org/10.2165/00019053-200321040-00004 [ Links ]
16. Prln M, Wunsch H. International comparisons of intensive care. Informing outcomes and Improving standards. Curr Opin Crit Care 2012,18(6).700-706. https://doi.org/10.1097/MCC.0b013e32835914d5 [ Links ]
17. Cubro H, Somun-Kapetanovic R, Thiery G, Talmor D, Gajic O. Cost effectiveness of intensive care in a low resource setting. A prospective cohort of medical critically 111 patients. World J Crit Care Med 2016-,5(2).150-164. https://doi.org/10.5492/wjccm.v5.i2.150 [ Links ]
18. Peter JV, Thomas K, Jeyaseelan L, et al. Cost of Intensive care in India. Int J Technol Assess Health Care 2016,32(4).241-245. https://doi.org/10.1017/S0266462316000398 [ Links ]
19. Canadian Institute for Health Information. Care in Canadian ICUs. Ottawa: CIHI, 2016 [ Links ]
20. Tan SS, Bakker J, Hoogendoorn ME, et al. Direct cost analysis of intensive care unit stay in foul European countries. Applying a standardized costing methodology Value Health 2012,15(1).81-86. https://doi.org/10.1016/j.jval.2011.09.007 [ Links ]
21. Negrlni D, Sheppard L, Mills GH, et al International Programme for Resource Use In Critical Care (IPOC) - a methodology and initial results of cost and provision in four European countries. Acta AnaesthesiolScand 2006,50(1).72-79. https://doi.org/10.1111/j.l399-6576.2006.00901.x [ Links ]
22. Potgieter PD, Hammiii L, Cough A, Hammond JMJ. Cost of critical care In South Africa. S Afr Med I 1995; 5(5):425-430. [ Links ]
23. Csomos A, Janecsko M, Edbrooke D. Comparative costing analysis of intensive care services between Hungary and United Kingdom. Intensive Care Med 2005,31(9).1280-1283. https://doi.org/10.1007/S00134-005-2692-3 [ Links ]
24. Medlclinlc Southern Africa. The Mediclinic Southern Africa Private Tariff Schedule 2016. Mediclinic Southern Africa, 2016. http://www.mediclinic.co.za/Portals/0/Documents/Patients/_root/Private% 20Tariff%20Schedule%202016.pdf (accessed 10 August 2017). [ Links ]
25. Netcare. Netcare Tariff Calculator for 01.01.2016. South Africa. Netcare Hospitals, 2016. http://www.netcarehospitals.co.za/Portals/3/Images/Content-images/PDF/Final-Netcare-RSA-Ind-Priv-Paying-Patients.pdf (accessed 10 August 2017). [ Links ]
26. Kahn JM, Rubenfeld CD, Rohrbach J, Fuchs BD. Cost savings attributable to reductions in Intensive care unit length of stay for mechanically ventilated patients. Med Care 2008,46(12).1226-1233. https://doi.org/10.1097/MLR0b013e31817d9342 [ Links ]
 Correspondence:
S Mahomed
mahomeds@ukzn.ac.za
Accepted 19 June 2018

