


Services on Demand
Article
 English (pdf)
 Article in xml format
 Article references
Indicators

Related links
-
 Cited by Google
 -
 Similars in Google
Share

 Permalink
SAMJ: South African Medical Journal
On-line version ISSN 2078-5135
Print version ISSN 0256-9574
SAMJ, S. Afr. med. j. vol.108 n.6 Pretoria Jun. 2018
http://dx.doi.org/10.7196/samj.2018.v108i6.12913
RESEARCH
Economic evaluation of safety-engineered devices and training in reducing needlestick injuries among healthcare workers in South Africa
P de JagerI, II, III; M ZunguIV, V; R E DyersVI, VII
IMB ChB, MMed (PHM), FCPHM (SA), MSc, DA (SA), DCH (SA); Department of Anaesthesia, Faculty of Health Sciences, University of the Witwatersrand, Johannesburg, South Africa
IIMB ChB, MMed (PHM), FCPHM (SA), MSc, DA (SA), DCH (SA); School of Public Health, Faculty of Health Sciences, University of the Witwatersrand, Johannesburg, South Africa
IIIMB ChB, MMed (PHM), FCPHM (SA), MSc, DA (SA), DCH (SA); Department of Social Policy, London School of Economics and Political Science, London, UK
IVMB ChB, MMed (PHM), FCPHM (SA);HIV/TB Unit, National Institute for Occupational Health, National Health Laboratory Services, Johannesburg, South Africa
VMB ChB, MMed (PHM), FCPHM (SA); School of Health Systems and Public Health, Faculty of Health Sciences, University of Pretoria, South Africa
VIMB ChB, MMed (PHM), FCPHM (SA), MSc; Division of Health Systems and Public Health, Department of Global Health, Faculty of Medicine and Health Sciences, Stellenbosch University, Cape Town, South Africa
VIIMB ChB, MMed (PHM), FCPHM (SA), MSc; Western Cape Government: Health, South Africa
ABSTRACT
BACKGROUND. Healthcare workers (HCWs) are at increased risk of contracting various communicable diseases. Needlestick injuries (NSIs) are a common mechanism of exposure. Training in basic universal precautions and utilisation of safety-engineered devices (SEDs) are interventions known to reduce the risk of NSI.
OBJECTIVES. To assess the cost-utility of SEDs v. a training programme in universal precautions (TP) v. a combination strategy to reduce NSIs among South African HCWs.
METHODS. A Markov model comparing SEDs v. a TP v. a combination strategy against current practice was developed. A hypothetical cohort of HCWs working in the SA public sector was followed from a payer's perspective for a period of 45 years, and discounted costs and benefits were assessed. Data were obtained from the National Department of Health, suppliers and published literature. One-way and probabilistic sensitivity analysis was conducted.
RESULTS. Over the study time horizon, our model estimated that 2 209, 3 314 and 4 349 needlestick injuries per 1 000 HCWs could be prevented if a TP, SEDs or a combination strategy, respectively, was adopted compared with current practice. All three candidate interventions were cost-effective at a willingness to pay (WTP) of one times the gross domestic product per capita (USD6 483.90/quality-adjusted life-year (QUALY) gained). SEDs as a stand-alone intervention was dominated by a combination strategy. Compared with current practice, the incremental cost-effectiveness of training was USD32.90/QALY v. USD432.32/QALY for SEDs and USD377.08/QALY for a combination strategy. Results were sensitive to the effectiveness of the interventions. Probabilistic sensitivity analysis showed that at a WTP of USD6 483.90/QALY gained, a combination strategy would be cost-effective 95.4% of the time.
CONCLUSIONS. A combination strategy in which both SEDs and a TP are adopted is preferred.
Healthcare workers (HCWs) are at increased risk of contracting infectious diseases owing to workplace exposure.[1,2] High disease prevalence and reduced investment in and availability of adequate safety measures place HCWs in developing countries at disproportionate risk compared with their counterparts in high-income countries.[3] HCWs in these settings are at particular risk of contracting tuberculosis and blood-borne pathogens such as HIV, hepatitis B and hepatitis C.[1,4] An important mechanism of exposure to blood-borne pathogens is accidental needlestick injury (NSI).
The incidence of NSI varies across settings, and significant underreporting to occupational and public health authorities affects the validity of estimates. Studies from South Africa (SA) place the incidence of NSI between 24% in primary care nurses and up to 69% among junior doctors per annum.'5,61 Risk factors for sustaining an NSI vary depending on the context. Less-experienced staff and those who have not received training in universal precautions have consistently been found to be at increased risk of sustaining an NSI.[7-9] In developed countries, the evidence indicates that doctors are at higher risk of NSI than nurses.'101 However, given the clinical load placed on mid-level HCWs in low- and middle-income countries, this is not necessarily the case in developing countries.[7]
Given their risk and severity, the most important potential consequences of an NSI are acquiring HIV or hepatitis B or C. The transmission probability following an occupational NSI is 6 - 30% for hepatitis B and up to 2.83% for HIV.[11,12] Globally, 4.4% of HIV 37% of hepatitis C and 39% of hepatitis B infections in HCWs are attributable to NSI.[13] Furthermore, HCWs commonly experience a range of psychological symptoms following occupational exposure to blood or body fluids.[14] NSIs also impose economic costs on health systems and society.[15-20]
Training in universal precautions and adoption of safety-engineered devices (SEDs) are two key interventions that have been shown to reduce NSIs.[21-25] On pooled analysis of five studies, Harb et al.[22]reported an effectiveness of 46% (relative risk (RR) 0.54, 95% CI 0.41 - 0.71) for SEDs in reducing NSIs among HCWs.[22] Similarly, Tarigan et al.[23]estimated that SEDs were 49% (RR 0.51, 95% CI 0.40 - 0.64), training 44% (RR 0.66, 95% CI 0.50 - 0.89), and a combination of training and SEDs 62% (RR 0.38, 95% CI 0.28 - 0.50) effective in reducing NSIs among HCWs. In contrast, a fourth review found only low-quality evidence to suggest that SEDs may reduce NSIs, but moderate (statistically non-significant) evidence that they could increase blood splashes by 60% (RR 1.6, 95% CI 0.08 - 2.36).[24] The few studies that have attempted to assess the cost-effectiveness of SEDs or training in reducing NSIs were either single-centre studies with limited cost perspectives[26-29] or did not undertake any uncertainty analysis.[27] With these limited cost perspectives, lack of methodological robustness and the fact that these studies were all done in high-income settings with a low HIV prevalence, there is currently insufficient evidence to guide decision-making on the adoption of SEDs and training programmes (TPs) in SA.
Objectives
To assess the cost-utility of SEDs, a basic universal precautions TP or a combination of both interventions v. current practice in the SA public healthcare sector.
Methods
Ethics review was not required for this study, as it did not require the collection or analysis of any primary data. Findings are reported in compliance with the Consolidated Health Economic Evaluation Reporting Standards (CHEERS).[30]
Study setting
SA, a middle-income country with a gross domestic product (GDP) per capita in 2014 of USD6 483.90, has the largest HIV-positive population in the world, with an estimated prevalence among the general population of 12.2%.[31,32] There are no national policies or regulations aimed at reducing sharps injuries in HCWs. However, current SA HIV guidelines provide for triple-therapy post-exposure prophylaxis (PEP) in cases where HCWs are exposed or potentially exposed to HIV.[33]
Study design
A decision analytical Markov model with 1-year cycles was developed to assess the cost-utility, from a public payer perspective, of current practice v.: (i) a stand-alone biennial universal precautions TP; (ii) adoption of SEDs as a stand-alone intervention; or (iii) a TP and SEDs in combination. A hypothetical HIV-uninfected cohort of HCWs, defined as doctors and nurses joining the SA public sector in 2015, transition through seven possible Markov states over a 45-year time horizon from the age of 20 as new entrants to the workforce (in 2015) to the retirement age of 65. Medical and nursing students in SA commence clinical rotations, and therefore become at risk to exposure, during their second or third year of study.
In this analysis we only included devices utilised for: (i) initiating a peripheral intravenous infusion; (ii) delivering an injection (intramuscular and/or subcutaneous); or (iii) phlebotomy. Based on our estimates, only 7.2% (in terms of volume) of devices purchased by the public sector in 2015 were SEDs; however, our epidemiological data precede 2015 and reflect a much lower market share of SEDs. Training was defined as basic training in universal precautions. To our knowledge, with the exception of one tertiary academic hospital, there is currently no routine training on universal health precautions in the public sector. We therefore assumed the current practice (basecase) scenario to have no training and 0% coverage in SEDs.
Transition probabilities
Transition probabilities are summarised in Table 1. Self-reported incidence data of NSIs suffer from significant under-reporting, sowe did not use any hospital surveillance or administrative data in estimating the probability of NSIs. All epidemiological input data for the model were obtained from published literature. An important determinant in the probability of sustaining an NSI and transitioning from the 'well' to the 'NSI' state is work experience (see Fig. 1 for the Markov model and the appendix (available from the corresponding author on request, email pieter.dejager@wits.ac.za) for the transition probability matrix).[7-9] To account for work experience, transition to the NSI state was time-dependent and based on pooled estimates from available SA epidemiological studies (see appendix for pooled estimate results).[5,6,34-36] Linear interpolation was used to estimate probabilities between years. After sustaining an NSI, transition back to the 'well' state or progression to the 'HIV-exposed' state occurred as a function of the estimated HIV prevalence rates found in outpatient department and hospitalised patients in SA. Based on a pooled estimate of available studies, we estimated this to be 30% (95% CI 15 - 47)[37-40] (see appendix for additional details).
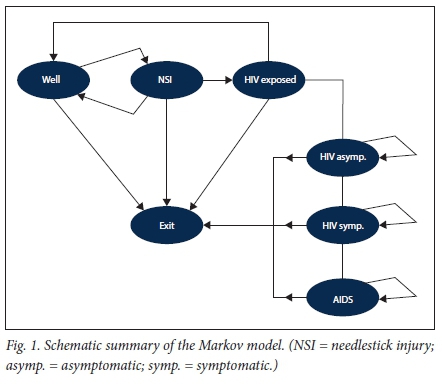
Transition probability from 'HIV-exposed' to 'HIV-infected' was obtained from a meta-analysis estimating the probability of seroconversion following an NSI where the source patient is HIV-infected (0.23%).[41] In our model we assumed that there is universal access to timely PEP for all exposed HCWs, and we therefore adjusted the probability of seroconversion by the efficacy of PEP (81%).[42,43]
Transition from 'HIV asymptomatic' to 'HIV symptomatic' and finally 'AIDS' was based on epidemiological estimates of transition from SA.[49] It was possible to transition from the 'well', 'NSI' and 'HIV-exposed' states to the absorptive state 'exit', the probability of which was taken to be the estimated annual mean attrition rate for doctors (3.8%) and nurses (2.4%) from the public sector.[44,46] In contrast, transition from 'HIV symptomatic', 'HIV asymptomatic' and 'AIDS' to the saturation state 'exit' was taken to be the mortality rate for these groups[49,50] plus the background attrition rate.[44,46]Fig. 1 provides a schematic summary of the Markov model.
Costs
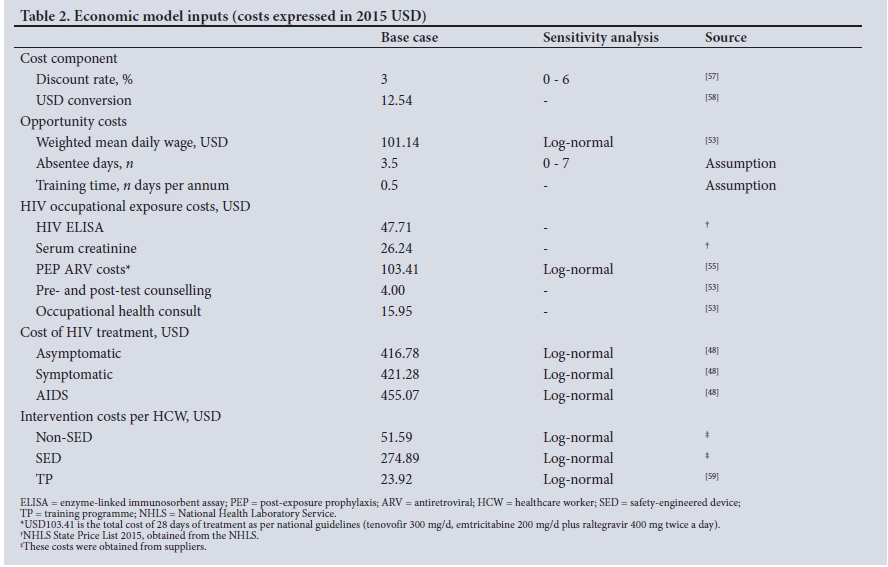
The cost perspective of this study is that of the public payer, namely the National Department of Health (NDoH), as the purchaser of devices and primary employer of all HCWs in the public sector. All cost data were adjusted for inflation and converted to US dollars to allow for international comparison, and are reported in 2015 terms. [51] Costs were attributed to HCWs to obtain cost per HCW estimates. It is estimated that there were ~106 822 doctors (13.2%) and nurses (86.8%) employed in the public sector in SA in 2015.[44-46,52] In the public sector, HCWs are salaried workers with wage scales published annually by the Department of Public Service Administration.[53] From these data, we estimated that the weighted mean daily wage of doctors and nurses in 2015 was USD101.14. Wage data were included in the model to account for the opportunity cost of training and absenteeism costs resulting from HIV exposure and subsequent side-effects of taking PEP.
Cost items and quantities required in the management of HIV PEP were identified through the review of current clinical management guidelines adopted in SA.[54] Laboratory costs were obtained from the National Health Laboratory Service (NHLS), the sole laboratory service provider for the public sector (NHLS State Price List 2015, obtained from the NHLS). For pharmaceutical costs, single-exit prices for antiretroviral drugs were obtained from the NDoH.[55] Other PEP programme costs included in the analysis were pre- and post-test counselling and occupational health follow-up visits. Treatment costs for HIV were obtained from the literature and differentiated between asymptomatic, symptomatic and AIDS care. [48] For our analysis, in line with World Health Organization (WHO) recommendations, we assumed that all HCWs who seroconvert are initiated on highly active antiretroviral treatment at the time of diagnosis, regardless of CD4+ count.[56]
Obtaining estimates from both suppliers and the NDoH, we triangulated cost data for SED and non-SED devices. Devices are purchased on a tender system by provincial departments of health, so there is heterogeneity in the pricing of various items across provincial administrations. We estimated the total volume for each category of devices (i.e. devices utilised for initiating a peripheral intravenous infusion, delivering an injection, or used for phlebotomy) purchased by the public sector in 2015 stratified by SED and non-SED. We obtained low and high price estimates for each device category for both SED and non-SED devices. From these data we calculated the total cost for each category under two scenarios: zero SED coverage and 100% SED coverage. By applying the estimated number of HCWs employed in the public sector in 2015, we calculated the cost per HCW for each device category and each scenario. Training costs were estimated from current training courses available in SA. Under the training intervention, we assumed that HCWs would attend biennial full-day training on basic universal precautions to be provided on-line. On-line courses are available and are undergoing further refinement by SA universities.[59]Table 2 provides a summary of the cost components included in the model.
Effectiveness
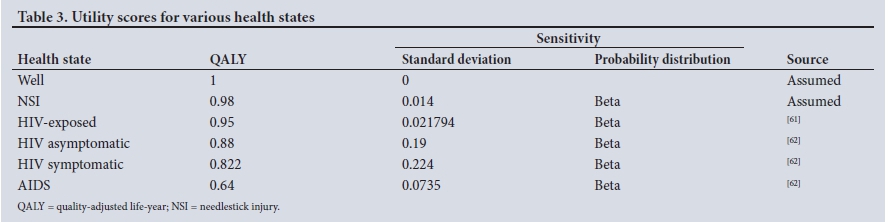
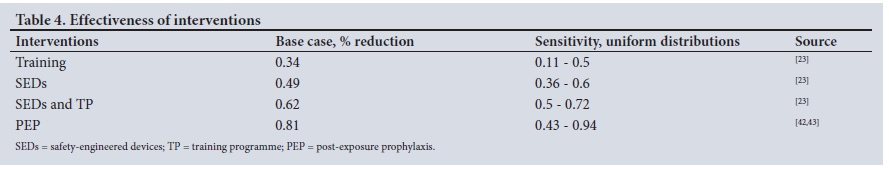
Benefits accrued under each scenario were measured in quality-adjusted life-years (QALYs). QALYs are utility-based composite measures of morbidity and mortality associated with given health states and allow for comparability across studies and health outcomes. We assumed the 'well' state to be associated with perfect health and therefore assigned a utility score of 1. No studies were found that reported QALYs for NSI, but this event is typically associated with localised pain and psychological distress.[60] We therefore assigned a conservative, near-perfect level of health (QALY 0.98, sensitivity range 0.95 - 1) to the 'NSI' health state and assessed this assumption in both the univariate and probabilistic sensitivity analysis. Utility scores for being HIV-exposed had previously been estimated through expert consultation as reported by Haddix et al.[M QALYs for asymptomatic, symptomatic and advanced (AIDS) HIV were obtained from a meta-analysis by Tengs and Wallace.[62]
A recent systematic review and meta-analysis by Tarigan et al.[23] estimated the pooled effectiveness of SEDs, training and combined training and SEDs in reducing NSIs among healthcare workers. [23]
The pooled estimates are based on 17 studies, 16 of which were before-and-after in design, while one was a randomised controlled trial.[25] The effectiveness of HIV PEP was obtained from two case-control studies.[42,43] Tables 3 and 4 provide a summary of the utility scores and effectiveness data, respectively.
Analysis
We developed and analysed our decision analytical Markov model in TreeAge Pro 2015 (TreeAge Software, USA). Costs and benefits accruing to each Markov state under each of the four scenarios under consideration were calculated by conducting a cohort simulation (N=10 000). From this analysis we estimated the number of NSI and HIV exposure events under each scenario over the 45-year time horizon as well as the cumulative probability of contracting HIV due to NSIs. Following WHO guidelines, all costs and benefits were discounted at 3% and varied between 0% and 6% in the sensitivity analysis.[57] To avoid overestimating the final cycle's lifetime, half-cycle corrections were applied to all costs and benefits. Incremental cost-effectiveness ratios (ICERs) were calculated to assess the cost-effectiveness of each intervention scenario with current practice. There are currently no willingness to pay (WTP) thresholds for SA, so we adopted WHO guidelines to assess cost-effectiveness.[63] The per capita GDP for SA in 2014 was USD6 483.90 and was taken as the cost-effectiveness threshold.[63,64]
In order to assess the robustness of our estimates, we conducted one-way and probabilistic sensitivity analysis. One-way sensitivity analysis was undertaken to assess the effects of biasing input parameters to upper and lower limits. Multi-way Monte Carlo simulation (probabilistic sensitivity analysis) consisting of 10 000 simulations in which all input parameters were varied simultaneously as a function of their underlying probability distributions was undertaken (see appendix for additional details).
Results
Base case
Both SEDs and training as stand-alone interventions or in combination improve health outcomes in HCWs by reducing the number of NSI events, HIV exposures and the lifetime probability of contracting HIV due to NSIs. Over a 45-year working life, it is estimated that 2 209, 3 314 and 4 349 NSI per 1 000 HCWs would be prevented if a TP alone, SEDs alone, or training and SEDs in combination, respectively, were to be adopted in the public sector compared with current practice. This translates into 672, 1 009 and 1 325 HIV exposure events averted and reductions in the cumulative probability of seroconversion from 0.91% (current practice) to 0.66% (TP), 0.53% (SEDs) and 0.41% (SEDs and TP).
All three intervention strategies were more costly than current practice (Table 5 and Fig. 2). The average annual discounted cost per HCW under current practice was estimated at USD1 163.29 compared with USD1 247.64, USD3 151.17 and USD3 619.04 per HCW for a stand-alone TP, SEDs alone or training and SEDs in combination, respectively. Compared with current practice, a standalone TP would increase discounted QALYs by 2.56 at an additional discounted cost of USD84.34. Training was found to be a highly cost-effective intervention, with an ICER of USD32.90/QALY gained. Although cost-effective, the SEDs-only strategy was dominated by a combination strategy of both SEDs and training. SEDs alone were estimated to increase discounted QALYs by 4.90 at an additionaldiscounted cost of USD1 987.87 and an ICER of USD432.32/QALY gained.

It is estimated that adopting a combination strategy of both SEDs and training would increase discounted QALYs by 6.51 compared with current practice at an additional discounted cost of USD2 455.74. Therefore, under the base case, SEDs in combination with a TP was the preferred intervention with an ICER of USD377.08 per QALY gained.
Sensitivity analysis
The effectiveness of SEDs, training and training in combination with SEDs were the most important variables on univariate sensivity analysis, impacting on the ICERs for each strategy. Net benefit oneway sensitvity analysis was used to take account of effectiveness, cost and WTP as the input variable changes.
Although the effectiveness of training, SEDs and a combination of training and SEDs impacted on the net benefit, the impact was not sufficient to change the strategy. Varying the effectiveness of each intervention strategy within plausible ranges, a combination strategy of both SEDs and training remains the strategy of choice at a WTP threshold of USD6 483.90 per QALY gained (see appendix).
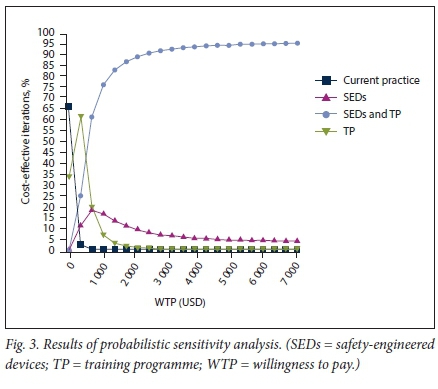
Results from the Monte Carlo probabilistic sensitivity analysis, whereby all the uncertainty captured by the model inputs was assessed simultaneously, are reported in Fig. 3. A combination strategy is prefered at a WTP threshold of USD6 483.9 per QALY gained, where it would be a cost-effective strategy 95.4% of the time.
Discussion
Our study assessed the cost-utility of three strategies, compared with current practice, aimed at reducing NSIs among HCWs in a high HIV prevalence setting. We found that a combination strategy of adopting both SEDs and training in universal precautions would be the preferred strategy, with an ICER of USD377.08 per QALY gained. This is significantly lower than SA's per capita GDP (USD6 483.90), making it a highly cost-effective option in reducing NSIs among doctors and nurses working in the public sector.
A combination strategy would reduce the number of NSIs and exposure events and reduce the number of occupational HIV cases. Prüss-Üstün et aí.[13] estimated that globally there are 1 000 (range 200 - 5 000) cases of HIV per year in HCWs due to NSI, with 720 (range 130 - 3 510) occurring in Africa.[13] Over a 45-year time horizon, we found that a combination strategy would reduce the cumulative probability of acquiring HIV from NSI by 54.9% (from 0.91% to 0.41%). Based on our model estimates, we calculate that there are, under current practice, ~20 cases of HIV per annum in HCWs in SA and that this could be reduced to nine cases if a combination strategy were to be implemented. There are no published statistics available in SA on the number of occupationally acquired cases of HIV infection in HCWs. Given that there were 56 confirmed and 136 possible cases of occupationally acquired HIV cases in US HCWs between 1985 and 1999 and it is estimated that in Europe there are 7 cases per annum,[13] our calculation of 20 cases per year is probably an under-estimation due to our model assumption that there is 100% access and compliance to timely diagnostics and PEP.
This is the first study to assess the cost-effectiveness of SEDs in a developing country context. All the previous studies were conducted in single centres in high-income countries, with limited costing perspectives and no utilisation of uncertainty and sensitivity analysis and expressed effectiveness as cost per NSI averted, thus limiting the comparability of previous findings with ours.[26-29] Nevertheless, we estimate that the cost per NSI averted would be USD38.18, USD599.84 and USD564.67 for training alone, SEDs alone or a combination strategy, respectively. Previous estimates of the cost-effectiveness of SEDs from the USA have ranged from USD789 to USD2 571, and in Europe it has been calculated that savings would range from EUR2.65 to EUR869.79 per NSI averted.'26-291 Our estimates, although not directly comparable, fall within the ranges estimated in the European study, but are lower than those from the USA.
Study limitations
Our study had a number of limitations. First, we did not take account of all the costs and consequences of NSI. To make our model more manageable, we did not consider hepatitis B or C, even though together with HIV they are the most common blood-borne pathogens transmitted through NSI - with a prevalence of >8% in the general population, hepatitis B is endemic in SA.[65]-Further, we only included doctors and nurses from the time they are students in our analysis, but other HCWs such as laboratory technicians and cleaning staff are also at risk of NSI. In settings with inadequate medical waste management, communities are also at risk of sustaining NSI. Therefore, excluding the costs of other infectious diseases and HCWs or communities affected by NSI from our model, we have probably underestimated the true cost-effectiveness of the interventions. Second, we assumed that HIV prevalence in the source population would remain constant over the 45-year period and varied it within a constant range in the sensitivity analysis. The age-standardised prevalence of HIV has stabilised in SA, increasing by only 0.002 per 100 000 between 2005 and 2015,[31] so this assumption will probably not affect the model estimates greatly. Third, the evidence on the effectiveness of the interventions was largely based on observational studies. We took estimates from the most recent and complete meta-analysis on the effectiveness of SEDs, training and a combination of the two strategies and varied these in the sensitivity analysis. Fourth, there are limited epidemiological studies investigating the incidence of NSI in SA. We searched the literature and pooled the estimates from all available studies, stratified estimates based on work experience and varied these estimates in the sensitivity analysis. Finally, there are no available utility estimates for NSI events per se, so we assumed NSI to be associated with a QALY of 0.98 and varied this assumption in the sensitivity analysis.
Highlights
• HCWs are at increased risk of contracting infectious diseases, including HIV secondary to accidental NSI. Although SEDs and training in universal precautions are known to reduce NSIs, it is not known whether these would be cost-effective interventions in a middle-income country with a high HIV burden.
• Our economic evaluation shows that a combination strategy that includes both the adoption of SEDs and a biannual TP for HCWs in SA's public sector would be cost-effective from a public payer's perspective.
• Our findings provide policy guidance on an important yet often overlooked aspect of health policy in SA, the health of HCWs.
Conclusions
Our study shows that a combination strategy in which both SEDs and a basic universal precautions TP are adopted is the preferred strategy to reduce NSIs in HCWs in SA's public sector. Given the lack of policy on the prevention of NSI in SA, our study provides important evidence to inform decision-making. As a starting point the SA NDoH is currently engaged in policy processes on occupational health for health workers in respect of HIV and tuberculosis, and our study is very pertinent to that process, especially in advocating for the inclusion of a policy tenant on NSI prevention. Since procurement in SA may be centralised in some provincial departments of health, the authors would encourage improved communication with infection prevention and control and occupational health and safety. Finally, our findings or model may also be applicable to other settings with similar levels of economic development and where there is a high burden of HIV.
Acknowledgements. We express our gratitude to Dr Spo Kgalamono, Prof. David Rees and Ms Busisiwe Nyantumbu, colleagues at the National Institute for Occupational Health, for assisting with the collection of cost data. Drs Diana Quirmbach and Jeroen Luyten from the London School of Economics and Political Science provided feedback on an earlier draft.
Author contributions. PJ: conceptualisation, model development, data collection, statistical analysis, drafting manuscript, interpretation of results, review and approval of final manuscript; MZ: data collection, interpretation of findings, review and approval of final manuscript; RED: data collection, interpretation of findings, review and approval of final manuscript.
Funding. The School of Public Health at the University of the Wit-watersrand provided partial funding for this project.
Conflicts of interest. None.
References
1. Tarantola A, Abiteboul D, Rachline A. Infection risks following accidental exposure to blood or body fluids in health care workers: A review of pathogens transmitted in published cases. Am J Infect Control 2006;34(6):367-375. https://doi.org/10.1016/j.ajic.2004.11.011 [ Links ]
2. Sepkowitz KA, Eisenberg L. Occupational deaths among healthcare workers. Emerg Infect Dis 2005;11(7):1003-1008. https://doi.org/10.3201/eid1107.401038 [ Links ]
3. Lee R. Occupational transmission of bloodborne diseases to healthcare workers in developing countries: Meeting the challenges. J Hosp Infect 2009;72(4):285-291. https://doi.org/10.1016/j.jhin.2009.03.016 [ Links ]
4. Joshi R, Reingold AL, Menzies D, Pai M. Tuberculosis among health-care workers in low-and middle-income countries: A systematic review. PLoS Med 2006;3(12):e494. https://doi.org/10.1371/journal.pmed.0030494 [ Links ]
5. Karstaedt AS, Pantanowitz L. Occupational exposure of interns to blood in an area of high HIV seroprevalence. S Afr Med J 2001;91(1):57-61. [ Links ]
6. Kruger WH. Needlestick injuries among nurses in a regional hospital in South Africa. 2012. http://reference.sabinet.co.za/sa_epublication_article/ohsa_v18_n3_a4 (accessed 8 September 2015). [ Links ]
7. Nsubuga FM, Jaakkola MS. Needle stick injuries among nurses in sub-Saharan Africa. Trop Med Int Health 2005;10(8):773-781. https://doi.org/10.1111/j.1365-3156.2005.01453.x [ Links ]
8. Bekele T, Gebremariam A, Kaso M, Ahmed K. Factors associated with occupational needle stick and sharps injuries among hospital healthcare workers in Bale Zone, Southeast Ethiopia. PLoS One 2015;10(10):e0140382. https://doi.org/10.1371/journal.pone.0140382 [ Links ]
9. Makary MA, Al-Attar A, Holzmueller CG, et al. Needlestick injuries among surgeons in training. N Engl J Med 2007;356(26):2693-2699. https://doi.org/10.1097/01.sa.0000296372.51242.0a [ Links ]
10. Wicker S, Jung J, Allwinn R, Gottschalk R, Rabenau HF. Prevalence and prevention of needlestick injuries among health care workers in a German university hospital. Int Arch Occup Environ Health 2007;81(3):347-354. https://doi.org/10.1007/s00420-007-0219-7 [ Links ]
11. Beltrami EM, Williams IT, Shapiro CN, Chamberland ME. Risk and management of blood-borne infections in health care workers. Clin Microbiol Rev 2000;13(3):385-407. https://doi.org/10.1128/cmr.13.3.385-407.2000 [ Links ]
12. Baggaley RF, Boily M-C, White RG, Alary M. Risk of HIV-1 transmission for parenteral exposure and blood transfusion: A systematic review and meta-analysis. AIDS 2006;20(6):805-812. https://doi.org/10.1097/01.aids.0000218543.46963.6d [ Links ]
13. Prüss-Üstün A, Rapiti E, Hutin Y. Estimation of the global burden of disease attributable to contaminated sharps injuries among health-care workers. Am J Ind Med 2005;48(6):482-490. https://doi.org/10.1002/ajim.20230 [ Links ]
14. Gershon RRM, Flanagan PA, Karkashian C, et al Health care workers' experience with postexposure management of bloodborne pathogen exposures: A pilot study. Am J Infect Control 2000;28(6):421-428. https://doi.org/10.1067/mic.2000.109907 [ Links ]
15. Trueman P, Taylor M, Twena N, Chubb B. The cost of needlestick injuries associated with insulin administration. Br J Commun Nurs 2008;13(9):413-417. https://doi.org/10.12968/bjcn.2008.13.9.30911 [ Links ]
16. Mannocci A, de Carli G, di Bari V, et al How much do needlestick injuries cost? A systematic review of the economic evaluations of needlestick and sharps injuries among healthcare personnel. Infect Control Hosp Epidemiol 2016;37(6):635-646. https://doi.org/10.1017/ice.2016.48 [ Links ]
17. Glenngárd AH, Persson U. Costs associated with sharps injuries in the Swedish health care setting and potential cost savings from needle-stick prevention devices with needle and syringe. Scand J Infect Dis 2009;41(4):296-302. https://doi.org/10.1080/00365540902780232 [ Links ]
18. Oh HS, Yoon Chang SW, Choi JS, Park ES, Jin HY. Costs of postexposure management of occupational sharps injuries in health care workers in the Republic of Korea. Am J Infect Control 2013;41(1):61-65. https://doi.org/10.1016/j.ajic.2012.01.030 [ Links ]
19. Leigh JP, Gillen M, Franks P, et al. Costs of needlestick injuries and subsequent hepatitis and HIV infection. Curr Med Res Opin 2007;23(9):2093-2105. https://doi.org/10.1185/030079907x219517 [ Links ]
20. Ekwueme DU, Weniger BG, Chen RT. Model-based estimates of risks of disease transmission and economic costs of seven injection devices in sub-Saharan Africa. Bull World Health Organ 2002;80(11):859-870. http://www.who.int/bulletin/archives/80(11)859.pdf [ Links ]
21. Tuma S, Sepkowitz KA. Efficacy of safety-engineered device implementation in the prevention of percutaneous injuries: A review of published studies. Clin Infect Dis 2006;42(8):1159-1170. https://doi.org/10.1086/501456 [ Links ]
22. Harb AC, Tarabay R, Diab B, Ballout RA, Khamassi S, Akl EA. Safety engineered injection devices for intramuscular, subcutaneous and intradermal injections in healthcare delivery settings: A systematic review and meta-analysis. BMC Nurs 2015;14:71. https://doi.org/10.1186/s12912-015-0119-1 [ Links ]
23. Tarigan LH, Cifuentes M, Quinn M, Kriebel D. Prevention of needle-stick injuries in healthcare facilities: A meta-analysis. Infect Control Hosp Epidemiol 2015;36(7):823-829. https://doi.org/10.1017/ice.2015.50 [ Links ]
24. Reddy VK, Lavoie MC, Verbeek JH, Pahwa M. Devices for preventing percutaneous exposure injuries caused by needles in healthcare personnel. Cochrane Database Syst Rev 2017, Issue 11. Art. No.: CD009740. https://doi.org/10.1002/14651858.cd009740.pub3 [ Links ]
25. Van der Molen HF, Zwinderman KAH, Sluiter JK, Frings-Dresen MHW. Better effect of the use of a needle safety device in combination with an interactive workshop to prevent needle stick injuries. Saf Sci 2011;49(8-9):1180-1186. https://doi.org/10.1016/j.ssci.2011.03.010 [ Links ]
26. Mendelson MH, Short LJ, Schechter CB, et al. Study of a needleless intermittent intravenous-access system for peripheral infusions: Analysis of staff, patient, and institutional outcomes. Infect Control Hosp Epidemiol 1998;19(6):401-406. https://doi.org/10.1086/647839 [ Links ]
27. Orenstein R, Reynolds L, Karabaic M, Lamb A, Markowitz SM, Wong ES. Do protective devices prevent needlestick injuries among health care workers? Am J Infect Control 1995;23(6):344-351. https://doi.org/10.1016/0196-6553(95)90264-3 [ Links ]
28. Roudot-Thoraval F, Montagne O, Schaeffer A, Dubreuil-Lemaire M-L, Hachard D, Durand-Zaleski I. Costs and benefits of measures to prevent needlestick injuries in a university hospital. Infect Control Hosp Epidemiol 1999;20(9):614-617. https://doi.org/10.1086/501681 [ Links ]
29. Armadans Gil L, Cano F, Isabel M, et al. Safety-engineered devices to prevent percutaneous injuries: Cost-effectiveness analysis on prevention of high-risk exposure. Gac Sanit 2006;20(5):374-381. https://doi.org/10.1157/13093206 [ Links ]
30. Husereau D, Drummond M, Petrou S, et al. Consolidated health economic evaluation reporting standards (CHEERS) statement. BMC Med 2013;11(1):80. https://doi.org/10.1186/1741-7015-11-80 [ Links ]
31. Wang H, Wolock TM, Carter A, et al. Estimates of global, regional, and national incidence, prevalence, and mortality of HIV, 1980 - 2015: The Global Burden of Disease Study 2015. Lancet HIV 2016;3(8):e361-e387. https://doi.org/10.1016/S2352-3018(16)30087-X [ Links ]
32. Shisana O, Labadarios D, Simbayi LC, et al. South African national HIV prevalence, incidence and behaviour survey, 2012. 2015. http://ecommons.hsrc.ac.za/handle/123456789/2490 (accessed 23 June 2016). [ Links ]
33. Venter F. Post-exposure prophylaxis. South Afr J HIV Med 2008;37(Winter):36-45. http://sahivsocorg/Files/Guidelines%20for%20post-exposure%20prophylaxis%20(2008).pdf (accessed 7 May 2018). [ Links ]
34. Rabbitts JA. Occupational exposure to blood in medical students. S Afr Med J 2003;93(8):621-624. [ Links ]
35. Marais B, Cotton M. Occupational exposure to human immunodeficiency virus in pediatricians: A previously undescribed high risk group. Pediatr Infect Dis J 2003;22(4):382-383. https://doi.org/10.1097/01.inf.0000059963.24260.e9 [ Links ]
36. Nyantumbu B, Geyer N, Botham L, Eijkemans G. WHO-ICN project: Preventing needle-stick injury in healthcare workers. No. E1-4. International Occupational Hygiene Association (IOHA), Pilanesberg National Park, South Africa, 19 - 23 September 2005. [ Links ]
37. Shisana O, Hall EJ, Maluleke R, Chauveau J, Schwabe C. HIV/AIDS prevalence among South African health workers. S Afr Med J 2004;94(10):846-850. [ Links ]
38. Rollins N, Dedicoat M, Danaviah S, et al. Prevalence, incidence, and mother-to-child transmission of HIV-1 in rural South Africa. Lancet 2002;360(9330):389-390. https://doi.org/10.1016/s0140-6736(02)09599-5 [ Links ]
39. Rollins NC, Coovadia HM, Bland RM, et al. Pregnancy outcomes in HIV-infected and uninfected women in rural and urban South Africa: J Acquir Immune Defic Syndr 2007;44(3):321-328. https://doi.org/10.1097/qai.0b013e31802ea4b0 [ Links ]
40. Parikh A, Veenstra N. The evolving impact of HIV/AIDS on outpatient health services in KwaZulu-=Natal, South Africa. S Afr Med J 2008;98(6):468-472. [ Links ]
41. Patel P, Borkowf CB, Brooks JT, Lasry A, Lansky A, Mermin J. Estimating per-act HIV transmission risk: A systematic review. AIDS 2014;28(10):1509-1519. https://doi.org/10.1097/qad.0000000000000298 [ Links ]
42. Young T, Arens FJ, Kennedy GE, Laurie JW, Rutherford GW. Antiretroviral post-exposure prophylaxis (PEP) for occupational HIV exposure. Cochrane Database Syst Rev 2007, Issue 1. Art. No.: CD002835. https://doi.org/10.1002/14651858.cd002835.pub3 [ Links ]
43. Cardo DM, Culver DH, Ciesielski CA, et al. A case-control study of HIV seroconversion in health care workers after percutaneous exposure. N Engl J Med 1997;337(21):1485-1490. https://doi.org/10.1056/nejm199711203372101 [ Links ]
44. Econex. The human resource supply constraint: The case of doctors. 2010. http://econex.co.za/publication/health-reform-note-8/ (accessed 19 November 2015). [ Links ]
45. Econex. Update GP and specialist numbers: 2011 and 2012. 2013. http://www.hpcsa.co.za/Uploads/editor/UserFiles/downlo ads/service_fees-tariff/submissions/sappf_f_econex_updated_gp_speciali st_ numbers_27%2003%202013.pdf (accessed 19 November 2015). [ Links ]
46. Econex. The human resource supply constraint: The case of nurses. 2010. http://econex.co.za/publication/health-reform-note-9/ (accessed 19 November 2015). [ Links ]
47. Wildschut A, Mqolozana T. Shortage of nurses in South Africa: Relative or absolute? 2008. http://www.lmip.org.za/sites/default/files/documentfiles/nursesshortage.pdf (accessed 19 November 2015). [ Links ]
48. Moodley N, Gray G, Bertram M. The case for adolescent HIV vaccination in South Africa: A cost-effectiveness analysis. Medicine 2016;95(4):e2528. https://doi.org/10.1097/md.0000000000002528 [ Links ]
49. Brinkhof MWG, Boulle A, Weigel R, et al. Mortality of HIV-infected patients starting antiretroviral therapy in sub-Saharan Africa: Comparison with HIV-unrelated mortality. PLOS Med 2009;6(4):e1000066. https://doi.org/10.1371/journal.pmed.1000066 [ Links ]
50. Statistics South Africa. Mortality and causes of death in South Africa, 2013: Findings from death notification. 2014. http://www.statssa.gov.za/publications/P03093/P030932013.pdf (accessed 13 November 2015). [ Links ]
51. Statistics South Africa. Consumer price inflation 1960 onwards. 2016. http://www.statssa.gov.za/publications/P0141/CPIHistory.pdf? (accessed 13 November 2015). [ Links ]
52. Econex. Updated GP and specialist numbers for SA. 2010. http://econex.co.za/publication/health-reform-note-7/ (accessed 19 November 2015). [ Links ]
53. Department of Public Service Administration. Remuneration documents. 2015. http://www.dpsa.gov.za/dpsa2g/r_documents.asp (accessed 25 May 2016). [ Links ]
54. Moorhouse M, Bekker LG, Black V, et al. Guideline on the management of occupational and nonoccupational exposure to the human immunodeficiency virus and recommendations for postexposure prophylaxis: 2015 update. South Afr J HIV Med 2015;16(1):1-14. https://doi.org/10.4102/hivmed.v16i1.399 [ Links ]
55. National Department of Health, South Africa. South African medicine price registry: Single exit price database. 2015. http://www.mpr.gov.za/PublishedDocuments.aspx#DocCatId=21 (accessed 25 November 2015). [ Links ]
56. World Health Organization. Guideline on when to start antiretroviral therapy and on pre-exposure prophylaxis for HIV. 2015. http://apps.who.int/iris/bitstream/10665/186275/1/9789241509565_eng.pdf (accessed 25 May 2016). [ Links ]
57. Tan-Torres Edejer T, Baltussen R, Adam T, et al Making choices in health: WHO guide to cost-effectiveness analysis. 2003. http://agris.fao.org/agris-search/search.do?recordID=XF2015015286 (accessed 25 May 2016). [ Links ]
58. South African Reserve Bank. ZAR to USD exchange rate. 2016. http://wwwrs.resbank.co.za/webindicators/SDDSDetail.aspx?DataItem=BOP5329M (accessed 25 May 2016). [ Links ]
59. Stellenbosch University - Unit for Infection Prevention and Control. http://sun025.sun.ac.za/portal/page/portal/UIPC/INDEX (accessed 25 May 2016). [ Links ]
60. Lee JM, Botteman MF, Xanthakos N, Nicklasson L. Needlestick injuries in the United States: Epidemiologic, economic, and quality of life issues. AAOHN J 2005;53(3):117-133. https://doi.org/10.1177/216507990505300311 [ Links ]
61. Haddix AC, Teutsch SM, Corso PS. Prevention Effectiveness: A Guide to Decision Analysis and Economic Evaluation. New York: Oxford University Press, 2003. [ Links ]
62. Tengs TO, Wallace A. One thousand health-related quality-of-life estimates. Med Care 2000;38(6):583-637. https://doi.org/10.1097/00005650-200006000-00004 [ Links ]
63. Sachs JD. Macroeconomics and health: Investing in health for economic development. Rev Panam Salud Publica 2002;12(2):143-144. https://doi.org/10.1590/s1020-49892002000800017 [ Links ]
64. World Bank. GDP per capita (current US$) | Data | Table. http://data.worldbank.org/indicator/NY.GDP.PCAP.CD (accessed 27 May 2016). [ Links ]
65. Shepard CW, Simard EP, Finelli L, Fiore AE, Bell BP. Hepatitis B virus infection: Epidemiology and vaccination. Epidemiol Rev 2006;28(1):112-125. https://doi.org/10.1093/epirev/mxj009 [ Links ]
 Correspondence:
Pieter de Jager
pieter.dejager@wits.ac.za
Accepted 12 January 2018

