


Serviços Personalizados
Artigo
 Inglês (pdf)
 Artigo em XML
 Referências do artigo
Indicadores

Links relacionados
-
 Citado por Google
 -
 Similares em Google
Compartilhar

 Permalink
SAMJ: South African Medical Journal
versão On-line ISSN 2078-5135
versão impressa ISSN 0256-9574
SAMJ, S. Afr. med. j. vol.108 no.5 Pretoria Mai. 2018
http://dx.doi.org/10.7196/samj.2018.v108i5.12802
RESEARCH
The costs and outcomes of paediatric tuberculosis treatment at primary healthcare clinics in Johannesburg, South Africa
E P BudgellI; D EvansII; R LeunerIII; L LongI, IV; S RosenV, VI
IMSc; Health Economics and Epidemiology Research Office, Department of Internal Medicine, School of Clinical Medicine, Faculty of Health Sciences, University of the Witwatersrand, Johannesburg, South Africa
IIPhD; Health Economics and Epidemiology Research Office, Department of Internal Medicine, School of Clinical Medicine, Faculty of Health Sciences, University of the Witwatersrand, Johannesburg, South Africa
IIIMCom; Health Economics and Epidemiology Research Office, Department of Internal Medicine, School of Clinical Medicine, Faculty of Health Sciences, University of the Witwatersrand, Johannesburg, South Africa
IVPhD; Department of Global Health, School of Public Health, Boston University, USA
VMPA; Health Economics and Epidemiology Research Office, Department of Internal Medicine, School of Clinical Medicine, Faculty of Health Sciences, University of the Witwatersrand, Johannesburg, South Africa
VIMPA; Department of Global Health, School of Public Health, Boston University, USA
ABSTRACT
BACKGROUND. Little up-to-date information is available about the costs of providing drug-susceptible tuberculosis (DS-TB) treatment to paediatric patients in South Africa (SA), nor have actual costs incurred at clinics been compared with costs expected from guidelines.
OBJECTIVES. To estimate actual and guideline treatment costs by means of a retrospective cohort analysis.
METHODS. We report patient characteristics, outcomes and treatment costs from a retrospective cohort of paediatric and adolescent (<18 years) DS-TB patients registered for treatment from 1 April 2011 to 31 March 2013 at three primary healthcare clinics in Johannesburg, SA. Actual treatment costs in 2015 SA rands and US dollars were estimated from the provider perspective using a standard bottom-up microcosting approach and compared with an estimate of guideline costs.
RESULTS. We enrolled 88 DS-TB patients (median age 4 years (interquartile range 1.0 - 9.5), 44.3% female, 22.7% HIV co-infected, 92.0% pulmonary TB). Treatment success was high (89.8%; 13.6% cured, 76.1% completed treatment), and the mean (standard deviation (SD)) cost per patient with treatment success was ZAR1 820/USD143 (ZAR593/USD46), comprising fixed costs (44.0%), outpatient visits (30.7%), medication (19.3%) and laboratory investigations (6.0%). This was 17% more than the mean (SD) cost estimated by applying treatment guidelines (ZAR1 553/USD122 (ZAR1 620/USD127)), with differences due mainly to higher laboratory costs and more outpatient visits taking place than were recommended in national guidelines.
CONCLUSIONS. These results are the first reported estimates of paediatric DS-TB treatment costs in SA and show the potential cost savings of closer adherence to national treatment guidelines. The findings were robust in sensitivity analyses and are lower than previous cost estimates in adults.
In high-burden tuberculosis (TB) settings such as South Africa (SA), poor ascertainment and reporting of paediatric cases are widespread,[1,2] but where TB diagnosis and reporting systems are functioning well, it is estimated that children <15 years of age may account for 15 - 20% of the TB burden.[3] In SA, which has one of the most severe epidemics of TB in the world,[4] children aged <15 account for >10% of reported cases,[4] making TB the fourth leading cause of child mortality.[5] Despite this, relatively little information is available about the characteristics of paediatric TB patients, their barriers to care,[6] how they are diagnosed and treated, or the outcomes and cost of their care. Existing reports of paediatric TB care either provide little descriptive information on the characteristics of paediatric patients[7,8] or present data from children's hospitals in the Western Cape Province,[9,10] a setting that probably differs from treatment at primary care level in other provinces.
The only published estimates of the costs of drug-susceptible TB (DS-TB) treatment in SA are for adults and are based either on estimates from guidelines[11] or data from nearly two decades ago (2000 - 2001),[12] before the advent of large-scale access to antiretroviral therapy (ART) for HIV. Since treatment of adults differs from paediatric treatment with regard to drug regimens, laboratory investigations, supervision and treatment monitoring, the absence of cost estimates for paediatric treatment is an important gap in the evidence base.
Objectives
To provide evidence for TB programme planning and budgeting, we describe paediatric TB treatment with regard to patient characteristics, contacts, types of disease, treatment outcomes and treatment costs at three primary healthcare clinics (PHCs) in Johannesburg, SA. Actual costs incurred at clinics are compared with costs expected from national treatment guidelines.
Methods
Study sites
The study was conducted at three PHCs in the Johannesburg Metropolitan Municipality, SA. The study sites all serve urban informal settlements (townships) on the edge of Johannesburg. While the clinics were selected as a convenience sample, this region is typical of other densely populated, periurban informal settlements surrounding major metropolitan areas in SA, and the sites are typical of the public sector clinics in which most TB patients access care and treatment. The incidence of TB is known to be high in Johannesburg (500 cases per 100 000 in 2012).[13] Children aged <5 years and 5 -19 years are reported to account for 7.4% and 4.0% of all diagnosed cases, respectively.[14] In a previous study,[15] we observed that the three sites initiated a total of 63 children on TB treatment in the yearlong period from 1 April 2011 to 31 March 2012.
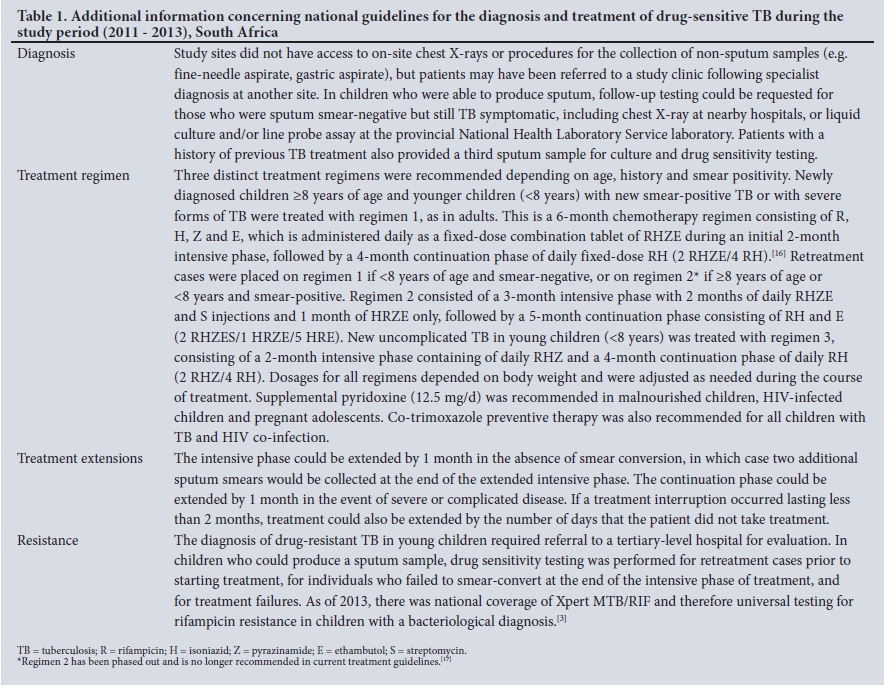
Care was provided according to the national TB treatment guidelines prevailing at the time of the study.[16] Diagnosis was typically done by sputum smear microscopy (acid-fast bacilli-positive) in older children (>8 years) and clinically in younger children (<8), who often cannot produce sputum samples. Samples were sent from the study clinics to a centralised laboratory for analysis, where GeneXpert MTB/RIF (Cepheid, USA) was introduced as standard in 2011. Treatment regimens depended on the child's age, history and smear positivity. In older children and younger children with a bacteriological diagnosis, the response to treatment was evaluated by smear microscopy after 2 or 3 months and 5 or 7 months, depending on the regimen. Patients with extrapulmonary TB or a clinical diagnosis were assessed through clinical monitoring. A detailed description of the standard of care under these guidelines is provided in Table 1.
Study population
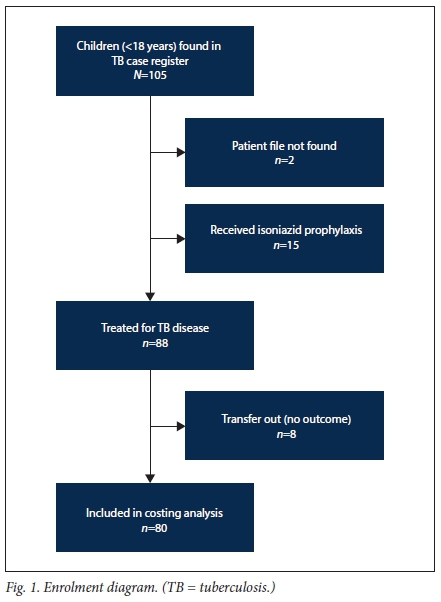
We created a retrospective cohort from a census of patients aged <18 years registered for TB treatment at the study sites during the 2-year period 1 April 2011 - 31 March 2013. Children were included if their TB clinic card could be located on site and they initiated TB treatment; patients on isoniazid prophylaxis were excluded (Fig. 1). Follow-up for each patient extended from treatment initiation until the earlier of outcome date or transfer out. Data were censored on 10 October 2013, after the last patient had reached the outcome date.
Data collection
Data were extracted from routinely maintained TB case registers and National Tuberculosis Control Programme TB clinic cards stored at each site. The data collected included clinical characteristics at the time of treatment initiation, TB treatment history, diagnosis method, treatment start date, drug regimens, number of clinic visits, type of treatment supervisor, laboratory monitoring tests, patient contacts and treatment outcomes. Baseline smear microscopy status and follow-up smear conversion were determined from laboratory results recorded at the end of the intensive phase of treatment, either on the TB clinic cards or in the clinic TB register.
Treatment outcomes and statistical analysis
Treatment outcomes were defined as per national TB guidelines[16] as cured, completed, failed, lost to follow-up, died or transferred out (Table 2). Baseline clinical characteristics, diagnosis method, smear conversion, drug regimens, contact tracing, directly observed treatment short-course (DOTS) supervision method and treatment outcomes were reported and summarised as proportions or medians with interquartile ranges (IQRs). All patients in the cohort were included in the analysis of characteristics and outcomes.
Cost data and analysis
The cost of treatment for TB disease was estimated from the perspective of the healthcare provider using a bottom-up micro-costing approach,[18] starting from the time of clinic registration (date of arrival at the study clinic) to the earliest reported outcome. Since patients who transferred out had an unknown outcome, they were excluded from the cost estimates. For those with an outcome available, any treatment costs occurring before arrival at a study clinic or after loss to follow-up were unknown and were therefore excluded from our treatment cost estimates.
Average treatment costs were estimated for the sample as a whole and by patient outcome. We also estimated a 'production cost' or total cost per patient achieving a successful outcome (cured or completed), a calculation that takes into account the costs of providing care to all patients, including those who failed therapy, were lost to follow-up or died.[19]
The cost of treatment per patient was estimated as the sum of variable and fixed costs per patient. To estimate variable costs, we identified and enumerated the resources consumed directly by individual patients, as recorded on the TB clinic cards. These resources included medication prescribed, TB monitoring tests (excluding diagnosis) and clinic visits. Drug and laboratory unit costs were obtained from public sector suppliers. A cost per clinic visit, reflecting the time spent by clinical personnel (nurses), was estimated as the total staff cost per month multiplied by the share of paediatric TB patients seen by the relevant personnel, and then divided by the number of paediatric TB visits per month. Salaries were obtained from government salary scales. These unit costs were multiplied by the quantity of resources used by each patient to obtain a total variable cost per patient.
For costs that could not be directly attributed to individual patients, we summed the annual costs of shared resources such as building space (e.g. hallways, lavatories, waiting and consultation rooms), personnel (e.g. clinic managers, security guards, administrative assistants, cleaners), equipment (e.g. furniture, excluding fixtures) and other consumables (e.g. cleaning materials, stationery). The sum of the annual fixed costs was then multiplied by the fraction of each shared resource that was used by paediatric TB patients to obtain the total annual fixed cost per study patient. The annual fixed cost per study patient was then divided by the average number of annual paediatric TB visits during the study period to obtain the fixed cost per study visit. This was then multiplied by the number of study visits made by each patient to derive the final fixed cost per patient.
All fixed costs and the staffing cost per patient visit were estimated using data from a single study clinic that was similar to the other two clinics in size and number of paediatric TB patients enrolled in care. Additional details for estimating variable and fixed costs, and the fraction of fixed costs attributable to paediatric TB care, are provided in Table 3.
All unit costs were standardised to 2015 SA rands (ZAR) and are reported in ZAR and US dollars (USD) at an average exchange rate of ZAR12.76/USD1.[22] When possible, 2015 unit costs were obtained; where necessary, older unit costs were inflated using the average year-on-year inflation rate.
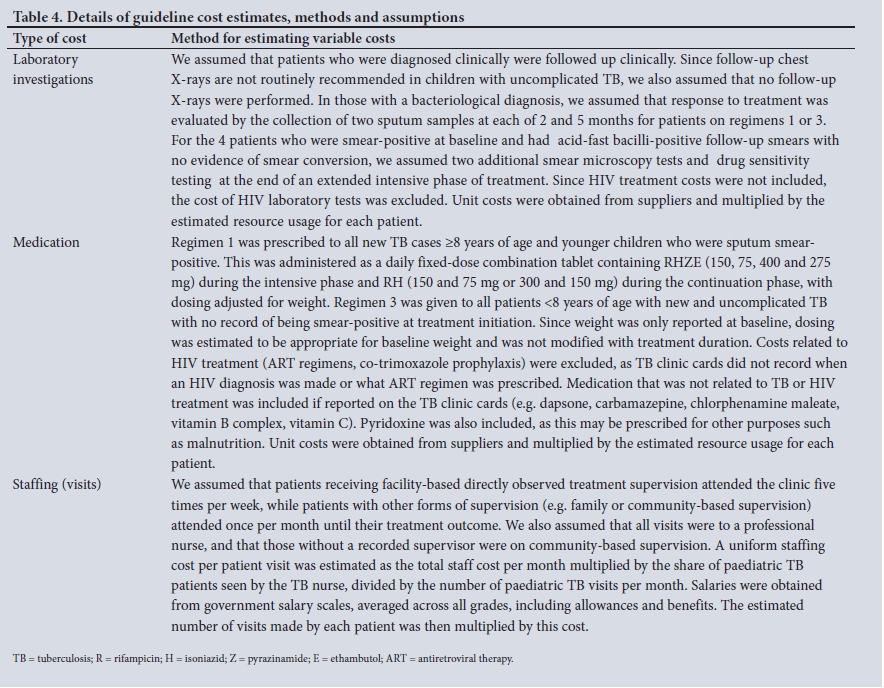
Guideline costs
For comparison purposes, we also estimated the cost of paediatric TB treatment if the prevailing guidelines[16] were strictly followed for laboratory investigations, medication consumed and visits made to the clinic. Assumptions made in the guideline cost estimates are documented in Table 4.
Sensitivity analysis
Patients who transferred in to a study site after initiating treatment elsewhere were excluded from costing analyses. The working life of equipment was also adjusted to vary from 2 to 8 years, and the chosen discount rate was modified to range from 0% to 8%.
Ethics approval
Ethics approval for this study was granted by the City of Johannesburg Health Department (protocol no. M130979) and the Human Research Ethics Committee (Medical) of the University of the Witwatersrand, Johannesburg (clearance certificate no. M130979).
Results
Baseline characteristics
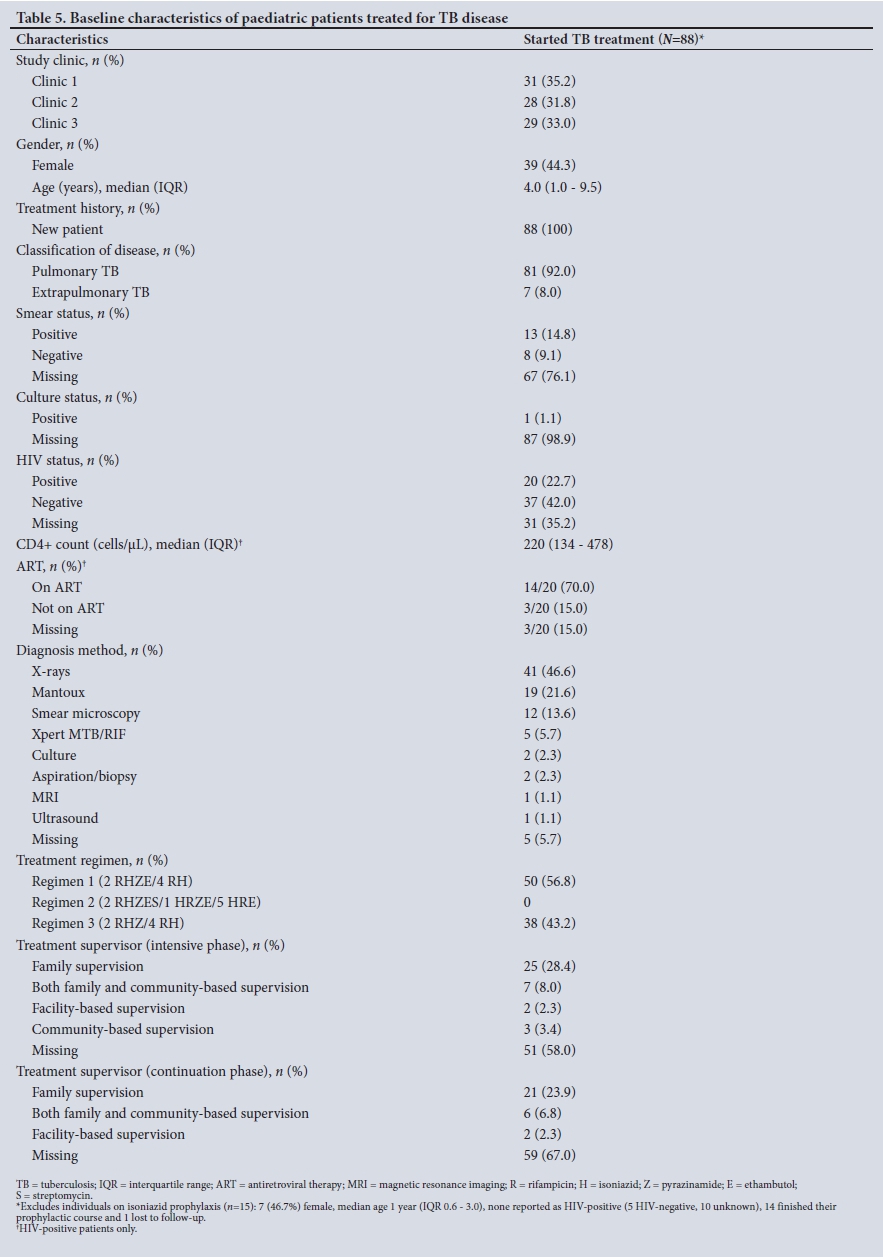
During the study period, 88 cases were registered for TB treatment across the three facilities: 44.3% of these patients (39/88) were female, the median age was 4 years (IQR 1.0 - 9.5), 100% (88/88) were new TB cases, 92.0% (81/88) had pulmonary TB, 22.7% (20/88) were HIV co-infected, and 70.0% (14/20) of those with HIV were confirmed to be on ART (Table 5). Patients enrolled in the study were followed up for a median of 6.4 months (IQR 6.1 - 7.7) between registration at the sites and outcome date. Of the 80 patients included in the costing analysis, 11 transferred in (i.e. registered for treatment initiation at a non-study site before transferring to a study clinic) in a median of 61 days (IQR 36 - 89).
Diagnosis
More than two-thirds of the patients (62/88, 70.5%) were diagnosed clinically, with X-rays being the most common diagnostic method (46.6%), followed by Mantoux (21.6%), smear microscopy (13.6%), GeneXpert MTB/RIF (5.7%), aspiration/biopsy (2.3%), culture (2.3%), magnetic resonance imaging (1.1%) and abdominal ultrasound (1.1%).
Smear conversion
Thirteen patients (14.8%) were recorded as smear-positive and 8 (9.1%) as smear-negative at baseline, with others either receiving a clinical diagnosis or simply missing smear microscopy results. Of those with smear-positive TB, 11/13 (84.6%) had follow-up smears, and 7/13 (53.8%) had evidence of smear conversion by the end of the intensive phase of treatment in a median of 55 days (IQR 48 - 82).
Only one individual was recorded as culture-positive at baseline, but there were no subsequent culture results available to determine whether culture conversion occurred.
Regimens
Just over half of the patients (56.8%, 50/88) were prescribed regimen 1 in the intensive phase, and the rest were put on regimen 3. According to national treatment guidelines,'161 19/50 (38.0%) of patients on regimen 1 should have been prescribed regimen 3, while 3/38 (7.9%) patients on regimen 3 should have been prescribed regimen 1. Most HIV-positive patients were prescribed co-trimoxazole (90.0%, 18/20), but only 55.0% (11/20) were prescribed supplemental pyridoxine, as is recommended.[23,24]
Contact tracing
Fewer than half (45.5%, 40/88) of the TB files contained a list of patient contacts. The TB files were not designed to collect data on whether contacts were screened for TB signs and symptoms, or whether they lived with the patient. Among all contacts identified (N=118), 10 (8.5%) had a record of being tested for TB and 1 started treatment for TB disease. The median age of contacts identified was 17 years (IQR 3 - 32); most were parents (34.7%) or siblings (32.2%), and the rest were other relatives (22.0%) or non-relatives (3.3%), or their relationship was unknown (7.6%).
Supervision
DOTS supervision type was missing for 51 children (58.0%) in the intensive phase and 59 (67.0%) in the continuation phase. For those whose supervision type was reported, family supervision was the most commonly reported supervision type (intensive phase 67.6%, continuation phase 72.4%), followed by a combination of family and community-based supervision (intensive phase 18.9%, continuation phase 20.7%), community-based supervision (intensive phase 8.1%, continuation phase 0.0%) and facility-based supervision (intensive phase 5.4%, continuation phase 6.9%).
Treatment outcomes
Overall treatment success was high (89.8%), with 13.6% (12/88) of patients cured and 76.1% (67/88) completing treatment. However, only 2/12 cured patients had laboratory evidence available in their TB clinic cards to independently confirm this outcome. The remainder of the patients were either lost to follow-up (1/88, 1.1%) or missing an outcome after transferring out (8/88, 9.1%).
Resource utilisation and treatment costs
From treatment initiation to outcome, patients utilised an average of 6.9 months of medication, 0.8 laboratory tests and 10 clinic visits.
Table 6 reports treatment costs. The mean (standard deviation (SD)) cost of treatment was ZAR1 815/USD142 (ZAR591/USD46) per patient in the sample, ZAR2 006/USD157 (ZAR223/USD18) per patient cured, ZAR1 787/USD140 (ZAR632/USD50) per patient who completed treatment, and ZAR1 820/USD143 (ZAR593/USD46) per patient with a successful treatment outcome. The 'production cost' per treatment success was ZAR1 838/USD144. The primary drivers of treatment costs were fixed costs (44.0%), outpatient visits (30.7%), medication (19.3%), and laboratory investigations (6.0%) (Table 6).
Sensitivity analyses
Excluding patients who transferred in increased the mean (SD) cost of treatment by 4% to ZAR1 883/USD148 (ZAR591/USD46) per patient and ZAR1 891/USD148 (ZAR559/USD44) per treatment success. Adjusting the working life of equipment and the discount rate led to little change in the estimated cost of treatment. With the working life of equipment set at 2 and 8 years, the average cost per treatment success was ZAR1 535/USD120 and ZAR1 509/ USD118, respectively, amounting to a change of just 1.02%. With the discount rate set at 0% and 8%, the average cost per treatment success varied even less, from ZAR1 513/USD119 to ZAR1 516/ USD119, respectively.
Guideline costing
In the guideline costing, the mean (SD) cost of treatment was ZAR2 020/USD158 (ZAR2 534/USD199) per patient who was cured, ZAR1 469/USD115 (ZAR1 409/USD110) per patient who completed treatment, and ZAR1 553/USD122 (ZAR1 620/USD127) per patient with a successful treatment outcome. The 'production cost' per treatment success was ZAR1 575/USD123. Primary drivers of treatment costs were fixed costs (44.0%), outpatient visits (30.7%), treatment medication (23.5%) and laboratory investigations (1.8%) (Table 7).
Discussion
In this study, we estimated an average provider treatment cost per patient of ZAR1 815/USD142 and a production cost per successful outcome of ZAR1 838/USD144, reflecting the high proportion of patients who were cured or completed treatment. This cost (ZAR1 815/USD142) is 17% higher than the estimated cost of guideline-based treatment (ZAR1 553/USD122), suggesting that there may be cost savings associated with closer adherence to national treatment guidelines. These differences were a result of both higher laboratory costs and more outpatient visits taking place than were recommended in the national guidelines.
As there have been no published estimates of the cost of paediatric TB treatment in SA, we compared our results with those of studies of adult patients. Our estimate was lower than previous SA cost estimates in adults. The most recent of these considered guideline costs'111 and estimated a provider diagnosis and treatment cost of USD257 (2011 USD) per adult pulmonary DS-TB patient, assuming adherence to national guidelines, with variable costs obtained from government sources and PHCs in the Cape Town Metro region and patient clinical characteristics from the literature. However, this estimate included the cost of diagnosis, which we excluded. Using data from 2000 to 2001, other estimates from SA have also found that the provider cost of adult DS-TB treatment ranges, depending on the model of service delivery, from a low of USD251 - 253 in a public non-governmental organisation partnership, to USD507 - 568 in public health clinics in the Western Cape, to USD654 - 744 in private workplace occupational health clinics (all 2001 USD).[12] While not directly comparable in terms of year or methods, these estimates all suggest that paediatric treatment as provided by PHCs in 2011 - 2013 was less expensive than adult treatment.
While the treatment outcomes we observed were very good, our cohort did not identify any retreatment cases or patients with complicated TB, which require modified treatment regimens and additional laboratory investigations. Our sample size was also small, with just three clinics in one region of Johannesburg, potentially limiting our geographical generalisability. However, high rates of treatment success have been reported in other SA paediatric DS-TB cohorts, although studies are limited in number. Using data from a DS-TB treatment register in the Western Cape, treatment success rates of 80% have been reported, with higher rates of treatment discontinuation and missing outcomes in children and adolescents with HIV.[25] A small cohort drawn from three provinces in 2009 showed slightly higher rates of treatment success (88%, 65/74) in children <8 years of age. [7] A record review of children (aged 0 - 15 years) living in periurban communities found that treatment success was good (79%, 65/82 in 2008 - 2011) among patients receiving supervised home visits from trained community caregivers or nurses, but clinic-based treatment showed relatively low rates of success (54%, 52/97 in 2005 - 2008) and high rates of loss to follow-up (38%).'[8] In comparison, older studies (2003 - 2005) of hospital-based treatment in Cape Town reported treatment success of 71% (97/137) in HIV-infected children (aged 0 -11 years),[9] and higher mortality in young children (9%, 31/334, age <3 years) than older children (4%, 10/262, age 4 - 13 years), although treatment outcomes were not reported separately from patients who tested positive for drug resistance (11%).[10]·
We also determined that one-third of prescribed regimens in our study (33%, 29/88) did not appear to follow national treatment guidelines. While lower rates of inappropriate regimens in children <8 years of age (11%) have been reported in other studies from SA,[7] the use of inappropriate regimens is known to be a relatively widespread problem[26] and can contribute to both treatment failure and the development of drug resistance.[27] A systematic review has found that inadequate knowledge of national treatment guidelines among healthcare workers is also relatively common, although the review did not include any literature from SA.[28] Other problems with record keeping were also evident, as most of those who were reported as cured were missing the laboratory evidence needed to confirm this outcome. This issue has been noted in the treatment records of adult TB patients,[15] and suggests that careful staff training and performance monitoring are needed. We also observed limited contact tracing, which is of added concern because data from Soweto, Johannesburg, have shown high rates of undiagnosed TB and HIV in the household contacts and caregivers of children with TB.[29]
Study limitations
This study has several limitations, some of which are common to retrospective cohort studies. Our results depended on the completeness and accuracy of routinely collected data on TB clinic cards, which may vary across clinics. Fixed costs may also vary across clinics, yet we based these estimates on data from a single study clinic. The volume of medication dispensed needed to be estimated based on clinic visits, as this was not recorded directly in patient files. The cadre of staff seen by patients and the length of each visit were not recorded, so we assumed that all visits were made to a professional nurse, as clinic managers reported that this was the standard practice. Only 66.7% (14/21) of patients with a bacteriological diagnosis had any evidence of follow-up laboratory investigations, suggesting that some laboratory tests may be missing. The 11 patients who transferred in were missing information on resources consumed prior to transfer, reducing our cost estimates for these select patients. Sensitivity tests indicate that their exclusion led to a slight increase in average treatment costs. Finally, national guidelines have been updated since this cohort was in care, although many of the most important updates relate to diagnostic algorithms rather than treatment.
Conclusions
We found that most children initiating paediatric TB treatment in three typical public sector clinics in Johannesburg had successful treatment outcomes, but there was substantial variation between the services actually delivered and those called for by the national guidelines for paediatric TB treatment. In this study, we report the first known estimates of paediatric DS-TB treatment costs in SA and demonstrate the potential cost savings of closer adherence to national treatment guidelines. This information provides a starting point for improving management of paediatric TB and planning for future resource needs.
Acknowledgements. The authors thank the patients and staff of the three clinics that participated in this study and the Gauteng and national departments of health for providing for the care of the patients. We also thank Kathryn Schnippel for helpful feedback in designing this study.
Author contributions. Conceptualisation: EPB, SR; data curation: EPB; formal analysis: EPB; funding acquisition: LL, SR; writing: original draft EPB, review and editing EPB, DE, RL, LL, SR.
Funding. EPB, DE, RL, LL and SR were supported through the South Africa Mission of the US Agency for International Development (USAID) under the terms of cooperative agreement 674-A-12-00029 to the Health Economics and Epidemiology Research Office. This study was made possible by the generous support of the American people through USAID. The contents of the article are the responsibility of the authors and do not necessarily reflect the views of USAID or the US government. The funders had no role in the study design, collection, analysis and interpretation of the data, in manuscript preparation or the decision to publish.
Conflicts of interest. None.
Data availability statement. The data are owned by the study sites and the National Department of Health (SA) and governed by the Human Research Ethics Committee (University of the Witwatersrand). All relevant data are included in the article. The full data are available from the Health Economics and Epidemiology Research Office for researchers who meet the criteria for access to confidential data and have approval from the owners of the data. Contact the organisation (information@heroza.org) for additional information regarding data access.
References
1. Perez-Velez CM, Marais BJ. Tuberculosis in children. N Engl J Med 2012;367(4):348-361. https://doi.org/10.1056/NEJMra1008049 [ Links ]
2. Jenkins HE. Global burden of childhood tuberculosis. Pneumonia 2016;8(1):24. https://doi.org/10.1186/s41479-016-0018-6 [ Links ]
3. Marais BJ, Schaaf HS. Childhood tuberculosis: An emerging and previously neglected problem. Infect Dis Clin North Am 2010;24(3):727-749. https://doi.org/10.1016/j.idc.2010.04.004 [ Links ]
4. World Health Organization. Global tuberculosis report 2016. 2016. www.who.int/tb/publications/global_report/en (accessed 1 June 2017). [ Links ]
5. Statistics South Africa. Mortality and causes of death in South Africa: Findings from death notification, 2015. Statistical Release P0309.3. Pretoria: Stats SA, 2017. www.statssa.gov.za/?page_id=1854&PPN=P0309.3 (accessed 1 June 2017). [ Links ]
6. Sullivan BJ, Esmaili BE, Cunningham CK. Barriers to initiating tuberculosis treatment in sub-Saharan Africa: A systematic review focused on children and youth. Glob Health Action 2017;10(1):1290317. https://doi.org/10.1080/16549716.2017.1290317 [ Links ]
7. Ershova JV, Podewils LJ, Bronner LE, Stockwell HG, Dlamini SS, Mametja LD. Evaluation of adherence to national treatment guidelines among tuberculosis patients in three provinces of South Africa. S Afr Med J 2014;104(5):362-368. https://doi.org/10.7196/SAMJ.7655 [ Links ]
8. Jeena L, Naidoo K. Tuberculosis treatment outcomes among peri-urban children receiving doorstep tuberculosis care. Int J Tuberc Lung Dis 2016;20(2):235-239. https://doi.org/10.5588/ijtld.15.0090 [ Links ]
9. Walters E, Cotton MF, Rabie H, Schaaf HS, Walters LO, Marais BJ. Clinical presentation and outcome of tuberculosis in human immunodeficiency virus infected children on anti-retroviral therapy. BMC Pediatr 2008;8:1. https://doi.org/10.1186/1471-2431-8-1 [ Links ]
10. Schaaf HS, Marais BJ, Whitelaw A, et al. Culture-confirmed childhood tuberculosis in Cape Town, South Africa: A review of 596 cases. BMC Infect Dis 2007;7:140. https://doi.org/10.1186/1471-2334-7-140 [ Links ]
11. Pooran A, Pieterson E, Davids M, Theron G, Dheda K. What is the cost of diagnosis and management of drug resistant tuberculosis in South Africa? PLoS One 2013;8(1):e54587. https://doi.org/10.1371/journal.pone.0054587 [ Links ]
12. Sinanovic E, Kumaranayake L. Financing and cost-effectiveness analysis of public-private partnerships: Provision of tuberculosis treatment in South Africa. Cost Eff Resour Alloc 2006;4:11. https://doi.org/10.1186/1478-7547-4-11 [ Links ]
13. Massyn N, Day C, Dombo M, Barron P, English R, Padarath A. District Health Barometer 2012/13. Durban: Health Systems Trust, 2013. www.hst.org.za/publications/Pages/HSTDistrictHealthBarometer.aspx (accessed 9 August 2017). [ Links ]
14. Massyn N, Peer N, Padarath A, Barron P, Day C. District Health Barometer 2014/15. Durban: Health Systems Trust, 2015. www.hst.org.za/publications/Pages/HSTDistrictHealthBarometer.aspx (accessed 9 August 2017). [ Links ]
15. Budgell EP, Evans D, Schnippel K, Ive P, Long L, Rosen S. Outcomes of treatment of drug-susceptible tuberculosis at public sector primary healthcare clinics in Johannesburg, South Africa: A retrospective cohort study. S Afr Med J 2016;106(10):1002-1009. https://doi.org/10.7196/SAMJ.2016.v106i10.10745 [ Links ]
16. National Department of Health, South Africa. National Tuberculosis Management Guidelines 2009. Pretoria: NDoH, 2009. [ Links ]
17. National Department of Health, South Africa. Guidelines for the Management of Tuberculosis in Children. Pretoria: NDoH, 2013. [ Links ]
18. Drummond M, Sculpher M, Torrance G, O'Brien B, Stoddart G. Methods for the Economic Evaluation of Health Care Programmes. 3rd ed. New York: Oxford University Press, 2005. [ Links ]
19. Rosen S, Long L, Sanne I. The outcomes and outpatient costs of different models of antiretroviral treatment delivery in South Africa. Trop Med Int Health 2008;13(8):1005-1015. https://doi.org/10.1111%2Fj.1365-3156.2008.02114.x [ Links ]
20. Statistics South Africa. CPI history: 1960 onwards. 2015. www.statssa.gov.za/publications/P0141/CPIHistory.pdf? (accessed 8 May 2016). [ Links ]
21. South African Reserve Bank. Selected historical rates: Prime lending rate (predominant rate). 2015. www.resbank.co.za/Research/Rates/Pages/SelectedHistoricalExchange AndInterestRates.aspx (accessed 7 May 2016). [ Links ]
22. OANDA. Historical exchange rates. www.oanda.com/currency/historical-rates (accessed 10 May 2016). [ Links ]
23. National Department of Health, South Africa. The South African Antiretroviral Treatment Guidelines. Pretoria: NDoH, 2010. [ Links ]
24. National Department of Health, South Africa. The South African Antiretroviral Treatment Guidelines. Pretoria: NDoH, 2013. [ Links ]
25. Snow K, Hesseling AC, Naidoo P, Graham SM, Denholm J, du Preez K. Tuberculosis in adolescents and young adults: Epidemiology and treatment outcomes in the Western Cape. Int J Tuberc Lung Dis 2017;21(6):651-657. https://doi.org/10.5588/ijtld.16.0866 [ Links ]
26. Langendam MW, van der Werf MJ, Huitric E, Manissero D. Prevalence of inappropriate tuberculosis treatment regimens: A systematic review. Eur Respir J 2012;39(4):1012-1020. https://doi.org/10.1183%2F09031936.00125511 [ Links ]
27. Van der Werf MJ, Langendamm MW, Huitric E, Manissero D. Multidrug resistance after inappropriate tuberculosis treatment: A meta-analysis. Eur Respir J 2012;39(6):1511-1519. https://doi.org/10.1183%2F09031936.00125711 [ Links ]
28. Van der Werf MJ, Langendam MW, Huitric E, Manissero D. Knowledge of tuberculosis-treatment prescription of health workers: A systematic review. Eur Respir J 2012;39(5):1248-1255. https://doi.org/10.1183%2F09031936.00125611 [ Links ]
29. Lala SG, Little KM, Tshabangu N, et al. Integrated source case investigation for tuberculosis (TB) and HIV in the caregivers and household contacts of hospitalised young children diagnosed with TB in South Africa: An observational study. PLoS One 2015;10(9):e0137518. https://doi.org/10.1371/journal.pone.0137518 [ Links ]
 Correspondence:
D Evans
devans@heroza.org
Accepted 30 August 2017

