


Serviços Personalizados
Artigo
 Inglês (pdf)
 Artigo em XML
 Referências do artigo
Indicadores

Links relacionados
-
 Citado por Google
 -
 Similares em Google
Compartilhar

 Permalink
SAMJ: South African Medical Journal
versão On-line ISSN 2078-5135
versão impressa ISSN 0256-9574
SAMJ, S. Afr. med. j. vol.108 no.4 Pretoria Abr. 2018
http://dx.doi.org/10.7196/samj.2018.v108i4.12755
RESEARCH
Evaluating the effect of ward-based outreach teams on primary healthcare performance in North West Province, South Africa: A plausibility design using routine data
T AssegaaiI; G ReagonII; H SchneiderIII, IV
IBCom, MPH; School of Public Health, University of the Western Cape, Cape Town, South Africa
IIMB ChB, FCPHM; School of Public Health, University of the Western Cape, Cape Town, South Africa
IIIMB ChB, MMed, PhD; School of Public Health, University of the Western Cape, Cape Town, South Africa
IVMB ChB, MMed, PhD; University of the Western Cape/South African Medical Research Council Health Services to Systems Unit, University of the Western Cape, Cape Town, South Africa
ABSTRACT
BACKGROUND. North West Province (NWP), South Africa, was an early adopter of the primary healthcare (PHC) ward-based outreach team (WBOT) strategy and has made considerable progress in implementing it. Given the interest in and expectations of greater investment in WBOTs, assessing their impact on and contribution to PHC outputs and health outcomes is becoming increasingly important.
OBJECTIVES. To describe the application of a plausibility evaluation design for assessing the contribution of WBOTs to PHC performance in NWP, comparing changes in coverage, utilisation and outcome indicators in facilities with and without WBOTs.
METHODS. Routine data from the District Health Information System on both WBOTs and PHC facilities for the period 2011/12 (prior to implementation) to 2014/15 (3 years after implementation began) were extracted. Analysis involved the following three steps: (i) selection of indicators sensitive to community-based action; (ii) data cleaning; and (iii) comparison of the degree of change in median indicator values between 2011/12 and 2014/15 in facilities with and without WBOTs (a difference-in-differences analysis).
RESULTS. Changes in indicator values in facilities were grouped into four categories: (i) indicators where there was greater (statistically significant) improvement in facilities with WBOTs (couple year protection rate, measles immunisation coverage in children aged <1 year, incidence of children aged <5 years with severe diarrhoea with dehydration); (ii) indicators that declined or worsened, but less so in facilities with WBOTs at statistically significant levels (antenatal first visits as a percentage of children born in that year, PHC utilisation rate of children aged <5 years); (iii) indicators that improved in all facilities with no significant difference between facilities with and without WBOTs (antenatal attendance before 20 weeks, prophylactic vitamin A coverage to children aged 12 - 59 months); and (iv) indicators that remained unchanged in all facilities (immunisation coverage in children aged <1 year, postnatal mother visits at 6 days, cervical cancer screening coverage in women aged >30 years, PHC utilisation rate of children aged >5 years).
CONCLUSION. Notwithstanding the limitations of routine data and the need to approach the findings with caution, this analysis suggests that WBOTs plausibly had some positive effects on the overall performance of the PHC system. We propose a methodology to monitor the performance of WBOTs using routine PHC indicators that programme managers could apply elsewhere.
Community-based service delivery, bridging health facilities and households, is recognised as one of the key dimensions of primary healthcare (PHC).[1] Drawing on successes in a growing number of countries, national community health worker (CHW) programmes are returning to favour across the globe.[2] One of these, Brazil's Family Health Programme (FHP), extensively reorganised its PHC system to focus on families and communities, and integrate healthcare with health promotion and public health actions. It has resulted in increased access to healthcare and improved health outcomes for a substantial proportion of the population.[3] Inspired by the success of the Brazilian model, the South African (SA) government formulated a PHC re-engineering strategy in 2011.[4,5] The strategy prioritises four 'streams': ward-based PHC outreach teams (WBOTs), enhanced school health services, district clinical specialist teams (DCSTs) supporting maternal, neonatal and child health, and the contracting of private general practitioners to provide public services. This article focuses on the WBOT stream.
In terms of the PHC re-engineering strategy, each municipal electoral ward should deploy WBOTs, with an average of one team per 1 500 households. The roles of the teams are to strengthen health prevention and promotion and identify and support vulnerable individuals and families. Each team should ideally comprise a professional nurse and five to six CHWs, as well as a health promoter and an environmental health practitioner. An audit by the National Department of Health in 2011 determined that there were 72 000 lay community-based workers linked to provincial health services, mostly providing HIV/tuberculosis services.[5] These workers received widely varying training and remuneration, had diverse educational levels, and performed a variety of roles. By formalising them as CHWs into PHC outreach teams, the Department aims to ensure that they are similarly trained, have a clear and standardised scope of work, and become more fully integrated into the district health system.
North West Province (NWP) was an early adopter of the WBOT strategy and is regarded as one of the provinces that made the most systematic and sustained progress in implementing PHC outreach teams.[6] Each team (WBOT) is linked to a health facility and serves households in the drainage area of that facility, and each facility could have several WBOTs linked to it. Outputs and outcomes of a health facility would therefore be influenced by activities undertaken by WBOTs. By the end of 2015, NWP had the highest coverage by WBOTs in the country (72.6% of wards with at least one WBOT).[7] The first training of CHWs across the country commenced in October 2011, and shortly thereafter NWP began implementation with a pilot of 24 WBOTs, with at least one team in each of the 19 subdistricts across the province. Since then, a number of evaluations have documented the unfolding implementation of WBOTs in the province and provided insights into the factors enabling the expansion and functioning of the programme.[6,8-11] During this period, NWP recorded improvements in a number of PHC coverage indicators, such as early antenatal booking and vitamin A coverage, plausibly influenced by the WBOTs. However, these improvements have also been documented in other provinces with lower levels of WBOT coverage, and furthermore could have been affected by other interventions such as the DCSTs. Given the interest in and expectations of greater investment in WBOTs, assessing their impact on and contribution to PHC outputs and health outcomes is becoming increasingly important.
The efficacy of disease-specific CHW-based interventions has been demonstrated in controlled, experimental settings.[12] However, as programmes scale up and become integrated into the routine health system, not only may they lose effectiveness, but evaluating them becomes methodologically challenging. In the process of expansion, 'intervention' and 'control' areas are no longer randomly assigned, interventions are adapted and change as they are assimilated, and they interact with other interventions in context-specific ways. In such circumstances, approaches to programme evaluation need to include a wider range of options. Habicht et al.[13] propose a typology where 'probability' designs shift to the less definitive 'plausibility' and 'adequacy' designs. Probability designs are classic experiments in that they control for confounders through randomisation of intervention and control groups.[13] Plausibility designs (also referred to as quasi-experimental) evaluate changes before and after the intervention or compare non-randomised groups with and without interventions^13-Efforts may be made to identify and control for potential confounders in the analysis. Such approaches have been successfully applied to impact evaluations such as that of the nationally scaled up Brazilian FHP.[14] Adequacy designs evaluate performance against a standard or target (e.g. immunisation coverage), where changes are assumed to be due to the effects of the programme.
Objectives
This article describes the application of a plausibility evaluation design that aimed to assess the contribution of WBOTs to PHC performance in NWP, comparing coverage, utilisation and outcome indicators in facilities with and without WBOTs. The study formed the quantitative component of a mixed-method evaluation of the WBOTs strategy in NWP conducted in late 2015.[15] It drew on routinely collected data through the District Health Information System (DHIS) and made use of the 'difference-in-differences' analysis technique, appropriate to a plausibility evaluation of a programme at scale. This technique evaluates the effects of an intervention by comparing changes in, rather than absolute levels of, performance between intervention and control sites, where these are not randomly assigned, and may therefore have baseline differences.[16] However, it still assumes that sites are exposed to the same background changes and would show the same overall trends in the absence of an intervention[16]
Methods
A before-and-after evaluation was conducted with PHC facilities (clinics and health centres) as the units of analysis. All PHC facilities in the province that collected routine data on the indicators potentially influenced by WBOTs (see indicator list below) were included in the study population, and the entire eligible study population was included in the analysis, obviating the need for sampling. PHC facilities were grouped into those with functional WBOTs (intervention clinics) and those without WBOTs (control clinics) at follow-up (2014/15). WBOTs were deemed functional if their monthly activity data were regularly reflected in the facility routine information system (the DHIS). Based on the WBOT DHIS data, the number of functional teams increased from the 24 pilot teams in 2012 to 274 by March 2015. Household activities of WBOTs were evenly divided between maternal, reproductive and child health (49% of total activities), and follow-up of chronic diseases (51% of total).
Using routine data from the DHIS, the study compared changes in the performance of PHC facilities with and without WBOTs. Routine data from both the WBOTs and PHC clinics for the period 2011/12 (prior to implementation) to 2014/15 (3 years after the start of implementation) were obtained. The following three steps were then applied: (i) the indicators potentially sensitive to community-based action were identified and extracted; (ii) the routine data were cleaned using predetermined cleaning criteria; and (iii) a difference-in-differences analysis was applied to the data. These three steps are further elaborated below.
Step 1: Selection of indicators
PHC routine indicators - data elements and associated drainage population data - plausibly affected by the activities of the CHWs in the WBOTs at household level were selected and extracted from the DHIS. Data were extracted prior to commencement of WBOTs in 2011/12 and 3 years after WBOT activity, in 2014/15, for every clinic and health centre in NWP. The indicators, their rationale for inclusion and the corresponding data elements chosen for analyses are listed in Table 1.
In a separate study (not reported here), tuberculosis case detection rates and treatment outcomes were analysed as indicators of the chronic disease care activity of WBOTs.
Step 2: Data cleaning
Data were separated by data element, facility and month and saved in Excel 2016 (Microsoft, USA) for each year. Routine monthly data for each facility were checked for errors based on comparisons of facilities with each other and with other months in the year. Based on assessments of accuracy and completeness, the data were cleaned using defined rules. Great care was taken to avoid over-cleaning, and only data with clear and obvious errors were cleaned.
The following two cleaning rules for missing data were applied: (i) if a facility had data missing for >8 months in a year, that facility was excluded from the analysis; and (ii) if a facility had data missing for <8 months in a year, missing data were assigned the average values for the months that had data recorded. As all services included in the analysis had been routinely provided by the health department for many years, it was reasonably assumed that a lack of data reflected a lack of recording and/or reporting rather than a lack of service delivery for those months. It is acknowledged that by assigning average values, seasonal and special-event variation effects were not catered for in the correction; however, it would be impossible to correct for these without detailed knowledge of each individual facility.
The following cleaning rules for inaccurate data were applied: facility values of less than one-third (lower limit) and >3 times (upper limit) the average value for the year (annual average) were cleaned by assigning them the average value. Exceptions were made in certain circumstances, for example: (i) for annual average values <10, no lower-limit cleaning was done; (ii) for annual average values <10, upper-limit cleaning was done only if the values were >5 times the annual average; (iii) for annual averages of 'zero', upper-limit cleaning was done based on an average of 1; and (iv) for annual facility averages >3 times the annual average for the province, cleaning to the facility average was done for values greater than double the facility annual average. This rule was only applied if 3 times the provincial annual average was >40.
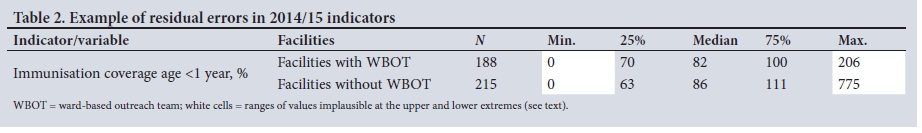
Despite the extensive data cleaning, several residual errors remained and resulted in values >100% for indicators such as immunisation coverage at age <1 year, for some facilities.
Step 3: Analysis of data
Standardised DHIS indicators, listed in Table 1, were calculated from data elements and compared for changes in value between 2011/12 and 2014/15. Medians and median differences from 2011/12 to 2014/15 in indicators were derived and tabulated for each facility using Epi Info 3.5.1 (Centers for Disease Control and Prevention, USA). Although the data were extensively cleaned, several residual errors remained. These errors are best seen when looking at the indicator values, particularly the minimum and maximum values as illustrated in the white cells in Table 2, where the ranges of values obtained for the facilities in the province for immunisation coverage are implausible at the upper and lower extremes. Similarly, the difference in facility values between 2011/12 and 2014/15 had extreme implausible outliers, and median (as opposed to mean) values were therefore used to avoid the influence of these outliers prone to errors.
The degree of change in individual facility indicator values over time was assessed by calculating the difference in median value over the time period, by subtracting the median value for 2011/12 from the median value for 2014/15, for that particular facility. The median of the differences of all the facilities, stratified into those with functional WBOTs and those without WBOTs, was then determined. In the final step, the median of the differences in facilities without WBOTs was subtracted from those with WBOTs (the difference-indifferences analysis). Non-parametric tests (the Wilcoxon rank-sum test) were computed in Stata 14 (StataCorp, USA) to determine the statistical significance (p<0.05) of the median difference-indifferences between facilities with functional WBOTs and those without WBOTs. Although PHC facilities served populations of varying sizes, no weighting of facilities was undertaken, as the main focus of analysis was in the relative change in, rather than the absolute value of, the indicator. However, absolute values of indicators are also presented in the findings, as these are necessary for interpreting the median differences over time. Absolute values additionally aid interpretation of the degree of relative change, as the higher the baseline, the more difficult it is to effect a positive (beneficial) change, and conversely the lower the baseline value, the easier it is to effect a positive change.
Ethical approval
Ethical approval for the study was obtained from the University of the Western Cape Senate Research Committee (ref. no. 15/2/4).
Results
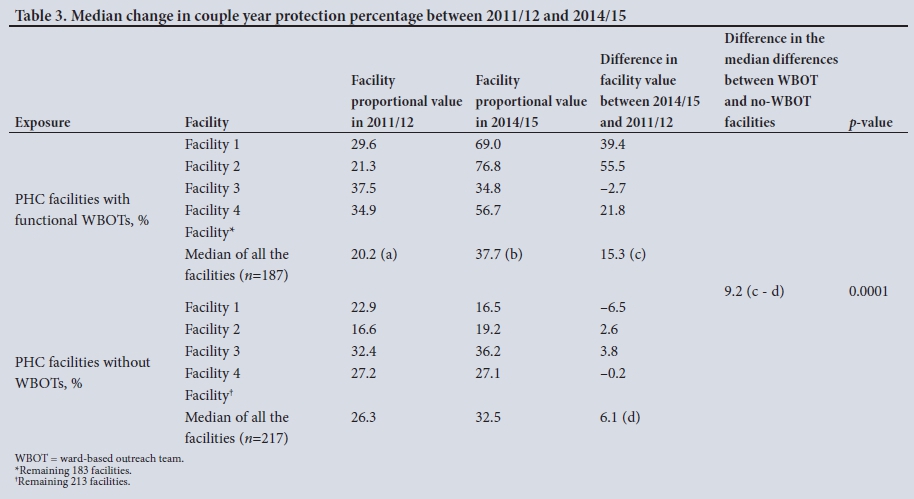
Routine data from which the indicators listed in Table 1 could be calculated were obtained for 404 facilities (187 with functional WBOTs and 217 without WBOTs). The median of the facility values for the various indicators was calculated for the years 2011/12 and 2014/15 and the differences in value for each facility between 2011/12 and 2014/15 were obtained with the median of those individual facility differences then being computed. This analysis was undertaken for all the indicators listed in Table 1, with an illustrative example for the indicator 'couple year protection' shown in Table 3. Data are shown for four actual facilities only, but then the median is shown for all the facilities, with 'Facility*' and 'Facility^ representing all the other facilities not shown in the table. The values for these facilities are reported in Tables 4 - 7, where the summarised analysis of the various indicator changes are shown. Note that the median of the differences (c) is not the difference between the median of 2014/15 (b) minus the median of 2011/12 (a) (which would be 18%) but rather the median of the differences of all the facilities shown in that column (which in this case was 15.3%). The difference-in-median differences is shown in the next column and is simply the difference between the median of the differences for facilities with WBOTs (c) (15.3%) and facilities without WBOTs (d) (6.1%), which in this example is 9.2%.
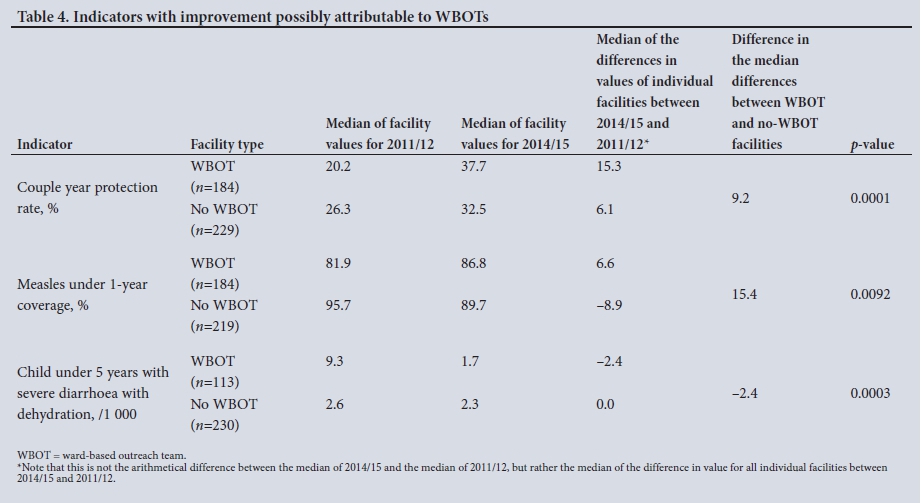
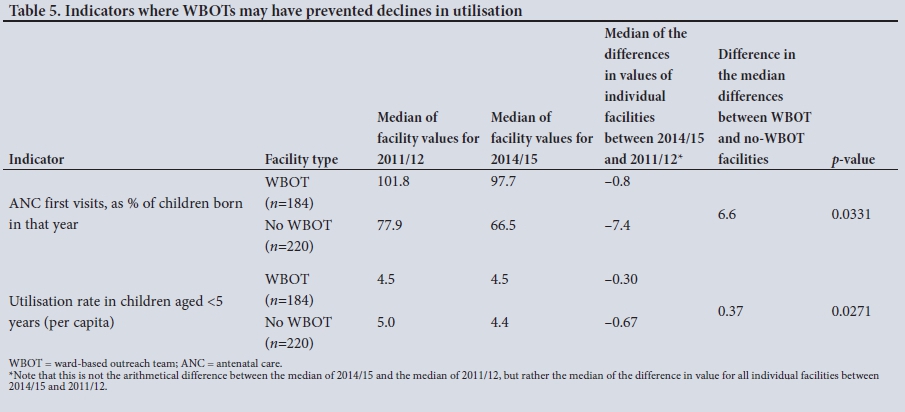
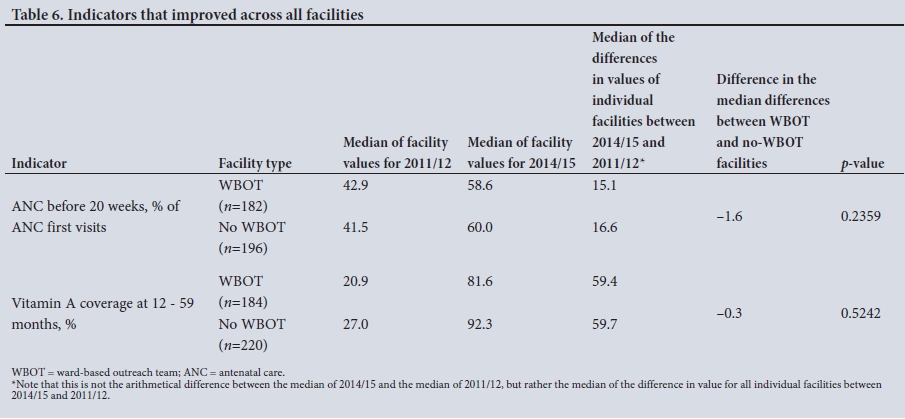
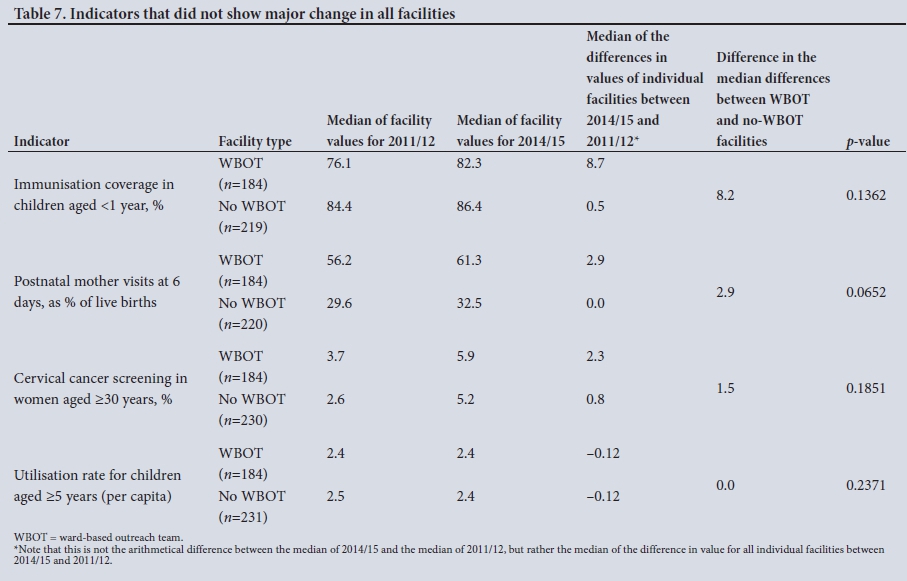
Changes in indicator values between 2011/12 and 2014/15 for facilities with WBOTs and facilities without WBOTs have been grouped into the following four categories: (i) indicators where there was greater (statistically significant) improvement in facilities with WBOTs than in those without (we refer to these changes as 'possibly attributable to the activities of the WBOT') (Table 4); (ii) indicators that declined or worsened, but less so in facilities with WBOTs, at statistically significant levels (Table 5); (iii) indicators that improved in all facilities, with no statistically significant difference between facilities with and without WBOTs (Table 6); and (iv) indicators that remained unchanged in all facilities, with and without WBOTs (Table 7).
In Tables 4 - 7, the following are presented for facilities with and without WBOTs: median values for 2011/12; median values for 2014/15; the median of the differences in facility values between 2011/12 and 2014/15 (note that this is not the difference between the median of 2014/15 and the median of 2011/12, but rather the median of the differences of all the facilities, as illustrated in Table 3); the comparison of the median differences (difference-in-differences) between facilities with and without WBOTs; and the level of significance of this difference.
Changes in indicators possibly attributable to WBOTs
Couple year protection rates improved in all facilities (Table 4). However, there was a larger and significantly greater increase in these rates in facilities with a WBOT than in those without a WBOT. Measles coverage in children aged <1 year increased in WBOT facilities, while it decreased in facilities without WBOTs. There was a significant decrease in cases of severe diarrhoea in facilities with a WBOT and no change in facilities without a WBOT. Of note are the baseline differences between WBOT and non-WBOT facilities in 2011/12, a pattern that is present across many of the indicators. In general, facilities with WBOTs appeared to be performing worse at baseline.
Indicators where WBOTs may have prevented declines in utilisation
Antenatal coverage and under-5 utilisation rates declined in all facilities, but significantly less so in facilities with WBOTs, as shown in Table 5.
Indicators that improved in all facilities
The indicators ANC before 20 weeks as a percentage of ANC first visits and vitamin A coverage at 12 - 59 months improved substantially in all facilities, but with no statistically significant difference between facilities with and without WBOTs (Table 6).
Indicators that did not change in all facilities
Several indicators showed small or no change in facilities with and without WBOTs. This included overall immunisation coverage, postnatal visit attendance, cervical screening attendance and general PHC facility utilisation rates for children aged >5 years (Table 7). Although overall immunisation coverage had a greater improvement in facilities with WBOTs, this was not statistically significant.
Discussion
This study offers a methodology, referred to as a plausibility design, for use of routine data to evaluate impacts of WBOTs implemented at scale that could be applied elsewhere. It is not only useful for researchers conducting evaluations but can also become part of ongoing monitoring by health system managers. The difference-in-differences analysis method allows for comparisons of changes in performance between facilities with and without WBOTs even in the presence of baseline differences, rather than just coarse changes in absolute values before and after the implementation of the intervention.
Although the data were not always of good quality and needed thorough cleaning, the analysis found that facilities with WBOTs appeared to perform better than facilities without WBOTs on some indicators. The findings concur with the international evidence on the role of CHWs in maternal, child and reproductive health.[12,17] The specific profile of changes found in NWP could be related to the training and other activities of WBOTs. CHWs monitor Road-to-Health cards of children aged <5 years and refer those with missed vaccinations to health facilities. As part of household visits, CHWs encourage family planning among women in the reproductive years, and in NWP they specifically provided them with language-appropriate educational material.[18] They also provided health promotion to caregivers in households, gave advice on hygiene, demonstrated how to prepare and administer a dehydration solution and advised when to refer children with diarrhoea. Interestingly, rates for vitamin A coverage and ANC below 20 weeks improved substantially in all facilities, which implies that activities or interventions other than WBOTs may have influenced these changes. Notably, during the period of analysis, there were several community-based campaigns to increase vitamin A supplementation coverage across the province.
Study limitations
The analysis assumed that facilities with WBOTs were not systematically different to facilities without WBOTs. However, there were significant baseline differences between the two groups. Although the difference-in-differences technique specifically caters for these scenarios,[16] it is possible that there was a selection bias operating, with 'intervention' sites generally having lower performance at baseline and therefore greater potential for improvement, or other characteristics (e.g. motivation, leadership) that would have influenced outcomes. Further analyses would need to consider such possible confounding factors.
Another limitation is the crude categorisation of intervention and control sites as having a WBOT or not. Facilities and WBOTs are not coterminous, as the latter cover specific municipal wards, but facilities typically serve several geographical wards and many did not have full coverage by WBOTs. Facilities were required to have just one functional WBOT team to be classified as intervention clinics, while the facility data were analysed for the whole catchment population. The number of WBOTs known to exist and their establishment period was under-reported in the DHIS, so it was not possible to calculate the dose-response relationship. The net effect of this is potential differential misclassification of facilities with WBOTs, leading to an underestimation of WBOT impacts on coverage and utilisation. Greater use of activity and coverage indicators from the WBOTs themselves would allow for analyses that are more refined. This would also be relevant in later stages of scale-up when most facilities become linked with WBOTs. Finally, the quality of the data, despite thorough cleaning to eliminate outliers and gaps, poses threats to the validity and reliability of the findings. Given these limitations, the results should be interpreted with caution, and repeated analyses conducted over time. Increased use of routine information, such as in this analysis, may stimulate increased accuracy of data collection, and greater confidence in the findings.
Conclusion
WBOTs may have had positive effects on the overall performance of the PHC system. However, their plausible influence on performance can be reliably measured only if the quality of routine data is improved, and if adequate support for and greater value is attached to monitoring and evaluation. We propose a methodology to evaluate the performance of WBOTs that could be applied elsewhere. Public health institutions could have an important role to play in supporting and building capacity in the greater use of such methods of programme evaluation. As data quality improves for WBOTs in the DHIS, further evaluations could examine dose-response relationships in facilities with WBOT with low and high coverage and also facilities with longer v. recently established WBOTs.
Acknowledgements. North West Province Department of Health.
Author contributions. All authors were involved in the drafting and final version of the manuscript. All authors approved submission of the final version.
Funding. University of the Western Cape/South African Medical Research Council Health Services to Systems Unit.
Conflicts of interest. None.
References
1. World Health Organization. The World Health Report 2008 - Primary Health Care: Now More Than Ever. Geneva: WHO, 2008. http://www.who.int/whr/2008/whr08_en.pdf (accessed 23 November 2016). [ Links ]
2. Campbell J, Admasu K, Soucat A, Tlou S. Maximizing the impact of community-based practitioners in the quest for universal health coverage. Bull World Health Organ 2015;93(9):590-590A. https://doi.org/10.2471/blt.15.162198 [ Links ]
3. Paim J, Travassos C, Almeida C, Bahia L, MacInko J. The Brazilian health system: History, advances, and challenges. Lancet 2011;377(9779):1778-1797. https://doi.org/10.1016/s0140-6736(11)60054-8 [ Links ]
4. National Department of Health, South Africa. Provincial Guidelines for the Implementation of the Three Streams of PHC Re-engineering. Pretoria: NDoH, 2011:1. [ Links ]
5. National Department of Health, South Africa. CHW Audit Report Draft 1. Pretoria: NDoH, 2011. [ Links ]
6. Padayachee T, Chetty N, Matse M, Mampe T, Schneider H. Progress in the establishment of ward-based outreach teams: Experiences in the North West Province. In: South African Health Review 2013- 2014. Durban: Health Systems Trust, 2014:74. [ Links ]
7. National Department of Health, South Africa. An Investment Case for Ward Based Primary Health Care Outreach Teams: Draft Document. Pretoria: NDoH, 2016. [ Links ]
8. Dombo M, Seutlwadi L, Cois A. Assessing the Referrals to PHC facilities by Ward Based Outreach Teams in 24 Pilot Sites: North West Province. Durban: Health Systems Trust, 2015. [ Links ]
9. Schneider H, English R, Tabana H, Padayachee T, Orgill M. Whole-system change: Case study of factors facilitating early implementation of a primary health care reform in a South African province. BMC Health Serv Res 2014;14(1). https://doi.org/10.1186/s12913-014-0609-y [ Links ]
10. Mampe T, Jassat W. Ward-based PHC Outreach Teams: An Audit of Functional Teams in North West Province. Polokwane: Public Health Association of South Africa, 2014. [ Links ]
11. Neupane S, Odendaal W, Friedman I, Jassat W, Schneider H, Doherty T. Comparing a paper based monitoring and evaluation system to a mHealth system to support the national community health worker programme, South Africa: An evaluation. BMC Med Inform Decis Mak 2014;14(1). https://doi.org/10.1186/1472-6947-14-69 [ Links ]
12. Perry H, Zulliger R. How Effective are Community Health Workers? Baltimore, Md: Johns Hopkins Bloomberg School of Public Health, 2012. [ Links ]
13. Habicht J, Victora C, Vaughan J. Evaluation designs for adequacy, plausibility and probability of public health programme performance and impact. Int J Epidemiol 1999;28(1):10-18. https://doi.org/10.1093/ije/28.1.10 [ Links ]
14. Macinko J, Guanais FC, de Fatima M, de Souza M. Evaluation of the impact of the Family Health Program on infant mortality in Brazil, 1990 - 2002. J Epidemiol Community Health 2006;60(1):13-19. http://doi.org/10.1136/jech.2005.038323 [ Links ]
15. Mampe T, Schneider H, Reagon G. Effectiveness of Ward Based Outreach Teams in the North West Province: An Evaluation. Cape Town: University of the Western Cape, 2016. [ Links ]
16. Gertler P, Martinez S, Premand P, Rawlings L, Vermeersch C. Impact Evaluation in Practice. Washington, DC: World Bank, 2010. https://doi.org/10.1596/978-0-8213-8541-8 [ Links ]
17. Lassi ZS, Bhutta ZA. Community-based intervention packages for reducing maternal and neonatal morbidity and mortality and improving neonatal outcomes. Cochrane Database Syst Rev 2015, Issue 3. Art. No.: CD007754. https://doi.org/10.1002/14651858.CD007754.pub3 [ Links ]
18. World Health Organization (adapted by Health Systems Trust). A Guide to Family Planning for Community Health Workers and Their Clients. Durban: Health Systems Trust, 2013. [ Links ]
 Correspondence:
T Assegaai
mampetumelo@yahoo.com
Accepted 18 October 2017

