


Services on Demand
Article
 English (pdf)
 Article in xml format
 Article references
Indicators

Related links
-
 Cited by Google
 -
 Similars in Google
Share

 Permalink
SAMJ: South African Medical Journal
On-line version ISSN 2078-5135
Print version ISSN 0256-9574
SAMJ, S. Afr. med. j. vol.108 n.4 Pretoria Apr. 2018
http://dx.doi.org/10.7196/samj.2018.v108i4.12583
RESEARCH
Impact of 'Ideal Clinic' implementation on patient waiting time in primary healthcare clinics in KwaZulu-Natal Province, South Africa: A before-and-after evaluation
B A EgbujieI; A GrimwoodII; E C Mothibi-WabaforIII; G FattiIV; A M E T TshabalalaV; S AllieVI; G VilakaziVII; O OyebanjiVIII
IMBBS, MPH; Kheth'Impilo AIDS Free Living, South Africa
IIMB ChB, MPH; Kheth'Impilo AIDS Free Living, South Africa
IIIMB ChB, FRCP; Kheth'Impilo AIDS Free Living, South Africa
IVMB ChB, MPH;Kheth'Impilo AIDS Free Living, South Africa
VBA Cur Hons, MBA, PhD; Department of Health, Amajuba District, KwaZulu-Natal, South Africa
VIMB ChB, MSc; Kheth'Impilo AIDS Free Living, South Africa
VIIMB ChB; Kheth'Impilo AIDS Free Living, South Africa
VIIIMBBS, MPH; Kheth'Impilo AIDS Free Living, South Africa
ABSTRACT
BACKGROUND. Long waiting times are a major source of dissatisfaction for patients attending public healthcare facilities in South Africa (SA). The National Department of Health has identified this as one of six priority areas for improvement. Health system-strengthening (HSS) interventions to improve patient waiting time are being implemented in public health facilities across SA as part of the 'Ideal Clinic' model. The effect of these interventions on patient waiting time needs to be assessed and evidence generated for system improvement.
OBJECTIVES. To determine the effect of Ideal Clinic HSS intervention on patient waiting time in public health facilities in Amajuba District, KwaZulu-Natal Province, SA.
METHODS. We implemented 12 months of HSS activity, including facility reorganisation and patient appointment scheduling. The major outcome of interest was the total time spent by patients in a facility during a visit. This was calculated as the median time spent, obtained through a 'before-and-after' intervention survey. Univariate and multivariate factors associated with waiting time were determined.
RESULTS. A total of 1 763 patients from nine clinics were surveyed before and after the intervention (n=860 at baseline and n=903 at follow-up). The median overall waiting time after the intervention was 122 minutes (interquartile range (IQR) 81 - 204), compared with 116 minutes (IQR 66 - 168) before (p<0.05). Individual facility results after the intervention were mixed. Two facilities recorded statistically significant reductions in patient waiting time, while three recorded significant increases (p<0.05). Patient load per nurse, type of service received and time of arrival in facilities were all independently associated with waiting time. Patients' arrival patterns, which were determined by appointment scheduling, played a significant role in the results obtained.
CONCLUSIONS. Implementation of the Ideal Clinic model in the selected facilities led to changes in patient waiting time. Observed changes were positive when a clinic appointment system was successfully implemented and negative when this was unsuccessful. We recommend strengthening of the appointment system component of the Ideal Clinic model to improve patient waiting time. Assessing facility waiting time performance in terms of average time spent by patients during a clinic visit was shown to be inadequate, and we suggest the inclusion of 'proportion of clients who spent above the national waiting time threshold during their visit' as a sensitive measure of performance.
Long waiting times are a major contributor to dissatisfaction among patients attending healthcare facilities[1,2] and present challenges for healthcare providers and managers.[3] There is an inverse relationship between waiting time and patient satisfaction in most healthcare settings.[4-6] According to the South African (SA) National Policy on Management of Patient Waiting Time in Out Patient Departments,[7] patient waiting time is defined as the amount of time a patient spends waiting for services in a health facility (hospital outpatient clinic, primary healthcare clinic (PHC) or specialist clinic). Patient waiting time has also been described in terms of the total amount of time spent by a patient from entry into a facility to exit. Clinic visits are lengthy in most public health facilities across SA, sometimes leading patients to skip appointments and move from clinic to clinic in search of one with a shorter waiting time.[8] Reducing patient waiting time in public health facilities has therefore been correctly identified by the SA National Department of Health (NDoH) as one of six priority areas.[9] This emphasis on reducing patient waiting time is captured in the 'Ideal Clinic' model recently introduced by the NDoH (http://www.idealclinic.org.za/). The model is currently being implemented in public health facilities in SA and presents a medium through which the country's health system can be strengthened and waiting time reduced. It is therefore important that evidence of the effect of such health system-strengthening (HSS) activity be documented.
The benefit derived from implementing HSS interventions will be difficult to illustrate if some form of evaluation is not conducted. Both the National Strategic Plan 2015 - 2020[10] and the National Development Plan 2030[11] emphasise the need for operational research into healthcare interventions in SA as a means of generating evidence to improve quality of care. Published evidence of improvement in waiting time after HSS work is scanty.
Routinely ascertaining the gains achieved through implementing HSS activities will be difficult without appropriate methods. Measurements currently employed in public health facilities do not provide adequate information that could be used to drive and sustain health system improvements. As a basic requirement for managers of public health facilities across SA, waiting time surveys need to be conducted and presented in ways that provide good information about the patient's journey within the facility. A further deficiency is the presentation of patient waiting time as 'average waiting time'. Presenting waiting time as an average time spent conceals certain details about this journey and therefore does not provide the information that is needed for improvement. A different approach to data collection and analysis in public health facilities is required.
Kheth'Impilo (KI), a non-profit organisation funded by the United States President's Emergency Plan for AIDS Relief (PEPFAR) and the United States Agency for International Development (USAID), supported the Amajuba District health department in implementing several HSS activities. These included the implementation of the Ideal Clinic model, of which improving patient waiting time is a component. Amajuba District is in KwaZulu-Natal Province and is one of the pilot National Health Insurance districts in SA.
Objectives
To measure the change in waiting time following implementation of interventions as part of the Ideal Clinic model in public health facilities in Amajuba District.
Methods
Study setting and design
We implemented this HSS intervention in 10 facilities in the three subdistricts of Amajuba District. Nine of the 10 selected facilities are in rural or periurban areas and one is in an urban area.
We conducted 'before-and-after' operational research on the HSS activities that were implemented in the 10 public health facilities. The complete implementation involved a three-step process of baseline survey (data collection), intervention, and follow-up survey (data collection). For both the baseline and follow-up surveys, two facilities were surveyed per day and the 10 completed in 5 days. The baseline survey (data collection) was conducted in October 2014 while the follow-up data collection was conducted in November 2015 following 12 months' implementation of the intervention activities.
Sampling
The 10 facilities where intervention was implemented were purposefully selected by the Amajuba District management team and recommended to KI for the Ideal Clinic implementation activity. All the facilities were PHCs, with different patient loads and hours of operation. One of the facilities was originally surveyed but not supported with intervention, and was replaced with another facility that was not surveyed at baseline but was supported with improvement activities. In each of the facilities, survey participants were selected using a purposeful sampling method as recommended by the waiting time survey guideline in the NDoH Integrated Clinical Service Management (ICSM) manual.[12] The guideline stipulates that the first 100 clients who arrive at a health facility on the day of the survey be recruited. Participation was not optional, so all the first 100 clients were surveyed.
Intervention description
The intervention activities are part of the implementation of the Ideal Clinic model for PHCs in SA. The model includes activities such as facility reorganisation, staff training and infrastructure upgrade. One intervention activity involves reorganising health service delivery in facilities into three broad streams (acute illness, chronic disease, and maternal and child health) instead of the existing multiple streams (acute minor illness, antenatal care, antiretroviral therapy (ART), chronic non-communicable disease (NCD), child health curative, doctor visit, family planning, HIV counselling and testing (HCT), immunisation, tuberculosis (TB), well-baby clinic, pharmacy/medipost, dressings/injections, and other) as recommended in the Ideal Clinic policy. Before the intervention, patients requiring a consultation for multiple illness were referred and attended to by different healthcare workers (HCWs) in several different rooms in several different streams. This multiple-stream approach required patients to pass through multiple consultations if they had more than one illness complaint on a clinic day. HCWs were also equipped or required to attend to one illness complaint in one consultation. With the Ideal Clinic intervention, patients receive consultation for all illness complaints from the same HCW once in a consulting room, rather than having to pass from one to another if additional services are required. HCWs are trained and equipped for this multiple function through the NDoH Primary Care (PC) 101 policy. The policy manual describes how to manage most PHC-level conditions. More details about PC 101 and the implementation can be found on the Ideal Clinic website (https://www.idealclinic.org.za/docs/guidelines/PC%20101%20Guideline%20v 2_%202013%2014.pdf). The full description of the Ideal Clinic facility reorganisation process is contained in the ISCM manual[12] and will not be discussed for the purpose of this article. Another major activity we implemented as part of the intervention was the design and implementation of an appointment scheduling system for chronic disease as well as maternal and child health patients. We designed and printed clinical appointment registers that were used to book patients into preselected clinic dates, based on their disease condition and needs, and trained facility staff in the use of these registers. Designing the registers was critical to the success of the intervention, as we had observed that a few facilities that attempted to implement appointment scheduling were not successful owing to improper implementation and the use of inappropriate tools. To implement appointment scheduling, we supported the facilities to determine their daily patient load capacity based on their staff strength. We did this by reviewing the patient head count and the number and categories of staff in each facility. We also determined the distribution of patient type for each facility and used this to determine how many patients in each category a facility should book per day. Implementation of the appointment scheduling process was preceded by a month's patient education at waiting areas in facilities, where information about the appointment system and its implications for patient services was shared. We hoped that this education would ensure buy-in from the patients and smooth implementation of the strategy.
Data collection and analysis
Ten volunteer student nurses assisted with the facility data collection. They were given a day's training on the use of the survey tools and procedures for data collection from patients. This training was followed by on-site pilot data collection to enhance their understanding. We adapted the NDoH's recommended waiting time survey tool with few adjustments. The NDoH's recommended methodology and tool for measuring waiting times can be found in the ICSM manual.[12] On each day of data collection, all survey personnel synchronised their watches to ensure uniformity and reliability of the times they recorded. We stationed survey personnel at the entrance of each facility to record arrival and departure times of survey participants, and also had survey personnel at all service delivery points including card registration, vital signs room and drug collection point to track service start and end times.
On arrival at the facility, each client was handed a uniquely numbered data collection sheet (the patient tool), which was handed back on exiting. The survey personnel used a different data collection tool (survey personnel tool) to document the start and end of each type of service a patient received. Each patient was uniquely identified for timing from the patient tool they carried throughout their journey in the facility for the day.
We created a database using Excel 2013 (Microsoft, USA) where all collected survey data were entered for storage. The Excel data for each facility were then imported into SPSS version 17 (IBM, USA) for analysis. To compensate for over- and under-sampling of facilities due to the sampling method recommended in the Ideal Clinic manual, we applied post-stratification weighting to the continuous data for all inferential analysis. Weighting was based on the patient head count of the facilities. We then analysed the pooled data from individual facilities. All analysis was done using SPSS version 17. We used frequency charts for descriptive analysis of waiting variables and calculated median waiting time with the accompanying interquartile range (IQR) as the measure of central tendency. Because the observed waiting times were not normally distributed, we calculated the mean rank-sum values for waiting time and used the Mann-Whitney (7-test for testing statistical significance. The χ2 test was used to check for associations between categorical variables, while multivariable linear regression was used to analyse factors independently associated with overall patient waiting time. The major outcome of interest in our study was the total waiting time, described as the total time a patient spent during one visit to the clinic. We calculated this as the difference in time between when the client entered the facility and when they exited.
Results
A total of 1 763 patients from nine facilities were successfully surveyed, 860 in the initial survey and 903 in the follow-up survey. One facility each from the baseline and follow-up surveys was excluded from the analysis because they were only surveyed once at baseline or follow-up.
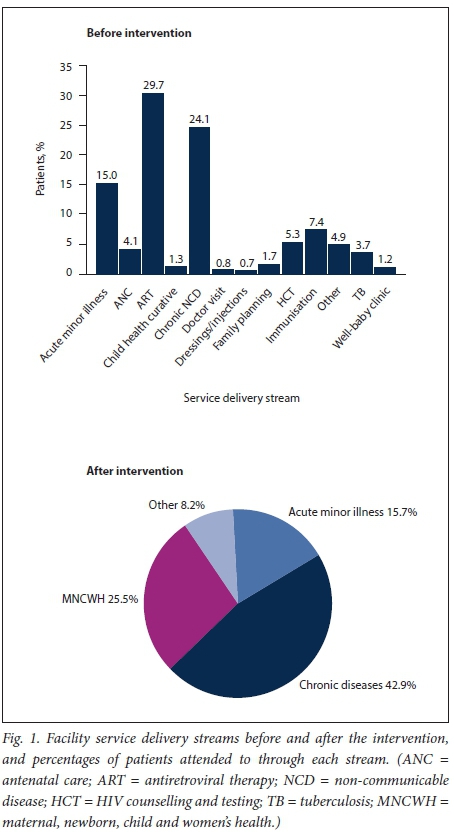
Before intervention, health services in the facilities were delivered along 13 different streams. These were scaled down and grouped into only three streams as part of the intervention, in line with the NDoH Ideal Clinic and maintenance strategy. Fig. 1 shows the different streams of services and the percentages of clients seen through each in the health facilities before and after the interventions. The results show that overall patient categories did not change drastically after the intervention. Chronic NCD, ART and TB patients, who before the intervention accounted for 21%, 26% and 3%, respectively, or a combined 50% (unweighted) of all patients seen at baseline, were grouped in the chronic stream that accounted for 43% (unweighted) of all patients seen during the follow-up survey. Likewise, patients with acute minor illness accounted for 13% of all patients at baseline and 16% in the follow-up survey.
Patients' times of arrival varied, and differed significantly between baseline and follow-up (p<0.05). At baseline, the first surveyed patient arrived at the facility gate at 04h45 and the last at 14h57, while at follow-up, the first surveyed patient arrived at 05h20 and the last at 15h40. Seventy-seven percent of all surveyed patients arrived at the health facilities before 10h00 at baseline, 41% of them between 06h00 and 08h00, while at follow-up, 76% of all surveyed patients arrived before 10h00, with 53% arriving between 06h00 and 08h00.
Time of arrival was significantly associated with patient waiting time both before (χ2=44) and after intervention (χ2=190) (p<0.05, Kruskal-Wallis test). Before intervention, arriving at the facilities between 08h00 and 10h00 was significantly associated with a longer waiting time than arrival at any other 2-hour interval during the day (p<0.05). After the intervention, arrival before 08h00 was significantly associated with a longer waiting time than any other 2-hour interval during the day. All but one of the clinics showed significant differences in arrival pattern between baseline and follow-up (p<0.05). The proportion of surveyed patients arriving between 06h00 and 10h00 decreased significantly in three facilities and increased in four, while two had similar proportions arriving during both surveys. The three facilities where arrival between 06h00 and 10h00 decreased recorded reductions in overall waiting time, while the three facilities where arrival between 06h00 and 10h00 increased recorded increases in waiting time.
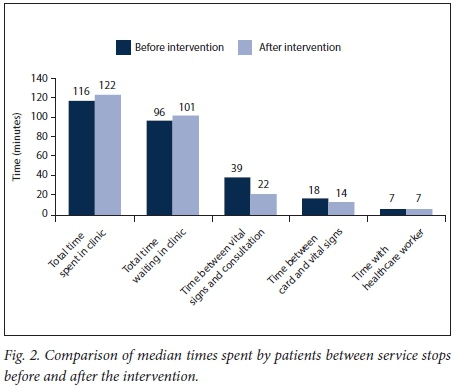
In the facilities, patients spent most of their time waiting between service points, and only a small fraction of the time receiving clinical consultation service. Before the intervention, 83% of total patients' time was spent waiting between services. Patients spent a median time of 96 minutes (IQR 45 - 148) waiting between service points, only 7 minutes (IQR 4 - 13) or 6% of their total time spent in the facilities receiving clinical consultation. Likewise, after the intervention 83% of patient time was spent waiting between service points, while time spent receiving clinical consultation services remained unchanged at 7 minutes (IQR 4 -13) or 6% of overall time spent. Before the intervention, patients waited the longest between completion of vital signs and clinical consultation, while after the intervention they waited the longest between arrival and card registration. The median time patients waited from when vital signs were completed to when the consultation started was 39 minutes (IQR 11 - 96) before the intervention and 22 minutes (IQR 9 - 56) after the intervention. This difference is statistically significant (Mann-Whitney [U-test [U=249 344, p<0.05). Fig. 2 shows the median time spent by patients between various service points in facilities before and after the intervention.
Waiting time varied according to the type of service patients received. Before the intervention, patients who came for TB services, doctor visits and wound dressings spent 62 minutes, 67 minutes and 62.5 minutes, respectively, representing the shortest times spent, while those who came for acute minor illness, chronic NCD and HCT services spent 120 minutes, 132 minutes and 148 minutes, respectively, representing the longest times spent. The difference in time spent by service type was statistically significant at p<0.05, χ2=40 (Kruskal-Wallis test). After the intervention, patients who came for maternal, newborn, child and women's health (MNCWH) and chronic services spent 110 minutes and 191 minutes, respectively, while those who came for acute minor illness spent 75 minutes. This difference was also statistically different at p<0.05, χ2=50 (Kruskal-Wallis test).
The median total waiting time for the pooled data was 116 minutes (IQR 66 - 168) before and 122 minutes (IQR 81 - 204) after the intervention, a statistically significant increase (Mann-Whitney U-test [/=407 704, p<0.05). In analysis of unpooled data, five facilities recorded reduced waiting times after the intervention, two of them statistically significant (p<0.05). Conversely, four facilities recorded an increased median waiting time, three of them statistically significant (p<0.05). Table 1 shows median patient waiting times before and after the intervention across all facilities.
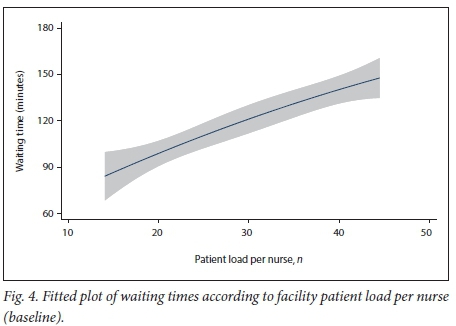
The analysis showed that improvement in waiting time was affected by the spread of patients' arrival in facilities. Facilities that achieved wider, more evenly spread arrival times recorded reduced waiting times, while facilities where the spread became narrower and less even recorded increased waiting times. Fig. 3 shows a comparison between the spread in patient arrival in five facilities that recorded statistically significant changes after the intervention (two improved and three became worse).
With reference to the NDoH waiting time benchmark of 3 hours, 21% of all surveyed patients spent more than 3 hours in the facilities before and 32% after the intervention, a statistically significant difference (p<0.05). The difference in percentages of patients who spent more than 3 hours before and after intervention varied between facilities. Like total waiting time, two facilities recorded statistically significant reductions in the percentage of patients who spent more than 3 hours during their visit (p<0.05). Four facilities recorded a significant increase. Facilities that showed the highest change in patients waiting more than 3 hours also showed the greatest change in total waiting time.
We noted, however, that although eight out of nine facilities (89%) reported a total waiting time of less than the NDoH benchmark of 3 hours before the intervention, 21% of all patients still spent more than 3 hours during their visit. Before the intervention, patients who came for HCT, MNCWH and child curative services were more likely to spend more than 3 hours than patients who came for a doctor visit or TB services (p<0.05). After the intervention, patients were more likely to spend more than 3 hours if they came for chronic or MNCWH services than if they came for acute minor illness services. As expected, the number of patients who spent more than 3 hours was significantly associated with total waiting time both before and after the intervention, and we found a strong correlation between spending more than 3 hours and increased waiting time (p<0.05).
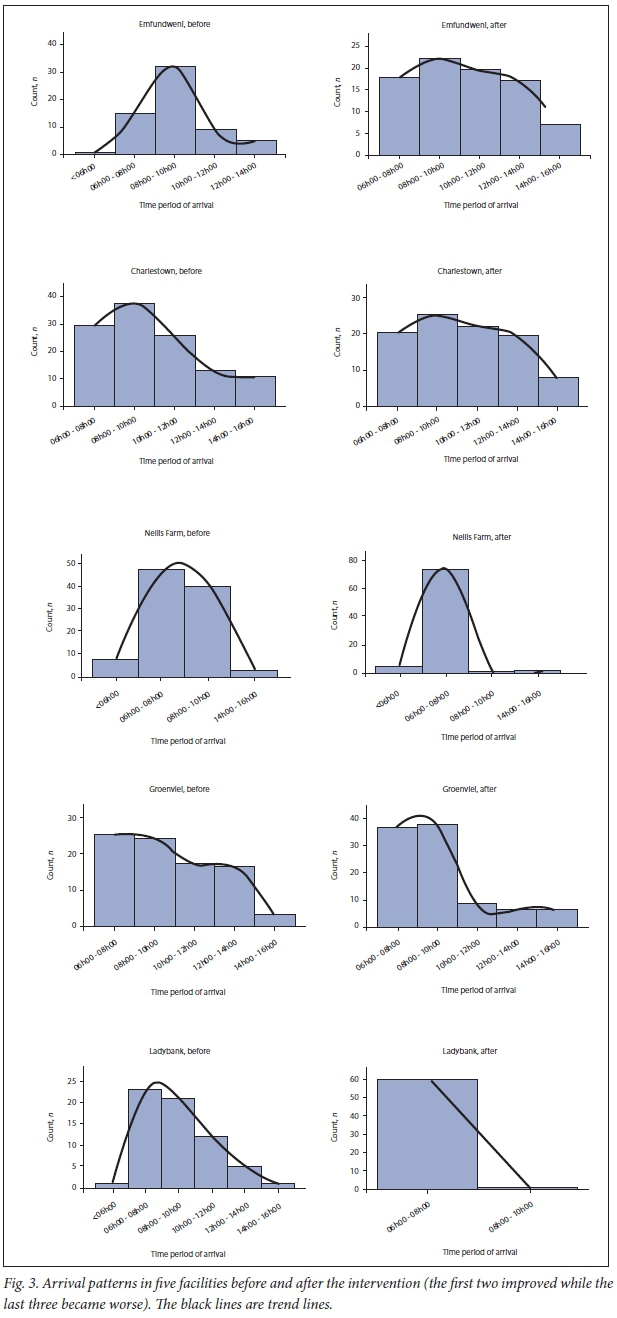
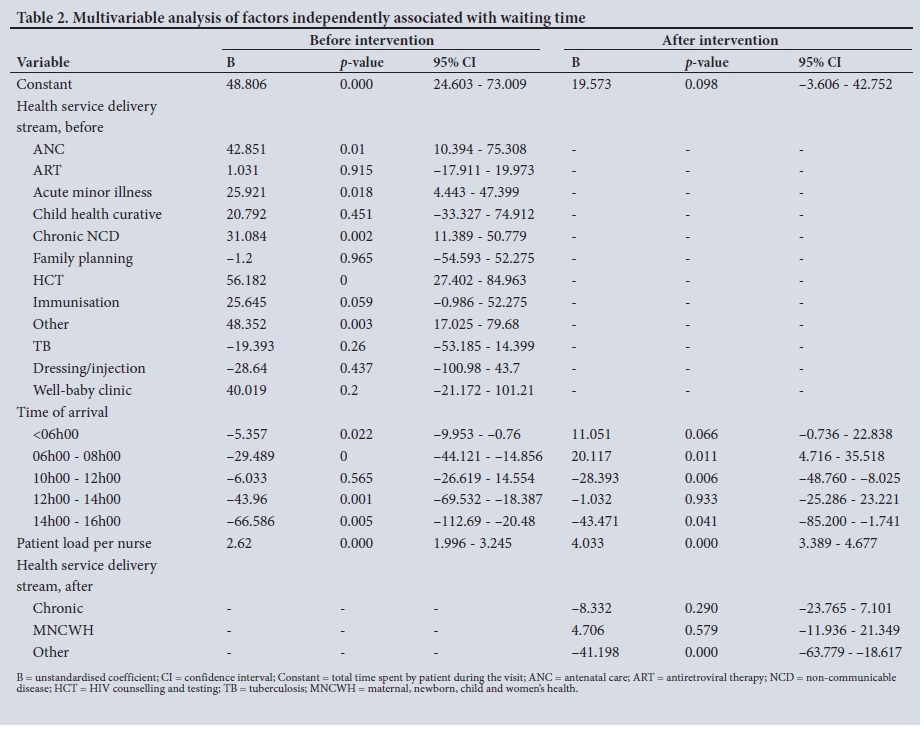
Multivariable analysis showed the following factors to be independently associated with waiting times before the intervention: (i) a higher patient/nurse ratio (+26 minutes' additional waiting time per additional 10 patients per nurse, 95% confidence interval 20 - 32; p<0.0001) (Fig. 4); (ii) type of service area; and (iii) time of patient arrival in the facility.
In a follow-up survey, patient load per nurse, type of service received and time of arrival all retained their independent association with waiting time (Table 2). The time period 08h00 - 10h00 was used as the reference period in conducting regression analysis, and the service types doctor visit and acute minor illness were used as reference points before and after intervention, respectively.
Discussion
We sought to demonstrate changes in patient waiting time following the implementation of HSS intervention strategies in selected public health facilities in SA. We found mixed changes in waiting time following 1 year's implementation of improvement interventions.
Some facilities showed statistically significant reduction in total time spent following the interventions, while others did not (Table 1). We largely attribute the improvement seen in some facilities to proper implementation of the patient appointment scheduling system. Facilities that improved their patient waiting time recorded a wider and more evenly spread patient arrival pattern after the intervention compared with before, while facilities that showed no improvement or where waiting time increased after the intervention recorded a narrower spread in patient arrival (Fig. 3). A wider and more even spread in patient arrival is largely achieved through proper appointment scheduling using the designed tool. Prior to the intervention, we found various forms of appointment scheduling system in the facilities. Use of diaries and notebooks to schedule clinic appointments is ineffective, as patients are often overbooked because the notebooks and diaries do not have time provision. Hence facilities are not able to determine upfront how many patients they have already scheduled for a particular day, resulting in overbooking. Our main strategy was to reduce the daily overbooking of patients and ensure an even spread of booked patients through the day. While the appointment scheduling worked as planned in some facilities, it did not in others. Although we designed and distributed appointment registers and trained people in their use in all the selected facilities, implementation and outcome differed between facilities. As shown in Fig. 3, three facilities failed to achieve a wider and more even spread in patient arrival, recording significant increases in waiting time after the intervention. In contrast, two facilities achieved a wider and more even distribution of patient arrival, leading to reduced waiting time after the intervention. Several factors may have affected proper implementation of the appointment scheduling system, one being access to the facility using public transport. Some of the surveyed facilities are located in places with poor access to public transport, leaving patients depending on it only able to arrive during certain window periods in the morning and only able to leave during certain periods in the afternoon. Patients in these facilities will therefore always arrive within a short time period in the morning, regardless of their appointment time slot. Apart from access to public transport, patient co-operation with the facility plan is required for the scheduling system to work. In our intervention, appointment scheduling was preceded by a 1-month period of patient education and community engagement to obtain buy-in. The process may not have achieved similar success across all facilities, leading to poor implementation of the appointment system. Research into the implementation of the appointment scheduling system is necessary to establish more comprehensive reasons for its lack of success.
In addition to the effect our interventions could have had on patient waiting time, it is important to note the significant role patient load plays in determining the total time spent by a patient in a facility. There is a positive correlation between patient load per nurse and time spent by patients (r=0.418, n=1 576, p<0.0001). We found a 26-minute increase in total waiting time for each additional 10 patients per nurse in the facilities before the intervention and a 40-minute increase after. Facilities with higher patient load per nurse had longer total patient waiting time. We observed that patient load was associated with the location of the facility. Facilities in urban or periurban areas with good access to public transport recorded high head counts, while those in remote locations with poor access to public transport recorded very low head counts. This observation suggests that facility location needs to be considered when determining why some facilities record long waiting times and others do not. High patient/nurse ratios in facilities are not only a function of the number of nurses allocated to the facility by the district management team or the patient head count - they sometimes reflect human resources management practice in a facility. In some cases, we found that facilities with an acceptable allocation of nurses based on their head count nevertheless had long patient waiting times. In such facilities, factors such as absenteeism due to illness, planned leave or funeral attendance may mean that there are too few staff members to handle the usual patient load. As an illustration, a facility that employs three nurses will experience exponentially increased waiting time if one nurse is on leave and another is unexpectedly absent for any of the above reasons. Recognising this challenge, we helped facilities to determine their staff strength and patient head count and calculate a realistic number of patients to be seen each day by appointment (allowing for arrival of acutely ill patients without an appointment), and to recognise that planning of staff leave is important in improving patient waiting time.
Reducing the total time spent in facilities needs to be closely monitored to ensure it is not achieved at the expense of time a patient spends with an HCW, as this could be counterproductive, leading to low patient satisfaction.[5] We found that the proportion of total patient time spent in a consultation remained the same after the intervention. This finding was unexpected, as we assumed that with only three streams of services, patients would spend more time with an HCW since all the services they required were now provided by a single HCW. The reasons for the lack of change in proportion of time spent in consultation are not immediately obvious, and this will be a useful study to pursue in the future. Increasing the proportion of the total time spent with HCWs could be a key driver and determinant of patient satisfaction with the facilities. We did not collect data that could have enabled us to demonstrate whether quality of care or patient satisfaction increased after the intervention. However, we are optimistic that increased consultation time will translate to better-quality care. We suggest that future studies of waiting time be integrated with assessment of patients' perceived quality of care and satisfaction. Further exploration of the associations between implementation of the Ideal Clinic model and patient satisfaction will be useful.
In addition to tracking changes in waiting time, we intended to use our survey approach to demonstrate that reporting total waiting time, as is currently done in public health facilities, produces inadequate and possibly misleading information about patients' journey through the facilities. Total waiting time (mean or median time) represents average time spent, which unintentionally conceals the individual patient journey through facilities, depriving managers of useful information that could support the design of appropriate interventions for improvement. Our baseline analysis showed that only one out of the nine facilities surveyed had an average waiting time longer than 3 hours. However, 21% of all patients spent more than 3 hours in the facilities and several patients spent more than the 3-hour threshold in all facilities. This finding highlights the problem associated with the average time measurement method: average waiting time implies that it is acceptable for some patients to stay very long in facilities as long as other patients stay short enough to keep the average above the threshold. Compared with average waiting time, tracking the proportion of patients who spend more than 3 hours (or any other threshold stipulated by the NDoH) in a facility is more likely to cover each individual. New cut-off points for this percentage will need to be decided as well. Based on our findings, it is possible that all clients attending public health facilities can be seen within 3 hours, irrespective of where the facility is located and what type of service they receive. The implication is that a new performance indicator looking at the percentage of clients who exit a facility before 3 hours should be used. This performance measure can also be categorised by service stream if necessary.
We therefore suggest that total waiting time as a measure of time spent by patients in public health facilities (especially PHCs and CHCs) be complemented if not replaced by the number and percentage of patients who spend more than the benchmark time in a facility. The latter is more likely to provide information for improvement.
This study has shown that implementing the Ideal Clinic model does have some effect on patient waiting time. This impact can be negative or positive depending on the implementation of the components, especially appointment scheduling.
Several factors should be considered when efforts to improve waiting time are planned. Location of a facility plays significant role in how patients access it, and this will eventually affect appointment scheduling. It is important that health authorities consider location when planning new facilities. Where patients find it difficult to access existing facilities, multisector involvement including the transport, health and social services departments will be required for meaningful change. We employed advocacy, requesting the transport department to increase or set up new transport routes to remotely located facilities during our intervention. However, this is a highlevel engagement that facility teams may not be able to carry out on their own.
Waiting time surveys should be carefully planned, with data processing for valuable information in mind at the outset. Understanding service points and staff composition and strength is crucial to developing a useful survey. Clinic appointment registers are valuable in reducing waiting time if their use is properly implemented. In our intervention, facilities improved when appointment registers were used correctly and became worse when they were not, leading to high-volume batch arrival at the clinic (Fig. 3). More evenly spread appointments (arrivals) led to improved waiting time, while batch arrival early in the day is known to lead to long waiting time. ' B One of the major challenges we encountered in implementing this intervention was the variation in facility set-up for flow of patients. Patient movement from arrival at the facility through the processes of card registration, vital signs measurement, consultations and other activities differed significantly between facilities. It was therefore important for us to adapt the waiting time survey and process tracking to suit each facility we investigated.
Study limitations
Although we made every effort to ensure rigour and accuracy of the research findings, several aspects of the study were outside our control and could potentially have limited their value. Selection of facilities for the surveys was purposeful rather than random. Patient selection was also not random, as we used the first 100 patients who arrived on the day of the survey. Both these methods of selection could have introduced bias in the findings and mean that our sample is not representative of other public health facilities in the district, province or country. This will limit generalisability of our findings to all facilities in SA. However, the findings present credible information on what is happening in the facilities included, and should form the basis for further enquiries.
Conclusion
This study suggests that a significant reduction in patient waiting time in public health facilities in SA is achievable with proper intervention and measurement strategies while working within the Ideal Clinic framework established by the NDoH. We recommend urgent scale-up of a clinic appointment system in all PHCs, as it will significantly reduce patient waiting time. The clinic appointment booking register needs to be revised, standardised across the board, and properly implemented. Furthermore, the use of total waiting time as a benchmark for patient waiting time is inadequate. We recommend a different marker, the proportion of patients who stay above the national threshold waiting time (3 hours), to monitor waiting time in PHCs.
Acknowledgements. The authors gratefully acknowledge the NDoH and the departments of health of KwaZulu-Natal and Amajuba District for their co-operation.
Author contributions. BAE: first author, led intervention design from KI, conceptualised the study, conducted data collection, cleaning, storage and analysis, contributed to all sections of the manuscript; AG: reviewed and revised the programme concept, reviewed, proofread and edited the manuscript; ECM-W: reviewed and revised the programme concept, reviewed, proofread and edited the manuscript, contributed to the discussion section; GF: contributed to data analysis; AMETT: Amajuba district manager, led intervention design from the Department of Health, contributed to the manuscript and reviewed the finalised article; SA: contributed to discussion of intervention outcome and the manuscript discussion section, assisted with data collection; GV: KI district manager, responsible for implementing the waiting time intervention in the facilities, managed data collection from study participants; OO: contributed to discussion of intervention outcome.
Funding. KI is a non-profit organisation. This work was made possible by funding from PEPFAR through USAID SA.
Conflicts of interest. None.
References
1. Eilers GM. Improving patient satisfaction with waiting time. J Am Coll Health 2004;53(1):41-48. https://doi.org/10.3200/JACH.53.L41-48 [ Links ]
2. Zhecheng Z, Hoon HB, Liang TK. Reducing consultation waiting time and overtime in outpatient clinic: Challenges and solutions. In: Kolker A, Story P, eds. Management Engineering for Effective Healthcare Delivery: Principles and Applications. IGI Global, 2012:229-245. https://doi.org/10.4018/978-1-60960-872-9.ch011 [ Links ]
3. Sastry A, Long KNG, de Sa A, et al. Collaborative action research to reduce persistently long patient wait times in two public clinics in Western Cape, South Africa. http://www.thelancet.com/pdfs/journals/langlo/PIIS2214-109X(15)70137-3.pdf (accessed 5 March 2018). [ Links ]
4. Michael M, Schaffer SD, Egan PL, Little BB, Pritchard PS. Improving wait times and patient satisfaction in primary care. J Healthc Qual 2013;35(2):50-60. https://doi.org/10.1111/jhq.12004 [ Links ]
5. Anderson RT, Camacho FT, Balkrishnan R. Willing to wait?: The influence of patient wait time on satisfaction with primary care. BMC Health Serv Res 2007;7:31. https://doi.org/10.1186/1472-6963-7-31 [ Links ]
6. Pandit DA, Varma EL, Pandit DA. Impact of OPD waiting time on patient satisfaction. Int Educ Res J 2016;2(8). http://ierj.in/journal/index.php/ierj/article/view/423/400 (accessed 25 February 2018). [ Links ]
7. National Department of Health, South Africa. National Policy on Management of Patient Waiting Time in Out Patient Departments. Pretoria: NDoH, 2015. https://www.idealclinic.org.za/docs/policies/Patient%20Waiting%20time%20Policy %2014%20November%202016%20PDF.pdf (accessed 23 February 2017). [ Links ]
8. Masango-Makgobela AT, Govender I, Ndimande JV, Ndimande JV. Reasons patients leave their nearest healthcare service to attend Karen Park Clinic, Pretoria North. Afr J Prim Health Care Fam Med 2013;5(1). https://doi.org/10.4102/phcfm.v5i1.559 [ Links ]
9. Republic of South Africa. Operation Phakisa: Ideal Clinic Realisation and Maintenance: Final Lab Report. 2015. https://www.idealclinic.org.za/docs/2016/phakisa/Operation%20Phakisa %20Ideal%20Clinic%2 0Realisaation%20&%20Maintenance%20Final%20report%20May%202015.pdf (accessed 22 April 2017). [ Links ]
10. National Department of Health, South Africa. Strategic Plan 2015 - 2020. Pretoria: NDoH, 2015. http://www.health.gov.za/index.php/2014-03-17-09-09-38/strategic-documents/category/229-2015str (accessed 10 September 2017). [ Links ]
11. National Planning Commission, South Africa. National Development Plan 2030: Our Future - Make it Work. Pretoria: NPC, 2010. [ Links ]
12. National Department of Health, South Africa. Integrated Clinical Services Management Manual. Pretoria: NDoH 2015. https://www.idealclinic.org.za/docs/Integrated%20Clinical%20Services%20Management %20%20Manual%205th%20June%20FINAL.pdf (accessed 26 March 2018). [ Links ]
13. Wagenaar BH, Gimbel S, Hoek R, et al. Wait and consult times for primary healthcare services in central Mozambique: A time-motion study. Glob Health Action 2016;9. https://doi.org/10.3402/gha.v9.31980 [ Links ]
 Correspondence:
B A Egbujie
greatdabon@yahoo.com
Accepted 26 October 2017.

