


Serviços Personalizados
Artigo
 Inglês (pdf)
 Artigo em XML
 Referências do artigo
Indicadores

Links relacionados
-
 Citado por Google
 -
 Similares em Google
Compartilhar

 Permalink
SAMJ: South African Medical Journal
versão On-line ISSN 2078-5135
versão impressa ISSN 0256-9574
SAMJ, S. Afr. med. j. vol.108 no.3 Pretoria Mar. 2018
http://dx.doi.org/10.7196/samj.2018.v108i3.12756
RESEARCH
A retrospective time trend study of firearm and non-firearm homicide in Cape Town from 1994 to 2013
R MatzopoulosI, II; J SimonettiIII; M PrinslooIV; I NeethlingV; P GroenewaldVI; J DempersVII; L J MartinVIII; A Rowhani-RahbarIX, X; J E MyersI; M L ThompsonXI
IPhD; School of Public Health and Family Medicine, Faculty of Health Sciences, University of Cape Town, South Africa
IIPhD; Burden of Disease Research Unit, South African Medical Research Council, Cape Town
IIIHMD, MPH; Harborview Injury Prevention and Research Center, University of Washington, Wash., USA
IVMPH; Burden of Disease Research Unit, South African Medical Research Council, Cape Town
VMSc; Burden of Disease Research Unit, South African Medical Research Council, Cape Town
VIMB ChB, MPhil (Public Health); Burden of Disease Research Unit, South African Medical Research Council, Cape Town
VIIFC For Path (SA); Department of Forensic Medicine, Faculty of Medicine and Health Sciences, Stellenbosch University, Cape Town, South Africa
VIIIFC For Path (SA); Department of Forensic Medicine, Faculty of Health Sciences, University of Cape Town, South Africa
IXMD, PhD; Harborview Injury Prevention and Research Center, University of Washington, Wash., USA
XMD, PhD; Department of Epidemiology, University of Washington, Wash., USA
XIPhD; Department of Biostatistics, University of Washington, Wash., USA
ABSTRACT
BACKGROUND. Gunshot injuries from interpersonal violence are a major cause of mortality. In South Africa (SA), the Firearms Control Act of 2000 sought to address firearm violence by removing illegally owned firearms from circulation, stricter regulation of legally owned firearms, and stricter licensing requirements. Over the last few years, varied implementation of the Act and police corruption have increased firearm availability.
OBJECTIVES. To investigate whether changes in firearm availability in SA were associated with changes in firearm homicide rates.
METHODS. This was a retrospective time trend study (1994 - 2013) using postmortem data. Time trends of firearm and non-firearm homicide rates were analysed with generalised linear models. Distinct time periods for temporal trends were assigned based on a priori assumptions regarding changes in the availability of firearms.
RESULTS. Firearm and non-firearm homicide rates adjusted for age, sex and race exhibited different temporal trends. Non-firearm homicide rates either decreased or remained stable over the entire period. Firearm homicide increased at 13% annually from 1994 through 2000, and decreased by 15% from 2003 through 2006, corresponding with changes in firearm availability in 2001, 2003, 2007 and 2011. A 21% annual increase in firearm homicide after 2010 coincided with police fast-tracking new firearm licence applications. Cape Town's coloured population experienced a significantly greater increase than other population groups following additional exposure to illegal firearms from 2007.
CONCLUSIONS. The strong association between firearm availability and homicide, and the reversal of a decreasing firearm homicide trend during a period of lax enforcement, provide further support for the association between reduced firearm homicide and stricter regulation.
South Africa (SA) had one of the world's highest homicide rates in 2000, estimated to be five and eight times higher than the global average for females and males, respectively.[1] There was a significant decrease in the homicide rate over the subsequent decade,[2-4] and a retrospective study of 37 067 firearm and non-firearm homicide cases across five SA cities from 2001 to 2005 found a significantly greater decline in the rate of firearm compared with non-firearm homicide. [5] Given the established association between firearm availability and firearm homicide rates,[6] the magnitude, timing and consistency of the decline suggested that it was attributable to the Firearms Control Act of 2000 (FCA).[7]
The FCA was adopted in April 2001 and sought to address firearm violence by removing illegally owned firearms from circulation, stricter regulation of legally owned firearms, and stricter firearm licensing requirements.[7] Its provisions were gradually implemented from 2000 to 2003, resulting in a gradient of declining firearm access in SA. There was a considerable reduction in approvals following the promulgation of the FCA, particularly from 2003 onwards.[8] The police conducted an audit of state-owned firearms in 2003, and undertook special operations to recover unlicensed weapons, the most important of which was conducted in 2003. This corresponded with a decrease in the number of lost and stolen firearms and a simultaneous increase in confiscations.[9] The stricter firearm control regimen was strengthened further with the publication of the regulations pertaining to the FCA in March 2004.[10]
The association between firearm availability and firearm homicide in SA is not unexpected, given the international experience. In the USA, firearm ownership is known to be a significant predictor of firearm homicide rates.[11] In Europe, an Austrian study showed that more restrictive firearm legislation reduced both firearm homicide and firearm suicide rates,[12] and in Australia researchers observed faster reductions in firearm deaths and suicides and a decade without mass shootings following the introduction of gun law reforms, which removed semiautomatic and pump-action shotguns and rifles from civilian possession.[13]
However, in SA, the decreasing overall homicide rates observed in police data were reversed after 2011, most notably in the Western Cape Province.[14] This coincided with an increase in gunshot fatalities recorded in national death notifications between 2010 and 2013[15] and a 'remarkable increase in the number of new firearm licences, renewals and competency certifications 'beingj processed ... accredited to the implementation of a nine-month turnaround strategy ...'.[16] By August 2011, the police claimed to have cleared their licensing backlog by finalising more than 1 million firearm applications, licence renewals and competency certificates.[16] In Cape Town, there was also an increase in the circulation of illegal firearms from 2007 after they were diverted from police custody by corrupt officials, particularly to gangs located in coloured communities (as per SA apartheid population group classifications).[17-21]
While a previous study assessing the relationship between FCA implementation and homicide rates in five SA cities was limited by the short time period considered due to the unavailability of mortality data for some of those cities after 2005,[5] Cape Town has had extensive surveillance of injury mortality from the mid-1990s through 2014.[ 22-26]
Objectives
To assess the association between changes in firearm availability and firearm and non-firearm homicide rates in Cape Town between 1994 and 2013 and to assess the effect on communities of differential firearm availability.
Methods
We conducted a retrospective population-based time trend study of all homicide cases reviewed at Cape Town's two forensic pathology service facilities in Salt River and Tygerberg.
Homicide and covariate data sources
South Africa's Inquests Act[27] requires postmortem examination by a forensic pathologist or medical practitioner for all deaths from non-natural causes (e.g. injuries). We obtained city-wide homicide data from 1994 to 2013 from Cape Town all-injury mortality surveillance[22-26] and corresponding population estimates from the mid-year estimates for the Western Cape produced by the Centre for Actuarial Research at the University of Cape Town.[28] The ratio method[29] was used to estimate the annual City of Cape Town population by race, sex and 5-year age groups between 1994 and 2014.
Key variables
Annual homicide counts were categorised by age, sex, race, year and homicide type (firearm or non-firearm). Age was grouped into six intervals. Race was recorded according to the apartheid population group classifications (black, coloured, Asian, white), which provides a gross proxy measure to reflect the differential manner in which apartheid affected, and continues to affect, the health of communities.[30] Race also serves as an accurate proxy for socioeconomic status at the population level, and represents a range of invidious psychological and social effects on individuals, families and communities that account for the differences in risk of exposure to violence. We omitted homicides with the classification Asian' from our analyses because of small numbers. Missing age (3.1%) and race data (3.0%) were imputed proportionally, conditional on sex, year of death and type of homicide.
We estimated the timing of major shifts in firearm availability from the published literature, South African Police Service (SAPS) annual reports from 1991 to 2014, and summary data provided by the SAPS Central Firearms Registry (Appendix 1). The number of firearms in circulation began to plateau from 2001, following the promulgation of the FCA,[7] and decreased further from 2003, when the provisions of the new legislation began to take effect.[31] From 2011 onwards, there was an increase in firearm availability after firearm licensing controls were relaxed. In the Cape Flats, an area with a predominantly coloured population, firearm availability increased from 2007 when corrupt police officials and gun dealerships sold firearms marked for destruction to gangs in this area.[17-21] In summary, we assumed that changes in Cape Town firearm availability occurred in 2001, 2003, 2007 and 2011.
Statistical analysis
We calculated crude homicide mortality rates per 100 000 population by age, sex, race and year. We compared temporal trends in firearm and non-firearm homicide rates and examined the extent to which the known changes in firearm availability in 2001, 2003, 2007 and 2011 related to trends in firearm homicides, distinct from trends in non-firearm homicides. We also compared trends in firearm homicides across race groups. Annual homicide rates were modelled with generalised linear models with Poisson family, log link and robust standard errors. Year of death was modelled by a series of linear splines with change-points at 2000, 2002, 2006 and 2010, corresponding to the changes in firearm availability in 2001, 2003, 2007 and 2011. In model 1, we adjusted for age, sex and race, and included an interaction term for year of death and type of homicide to compare firearm and non-firearm homicide temporal trends. Given evidence of differential firearm availability by race group (i.e. increased access to illegal firearms primarily in the coloured community from 2007), model 2 focused on firearm homicides only and included an interaction term for year of death and race group, allowing us to assess differences in changes in firearm homicide rates over time across race groups. In both models, the denominator was the annual covariate-specific population size, which accounted for demographic changes and provided a measure of person-time. We carried out sensitivity analyses for models 1 and 2 in which the spline trend change-points were moved earlier and later by 1 year to assess the impact of estimating the timing of changes in firearm availability erroneously.
We estimated excess firearm deaths among coloureds between 2007 and 2010 as the difference between the model 2 predicted firearm homicide deaths among coloureds and the predicted coloured deaths if the coloured firearm homicide rate had changed, year-on-year, at the same (pooled) rate as in blacks and whites over that period. To estimate excess death counts for blacks and whites from 2011 to 2013, we assumed that, without the increased supply of firearms over that period, firearm homicide rates would have changed at the same rate, year-on-year, as non-firearm homicide rates as estimated in model 1. We considered excess firearm deaths among coloureds from 2011 to 2013 as having two components: (i) the difference between the predicted number of deaths among coloureds under model 2 and the predicted number of deaths if coloured firearm homicide rates had changed year-on-year at the same rate as in blacks and whites after 2006 (this difference would reflect the impact of increased access to illegal firearms); and (ii) the difference between the predicted number of deaths if coloured firearm homicide rates had changed year-on-year after 2006 at the same rate as in blacks and whites and the predicted number of coloured deaths if coloured firearm homicide rates after 2010 had changed at the same rate as non-firearm homicide rates as estimated in model 1 (this difference would reflect the impact of increased access to legal firearms). Taylor series approximations were used to obtain confidence intervals (CIs) for the excess death counts.
Statistical analysis was conducted using Stata version 12 (StataCorp, USA). Statistical significance was set at p<0.05.
Ethics
The University of Cape Town's Health Sciences Faculty Human Research Ethics Committee approved the study (ref. no. 633/2014), and permission to utilise the data was granted by the Provincial Department of Health's Research Committee (ref. no. 2014RP123).
Results
A total of 36 207 homicide cases were identified from the Cape Town surveillance data between 1994 and 2013, excluding 1997 and 1998, for which city-wide data were not available, and excluding 109 Asian homicides. Firearm-related homicides peaked in 2002 at 1 192 and accounted for almost half (49.2%) of all homicides in Cape Town in that year. The lowest annual number of firearm-related homicides recorded was 477 in 2009, accounting for 29.0% of all homicides in that year (Table 1).
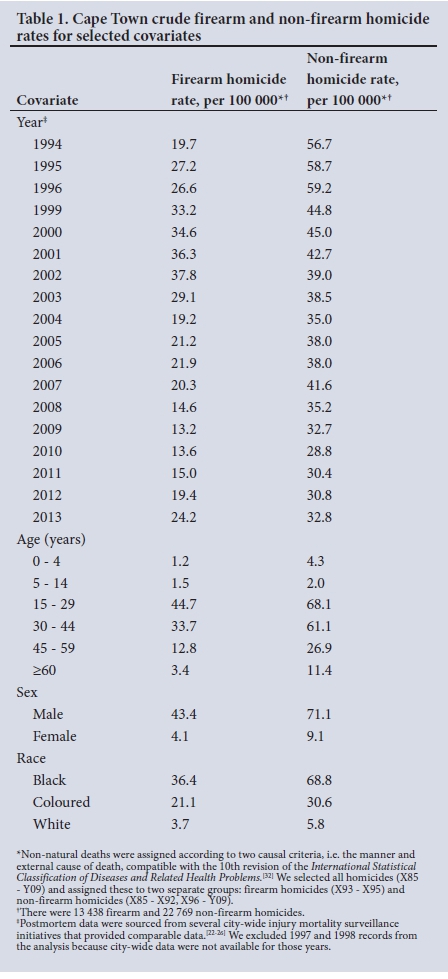
The crude firearm homicide rate in Cape Town in 1994 was 19.7 per 100 000, compared with 56.7 per 100 000 for non-firearm homicide. By 2000, the firearm homicide rate increased to 34.6 per 100 000, whereas non-firearm homicide decreased to 45.0 per 100 000. By 2010, the firearm homicide rate was 61% lower than in 2000 at 13.6 per 100 000, whereas the non-firearm homicide rate had decreased by 36% to 28.8 per 100 000 (Table 1).
In model 1, which included all homicides (firearm and non-firearm), all covariates were significantly associated with homicide rates (Table 2). The homicide rate among youths and young adults aged 15 - 29 years was significantly higher than among adults aged 30 - 44 years, who in turn experienced higher homicide rates than older adults and children. Males experienced significantly higher homicide rates than females. Homicide rates among blacks were higher than among coloureds or whites, with homicide rates among whites being substantially lower than in both the other race groups.

Firearm and non-firearm homicide rates adjusted for age, sex and race exhibited different temporal trends, with the trends in firearm homicide rates corresponding to the known changes in firearm availability in 2001, 2003, 2007 and 2011. In 1994, the firearm homicide rate was significantly lower than the non-firearm homicide rate, but thereafter there was a significant 13% year-on year increase in the firearm homicide rate until 2000, whereas there was a significant 7% annual decrease in non-firearm homicide rates over the same period. The firearm homicide rate stabilised from 2000 to 2002 and decreased significantly by 15% from 2003 through 2006. After 2010, firearm homicide rates increased significantly by 21% per annum. In contrast, non-firearm homicide rates either decreased or remained stable over the entire period. The year-on-year firearm and non-firearm homicide rate ratios were significantly different over the periods 1994 - 2000 and 2002 - 2006 (p<0.001, Table 2). Firearm and non-firearm homicides declined at similar rates over the period 2006 - 2010. After 2010, firearm homicide rates increased more rapidly than non-firearm homicide rates, although this difference was not statistically significant (p=0.096).
Estimated and observed annual homicide rates from model 1 are shown in Fig. 1. The increases in firearm homicide rates from 1994 to 2000 and after 2010 both coincided with increasing availability of firearms, respectively preceding the FCA and with the dramatic increase in the approval of licence applications after 2010. The period of decrease in firearm homicides coincided with the introduction of the FCA (in 2000) and the decrease accelerated with its implementation (from 2003). The non-firearm homicide rate followed a generally decreasing trend and did not exhibit significant increases over the study period.

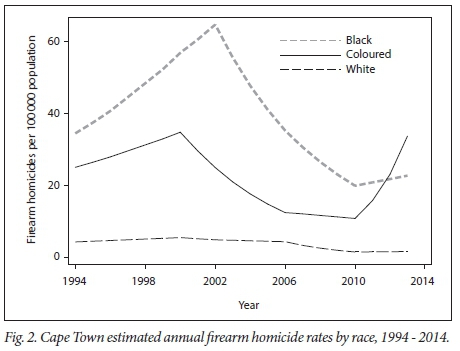
Having established differences in temporal trends in firearm and non-firearm homicide rates, and that these differences coincide with known changes in firearm availability, our second objective was to compare firearm homicide rates across race groups. Model 2, which included only firearm homicides, indicated that the changes in firearm homicide followed a different temporal pattern for coloureds relative to other races (Table 3 and Fig. 2). The decreasing trend in firearm homicide rates that began in all race groups after the introduction of the FCA in 2000 was sustained among blacks and whites until 2010, after which firearm homicide rates began to increase for all population groups, coinciding with easier access to legal firearms. Among coloureds, the decrease was not sustained after 2006, which coincided with firearms being supplied through illicit channels. After 2010 the rate of increase in firearm homicide for coloureds was significantly higher than for other race groups. While the firearm homicide rates among blacks and whites are significantly different, the year-on-year rate ratios for blacks and whites did not differ significantly over the study period.

We estimated that 181 (95% CI 38 - 324) excess deaths of coloureds from 2007 to 2010 and 821 (95% CI 446 - 1 196) excess deaths of coloureds from 2011 to 2013 were attributable to the increased supply of firearms through illicit channels. In addition, we estimated that over 2011 - 2013, 56 (95% CI -240 - 352) excess deaths of blacks, 20 (95% CI -84 - 123) of coloureds and 1 (95% CI -20 - 21) of whites were attributable to increased access to firearms as a result of less stringent application of FCA licensing provisions after 2010.
Sensitivity analyses shifting the location of the spline change-points forwards and backwards by 1 year yielded results that were substantively in good agreement with those reported here.
Discussion
Our study found that changes in the firearm homicide rate in Cape Town from 1994 to 2013 were associated with changes in firearm availability due to varying implementation of the FCA over this time period, i.e. stricter implementation of the FCA was associated with declines in firearm availability and declines in the firearm homicide rate. These findings are consistent with a previous study of five SA cities from 2001 to 2005[5] and a recent national study of gunshot deaths recorded in death notifications from Statistics South Africa from 1997 to 2013.[15] The present study is also consistent with multiple studies assessing the association between firearm availability and homicide in the USA and other high-income countries.[33-36]
Our findings further strengthen the evidence regarding the effectiveness of the FCA, given that this study analysed data from a 20-year period surrounding the passage of the FCA and included a non-firearm homicide control group that was not available from other sources. The Inquests Act of 1959 precludes forensic pathologists from reporting the manner of death in death notification so as not to prejudice the findings of the inquest.[37] Previous studies have shown that data from mortuaries provide more comprehensive reporting of female homicides[38] and overall homicides[2,14] than official statistics of the SAPS.
The analysis of firearm homicide trends by race revealed differences among rates in the coloured community compared with other race groups at times that again can be explained by differential firearm availability. The post-2010 coloured homicide rate was of similar magnitude to its 2002 peak and significantly different from other race groups. Although increases in both legally and illegally obtained firearms are shown to be associated with homicide rates, it is the illegal trade that seems to have had a more pronounced effect, if the rates in the coloured population are indicative. After controlling for other potentially strong explanatory determinants of homicide, namely race, age and sex, we attribute the bulk of the excess mortality in this population to the increased exposure to illegally obtained firearms. It is also possible that some of the excess mortality among blacks and whites after 2010 could be attributable to the circulation of these illegal weapons. A recent police ballistics investigation linked 1 066 murders and 1 403 attempted murders and 315 other crimes in Cape Town between 2010 and 2016 directly to these firearms, including 261 cases where children were the victims.[39]
It remains possible that there are other factors associated with the differential increase in firearm homicide (relative to non-firearm homicide) in Cape Town after 2010, but which we have not been able to account for. One possibility is an increase in gang activity during this period,[40] particularly in the coloured community. However, increased gang activity would not explain the disproportionate increase in firearm homicides. Rather, the evidence of guns being placed with gangs suggests that the gang conflicts arose from the increased supply.
A recent survey of more than 200 interpersonal violence prevention experts identified research regarding firearm regulations as one of two global research priorities.[41] A recent systematic review of the effect of firearm legislation on firearm-related injuries, which considered 130 studies in 10 countries, found that the implementation of laws introducing multiple firearms restrictions, such as the FCA, was associated temporally with reductions in firearm deaths.[42] However, our findings suggest additionally that the relaxation of gun laws may have the opposite effect. The reversal of the decreasing firearm homicide trend in our study during a time of lax enforcement provides further support for the positive relationship between firearm control policies and legislation and firearm homicide.
Our findings demonstrate the dramatic effect of increasing firearm availability to criminals directly. However, even if legally owned firearms are considered less of a threat to public safety, increased availability through legal channels cannot be ignored even if diffusion to criminals through theft is more gradual. In 2004, SA's firearm theft ratio of one firearm stolen for every 150 legally owned firearms was more than three times higher than the ratio in the USA.[43]
Our findings provide a stronger indication of the association between firearm availability and firearm homicide than a recent Australian time trend study from 1976 to 2013, which measured changes in firearm deaths following enactment of stricter gun laws and a buy-back programme.[44] The Australian study noted a more rapid decline in gun deaths following the gun law reforms, but, unlike in our study, a decline in non-firearm suicide and homicide deaths over the same period made it impossible to attribute the changes to gun law reforms.
Study limitations
There are two limitations to take into account when interpreting the findings of our study. First, assumptions regarding the timing of changes in firearm availability are based on secondary sources. There is more uncertainty in estimating unregistered than registered firearms. Second, we assumed increased exposure for the coloured community due to the identities of implicated individuals and groups and their reported areas of operation, but note that race provides only a crude measure to differentiate exposure to risk. The legacy of apartheid does still determine how and where the great majority of South Africans live, but the effects are gradually diminishing.
Conclusions
Strict firearm control is one of the few policy options likely to effect a reduction in homicide rates at a population level in relatively short time periods in societies with high rates of violence. Our study highlights the importance of consistent implementation of such policies and legislation, and also demonstrates their vulnerability in countries with jurisdictional instabilities such as SA.
The findings add to the cumulative international evidence that higher rates of firearm ownership and access are associated with higher rates of firearm-related death and that firearm legislation may affect firearm ownership rates. Improved mortality reporting would facilitate identifying and monitoring factors that differentially affect firearm and non-firearm homicides. Current death notification administered by the SA Department of Home Affairs (the DHA-1663 form) should be updated to comply with the revised World Health Organization international death certificate that includes the manner of death.[45] Annual police crime reporting should disaggregate firearm and non-firearm homicides. They should also provide annual data on firearms in circulation in various sectors (police, military, civilian, private security, etc.), as well as estimated changes in the pool of unlicensed weapons due to lost and stolen firearms. In addition, evidence emerging from recent court proceedings suggests that routine ballistics testing to 'fingerprint' every firearm should be part of the firearms control regimen to validate the source of firearms used in criminal acts.
As a signatory to several international agreements including the United Nations Programme of Action on Small Arms,[46] the Arms Trade Treaty[47] and the regional Southern African Development Community Protocol,[48] SA has an obligation to manage weapon stockpiles effectively. This is over and above the essential tenets of the FCA, which unambiguously set out to reduce the number of firearms in circulation.
Acknowledgements. We are grateful to Nesbert Zinyakatira of the Western Cape Department of Health and the University of Cape Town School of Public Health for his assistance in estimating Cape Town population trends, and to Claire Taylor (Gun Free South Africa), Johan Burger (Institute for Security Studies), David Bruce (Centre for the Study of Violence and Reconciliation) and Tonnea Bradbury for their work in obtaining information on firearms in circulation from SAPS annual reports.
Author contributions. RM, JS, MLT and JEM conceived and designed the study; JS, RM, MLT, JEM and AR-R analysed the data; RM, JS, MP, IN, PG, JD, LJM, AR-R, JEM and MLT contributed to the writing of the manuscript; RM, JS, MP, IN, PG, JD, LJM, AR-R, JEM and MLT agreed with the manuscript results and conclusions; RM, JS, MP, IN, PG, JD, LJM, AR-R, JEM and MLT: ICMJE criteria for authorship read and met.
Funding. RM, MP, IN and PG are funded by the South African Medical Research Council.
Conflicts of interest. None. RM serves on the board of Gun Free South Africa, but receives no remuneration for his service to the organisation.
References
1. Norman R, Bradshaw D, Schneider M, et al. Estimating the burden of disease attributable to interpersonal violence in South Africa in 2000. S Afr Med J 2007;97(8):653-656. [ Links ]
2. Matzopoulos R, Prinsloo M, Pillay-Van Wyk V, et al. Injury-related mortality in South Africa: A retrospective descriptive study of postmortem investigations. Bull World Health Organ 2015;93(5):303-313. https://doi.org/10.2471/BLT.14.145771 [ Links ]
3. South African Police Service. Crime report 2010/2011: SAPS Together Squeezing Crime to Zero: SAPS Members, My Family - Together Pushing Back the Frontiers of Evil. Pretoria: SAPS, 2011. [ Links ]
4. Abrahams N, Mathews S, Martin LJ, Lombard C, Jewkes R. Intimate partner femicide in South Africa in 1999 and 2009. PLoS Med 2013;10(4):e1001412. https://doi.org/10.1371/journal.pmed.1001412 [ Links ]
5. Matzopoulos RG, Thompson M Lou, Myers JE. Firearm and nonfirearm homicide in 5 South African cities: A retrospective population-based study. Am J Public Health 2014;104(3):455-460. https://doi.org/10.2105/AJPH.2013.310650 [ Links ]
6. Harvard Injury Control Research Center. Homicide. https://www.hsph.harvard.edu/hicrc/firearms-research/guns-and-death/ (accessed 13 July 2016). [ Links ]
7. South Africa. Firearms Control Act, 2000 (Act No. 60 of 2000). [ Links ]
8. South African Police Service. Central Firearm Registry Progress Report: April 2015 to March 2016. Pretoria: SAPS, 2016. [ Links ]
9. Meek S, Stott N. Operation Sethunya: Proactive policing can solve the illicit firearms problem. SA Crime Q 2004;10:27-33. [ Links ]
10. South Africa. Firearms Control Act of 2000: Firearms Control Regulations 2004. https://www.saps.gov.za/services/flash/firearms/legislation/gov_notice_english.pdf (accessed 13 February 2018). [ Links ]
11. Siegel M, Ross CS, King C. The relationship between gun ownership and firearm homicide rates in the United States, 1981 - 2010. Am J Public Health 2013;103(11):2098-2105. https://doi.org/10.2105/AJPH.2013.301409 [ Links ]
12. Kapusta ND, Etzersdorfer E, Krall C, Sonneck G. Firearm legislation reform in the European Union: Impact on firearm availability, firearm suicide and homicide rates in Austria. Br J Psychiatry 2007;191(3):253-257. https://doi.org/10.1192/bjp.bp.106.032862 [ Links ]
13. Chapman S, Alpers P, Agho K, Jones M. Australia's 1 996 gun law reforms: Faster falls in firearm deaths, firearm suicides, and a decade without mass shootings. Inj Prev 2006;12(6):365-372. https://doi.org/10.1136/ip.2006.013714 [ Links ]
14. Prinsloo M, Matzopoulos R, Laubscher R, Myers J, Bradshaw D. Validating homicide rates in the Western Cape Province, South Africa: Findings from the 2009 Injury Mortality Survey. S Afr Med J 2016;106(2):193-195. https://doi.org/10.7196/SAMJ.2016.v106i2.10211 [ Links ]
15. Matzopoulos R, Groenewald P, Abrahams N, Bradshaw D. Where have all the gun deaths gone? S Afr Med J 2016;106(6):589-591. https://doi.org/10.7196/SAMJ.2016.v106i6.10379 [ Links ]
16. South African Police Service. Annual Report 2011/2012. Pretoria: SAPS, 2012. [ Links ]
17. Serrao A. Cop, guns linked to gangsters. Star 23 March 2015. http://www.iol.co.za/news/crime-courts/cop-guns-linked-to-gangsters-1.1835604 (accessed 24 November 2015). [ Links ]
18. Dolley C. Police 'gave guns to gangs'. Weekend Argus 28 September 2014. http://www.iol.co.za/news/crime-courts/police-gave-guns-to-gangs-1.1756940 (accessed 8 February 2018). [ Links ]
19. Baadjies M. 'Dirty cop sold us 200 guns'. Daily Voice 15 July 2015. https://www.iol.co.za/news/crime-courts/dirty-cop-sold-us-200-guns-1885760 (accessed 8 February 2018). [ Links ]
20. Petersen T. Ex-cop gets 18 years for stealing, reselling guns to Cape gangsters. News24.com 21 June 2016. http://www.news24.com/SouthAfrica/News/ex-cop-gets-18-years-for-stealing-reselling-guns-to-cape-gangsters-20160621 (accessed 8 February 2018). [ Links ]
21. Thamm M. When hell is not hot enough?: A top cop who supplied weapons to country's gangsters and right wingers. Daily Maverick 4 July 2016. http://www.dailymaverick.co.za/article/2016-07-04-when-hell-is-not-hot-enough-a-top-cop-who-supplied-weapons-to-countrys-gangsters-and-right-win gers/#.V3pai2Zqb9I (accessed 8 February 2018). [ Links ]
22. Matzopoulos R. Establishing the foundations of an injury surveillance system in the Western Cape. Bachelor of Business Science dissertation. Cape Town: University of Cape Town, 1994. [ Links ]
23. Lerer LB, Matzopoulos RG, Bradshaw D. A Profile of Violence and Injury Mortality in the Cape Town Metropole, 1994. Tygerberg: Medical Research Council, 1995. [ Links ]
24. Cape Town Non-natural Mortality Study Group. Violence and Injury Mortality in the Cape Town Metropole, 1995. Tygerberg: Medical Research Council, 1996. [ Links ]
25. Butchart A, Peden M, Matzopoulos R, et al The South African National Non-Natural Mortality Surveillance System - rationale, pilot results and evaluation. S Afr Med J 2001;91(5):408-417. [ Links ]
26. Matzopoulos R, Martin LJ, Wadee S, et al. The Provincial Injury Mortality Surveillance System (PIMSS): A surveillance tool for the Western Cape. Inj Prev 2010;16(Suppl 1):A47-A48. https://doi.org/10.1136/ip.2010.029215.172 [ Links ]
27. South Africa. Inquests Act. Act No. 58 of 1959, as amended. [ Links ]
28. Dorrington R. Alternative South African Mid-year Estimates, 2013. Centre for Actuarial Research Monograph 13. Cape Town: University of Cape Town, 2013. http://www.commerce.uct.ac.za/research_units/care/monographs/monographs/mono13.pdf (accessed 8 February 2018). [ Links ]
29. Shryock HS, Siegel JS. The Methods and Materials of Demography. Condensed. San Diego: Academic Press, 1976. [ Links ]
30. Groenewald P, Bradshaw D, Daniels J, et al. Differential health needs of the population in Cape Town, South Africa: Local-level mortality surveillance in resource-limited settings: A case study of the City of Cape Town highlights disparities in health. Bull World Health Organ 2010;88(6):444-451. https://doi.org/10.2471/BLT.09.069435 [ Links ]
31. Ellis E. Licence applicants stick to their guns. Star 1 September 2003:13. [ Links ]
32. World Health Organization. International Statistical Classification of Diseases and Related Health Problems, 10th rev. Geneva: WHO, 2007. http://www.who.int/classifications/apps/icd/icd10online/ (accessed 8 February 2018). [ Links ]
33. Hepburn LM, Hemenway D. Firearm availability and homicide: A review of the literature. Aggress Violent Behav 2004;9(4):417-440. https://doi.org/10.1016/S1359-1789(03)00044-2 [ Links ]
34. Miller M, Hemenway D, Azrael D. State-level homicide victimization rates in the US in relation to survey measures of household firearm ownership, 2001 - 2003. Soc Sci Med 2007;64(3):656-664. https://doi.org/10.1016/j.socscimed.2006.09.024 [ Links ]
35. Swedler DI, Simmons MM, Dominici F, Hemenway D. Firearm prevalence and homicides of law enforcement officers in the United States. Am J Public Health 2015;105(10):2042-2048. https://doi.org/10.2105/AJPH.2015.302749 [ Links ]
36. Hemenway D, Miller M. Firearm availability and homicide rates across 26 high-income countries. J Trauma 2000;49(6):985-988. [ Links ]
37. Prinsloo M, Bradshaw D, Joubert J, Matzopoulos R, Groenewald P. South Africa's vital statistics are currently not suitable for monitoring progress towards injury and violence Sustainable Development Goals. S Afr Med J 2017;107(6):470-471. https://doi.org/10.7196/SAMJ.2017.v107i6.12464 [ Links ]
38. Abrahams N, Jewkes R, Martin LJ, Mathews S, Vetten L, Lombard C. Mortality of women from intimate partner violence in South Africa: A national epidemiological study. Violence Vict 2009;24(4):546-556. https://doi.org/10.1891/0886-6708.24.4.546 [ Links ]
39. Founding Affidavit in the Labour Court of South Africa, in the matter between the Police and Prisons Civil Rights Union (POPCRU): First Applicant, Peter Anthony Jacobs: Second Applicant, and Jeremy Alan Vearey: Third Applicant; and the Minister of Police: 2016. [ Links ]
40. Swingler S. The Cape's youth gangs: Bigger, deeper, more dangerous. Daily Maverick 7 May 2014:1-6. https://www.dailymaverick.co.za/article/2014-05-26-the-capes-youth-gangs-bigger-deeper-more-dangerous/ (accessed 8 February 2018). [ Links ]
41. Mikton CR, Tanaka M, Tomlinson M, et al. Global research priorities for interpersonal violence prevention: A modified Delphi study. Bull World Health Organ 2017;95(1):36-48. https://doi.org/10.2471/BLT.16.172965 [ Links ]
42. Santaella-Tenorio J, Cerdá M, Villaveces A, Galea S. What do we know about the association between firearm legislation and firearm-related injuries? Epidemiol Rev 2016;38(1):140-157. https://doi.org/10.1093/epirev/mxv012 [ Links ]
43. Karp A. From chaos to coherence: Global firearm stockpiles. In: Batchelor P, Krause K, eds. Small Arms Survey 2004; Rights at Risk. Oxford: Oxford University Press, 2004:43-75. http://www.smallarmssurvey.org/fileadmin/docs/A-Yearbook/2004/en/Small-Arms-Survey-2004-Chapter-02-EN.pdf/ (accessed 8 February 2018). [ Links ]
44. Chapman S, Alpers P, Jones M. Association between gun law reforms and intentional firearm deaths in Australia, 1979 - 2013. JAMA 2016;316(3):291-299. https://doi.org/10.1001/jama.2016.8752 [ Links ]
45. Groenewald P, Azevedo V, Daniels J, et al. The importance of identified cause-of-death information being available for public health surveillance, actions and research. S Afr Med J 2015;105(7):528-530. https://doi.org/10.7196/SAMJnew.8019 [ Links ]
46. United Nations. Report of the United Nations Conference on the Illicit Trade in Small Arms and Light Weapons in All Its Aspects. New York: United Nations, 2001:9-20. [ Links ]
47. United Nations Office for Disarmament Affairs. Arms Trade Treaty. New York: United Nations, 2013. https://www.un.org/disarmament/att/ (accessed 13 February 2018). [ Links ]
48. Southern African Development Community. Protocol on the Control of Firearms and Ammunition (2001). Blantyre: SADC, 2001. http://www.sadc.int/documents-publications/show/79i (accessed 13 February 2018). [ Links ]
 Correspondence:
R Matzopoulos
richard.matzopoulos@uct.ac.za
Accepted 27 September 2017
Summary of firearm availability in South Africa, and Cape Town specifically, from 1994 to 2013
1994 - 2000* Increasing firearm availability from new licences and caches from previous conflicts leaching into circulation, along with
inadequately secured state-owned weapons from various state departments and the security forces of former apartheid bantustans (self-governing rural states typically situated in remote marginally agricultural land).
• In 1996 the South African National Defence Force (SANDF) stockpiled 'war reserves' comprising 450 000 rifles, 17 000 pistols, and thousands of machine guns.[1]
• Theft of SANDF weapons peaked with 311 weapons stolen in 1998.[1]
• The SANDF destroyed 262 667 surplus weapons between 1998 and 2001.[1]
• The approval rate for new licence applications among civilians was extremely high. More than 1.1 million new licences were granted from 1994 to 2000, an average of 180 166 per annum.[2]
• By mid-1999 it was estimated that civilians owned 4.5 million firearms.[1]
• A firearm amnesty in 1994 and 1995 recovered only 900 weapons and 7 000 rounds of ammunition.[3]
• Relatively few confiscated and obsolete non-military state firearms (12 416) were destroyed in 1999.[4]
2001 - 2002* Plateauing firearm availability with the adoption of the Firearms Control Act, 2000 (Act No. 60 of 2000) (FCA),[5]
including more restrictive licensing and destruction of surplus weapons.
• The FCA was assented to in April 2001.[5]
• Theft of SANDF weapons averaged 96 per annum over the 2- year period.[1]
• The rate of new civilian licence applications approved dropped by 21% to an average of 143 157 annually.[2]
• Special operations by the police recovered 21 027 unregistered firearms in 2002, a similar number to the 22 120 firearms reported lost or stolen in that year.[6]
• In 2002, the police received additional human and physical resources to implement the FCA and appointed designated firearm officials.[1]
• Destruction of confiscated and obsolete state firearms increased to 30 023 in 2001 and 58 617 in 2002.[1]
2003 - 2010* Decreasing firearm availability in the general population as the provisions of the FCA came into effect, including
amnesties, audit of state-owned firearms, recovery operations, destruction of surplus weapons and confiscated weapons, and more restrictive licensing.
• The police conducted an audit of state-owned firearms in 2003.[4]
• The recovery of stolen and unregistered firearms increased through special operations such as Operation Sethunya. In 2003, 35 481 firearms and >1.5 million rounds of ammunition were recovered, which surpassed the 20 164 firearms reported stolen.[6]
• The police conducted wide-scale background checks for compliance with the FCA safety requirements among legal firearm owners from 2003, with a particular focus on owners with five or more weapons.[6]
• Stricter assessment of new firearm licence applicants commenced in April 2003, at which time there was a reported 70% refusal rate for new applications.[7]
• The rate of new civilian licence applications approved dropped to 25 234 per annum between 2003 and 2010.[2]
• The Firearm Control Regulations pertaining to the FCA were published in March 2004.[8]
• Firearm amnesties recovered 98 412 weapons in 2004 and 2005[9] and 32 169 weapons in 2009 and 2010.[10]
• Destruction of confiscated and obsolete state firearms increased to 87 097 in 2003.[4]
2007 - 2013 Increasing firearm availability in the coloured population through criminal gangs illegally obtaining weapons earmarked
for destruction.
• Firearm licences and firearms marked for destruction were fraudulently issued to Cape Town criminals by corrupt police officials and gun dealerships. More than 2 400 firearms were sold to Cape Town gang leaders between 2007 and 2014.[11-15]
2011 - 2013 Increasing firearm availability in the general population with less stringent application of the FCA provisions andincreased licensing.
• The head of Central Firearms Registry (CFR) was suspended and then demoted in 2010 as part of Minister of Police Mr Nathi Mthethwa's internal review.[16]
• As per the Minister's instruction, the police cleared the CFR backlog and finalised more than 1 million firearm applications including licence renewals and new licences.[17,18]
• The approval rate for new licences increased to an average of 88 842 per annum between 2011 and 2013.[2]
*These shifts in firearm availability are largely consistent with an independent estimate for the number of registered firearms from 1994 to 2011.[19]
References, Appendix 1
1. Gould C, Lamb G, Mthembu-Salter G, Nakana S, Rubel D. South Africa. In: Gould C, Lamb G, eds. Hide and Seek: Taking account of small arms in southern Africa. Pretoria: Institute for Security Studies, 2004. [ Links ]
2. Central Firearms Registry. Copy of License Applications 1994 - 2014. Central Firearms Registry, 2014. [ Links ]
3. Kirsten A. A Nation Without Guns. Durban: University of KwaZulu-Natal Press, 2008. [ Links ]
4. Meek S, Stott N. Destroying Surplus Weapons: An Assessment of Experience in South Africa and Lesotho. Geneva: United Nations Institute for Disarmament Research and Institute for Security Studies, South Africa, 2003. [ Links ]
5. South Africa. Firearms Control Act, 2000 (Act No. 60 of 2000). [ Links ]
6. Meek S, Stott N. Operation Sethunya: Proactive policing can solve the illicit firearms problem. SA Crime Q 2004;10:27-33. [ Links ]
7. Ellis E. Licence applicants stick to their guns. Star 1 September 2003:13. [ Links ]
8. South Africa. Firearms Control Act of 2000: Firearms Control Regulations 2004. https://www.saps.gov.za/services/flash/firearms/legislation/gov_notice_english.pdf (accessed 13 February 2018). [ Links ]
9. Kirsten A. Simpler, Better, Faster: Review of the 2005 Firearms Amnesty. Institute for Security Studies Paper 134. Pretoria: Institute for Security Studies, 2007. [ Links ]
10. South African Police Service. Central Firearm Registry Progress Report: April 2015 to March 2016. Pretoria: SAPS, 2016. [ Links ]
11. Serrao A. Cop, guns linked to gangsters. Star 23 March 2015. http://www.iol.co.za/news/crime-courts/cop-guns-linked-to-gangsters-1.183561 (accessed 24 November 2015). [ Links ]
12. Dolley C. Police 'gave guns to gangs'. Weekend Argus 28 September 2014. http://www.iol.co.za/news/crime-courts/police-gave-guns-to-gangs-1.1756940 (accessed 8 February 2018). [ Links ]
13. Baadjies M. 'Dirty cop sold us 200 guns'. Daily Voice 15 July 2015. https://www.iol.co.za/news/crime-courts/dirty-cop-sold-us-200-guns-1885760 (accessed 8 February 2018). [ Links ]
14. Petersen T. Ex-cop gets 18 years for stealing, reselling guns to Cape gangsters. News24.com 21 June 2016. http://www.news24.com/SouthAfrica/News/ex-cop-gets-18-years-for-stealing-reselling-guns-to-cape-gangsters-20160621 (accessed 8 February 2018). [ Links ]
15. Thamm M. When hell is not hot enough?: A top cop who supplied weapons to country's gangsters and right wingers. Daily Maverick 4 July 2016. http://www.dailymaverick.co.za/article/2016-07-04-when-hell-is-not-hot-enough-a-top-cop-who-s upplie d-weapons-to-countr ys-gangsters-and-right-winger s/#. V3pai2Zqb9I (accessed 8 February 2018). [ Links ]
16. De Clercq M. SAPS vindictively hounding Jaco Bothma - PSA. politicsweb. 9 September 2011. http://www.politicsweb.co.za/party/saps-vindictively-hounding-jaco-bothma--psa (accessed 13 February 2018). [ Links ]
17. South African Police Service. Crime report 2010/2011: SAPS Together Squeezing Crime to Zero: SAPS Members, My Family - Together Pushing Back the Frontiers of Evil. Pretoria: SAPS, 2011. [ Links ]
18. South African Police Service. Annual Report 2011/2012. Pretoria: SAPS, 2012. [ Links ]
19. Alpers P, Rossetti A, Wilson M. Guns in South Africa: Number of Registered Firearms. Sydney School of Public Health, University of Sydney. GunPolicy.org. 12 January 2017. http://www.gunpolicy.org/firearms/compareyears/166/number_of_registered_firearms (accessed 18 January 2017). [ Links ]

