


Services on Demand
Article
 English (pdf)
 Article in xml format
 Article references
Indicators

Related links
-
 Cited by Google
 -
 Similars in Google
Share

 Permalink
SAMJ: South African Medical Journal
On-line version ISSN 2078-5135
Print version ISSN 0256-9574
SAMJ, S. Afr. med. j. vol.108 n.3 Pretoria Mar. 2018
http://dx.doi.org/10.7196/samj.2018.v108i3.12588
RESEARCH
A needs-based approach to equitable allocation of district primary healthcare expenditure in North West Province, South Africa
Y MaharajI; A RobinsonII; D McIntyreIII
IBSc, BSc Hons, MPH (Health Economics); Family Health International (FHI360), Pretoria, South Africa
IIMB ChB, DHSM, FCPHM; North West Provincial Department of Health, Mafikeng, South Africa
IIIBCom, MA, PhD; Health Economics Unit, School of Public Health and Medicine, Faculty of Health Sciences, University of Cape Town, South Africa
ABSTRACT
BACKGROUND. Inequity in resource allocation and expenditure exists in the South African (SA) health system at provincial and district level. Needs-based resource allocation has been utilised in developed and developing countries to promote equity.
OBJECTIVES. To assess current spending patterns on primary healthcare (PHC)-level care at district level, and ultimately to promote equity in district PHC spending using a needs-based resource allocation approach in North West Province, SA.
METHODS. Data on PHC expenditure in 2013/14 were derived from the Vulindlela system. Data on key indicators of need for health services in each district were collated from various sources published online. Alternative needs-based formulae were calculated, and sensitivity analyses were conducted to assess the impact of key assumptions.
RESULTS. The analysis produced four possible needs-based formulae. The districts of Bojanala and Dr Kenneth Kaunda in North West are relatively under-resourced, while Ngaka Moderi Molema and Dr Ruth Segomotsi Mompati are relatively over-resourced. The results suggest that, in moving towards each district's equity target, a relative redistribution of resources should be undertaken over several years, preferably in the context of an annual increase in the real overall provincial PHC health budget, to avoid any absolute budget cuts for relatively over-resourced districts.
CONCLUSIONS. Inequity in PHC expenditure exists between the districts of North West. A needs-based resource allocation approach can promote equity across districts. Any formula selected by the Department of Health will need to be refined over time as more up-to-date and accurate data become available. It is recommended that for the initial phase the formula be based on population size, which will need to be updated at regular intervals. The same would apply to other indicators of need selected for the formula. Important areas for refining the formula over time are: (i) estimating the differential cost of providing care in rural v. urban areas, as assumptions were used in this study; and (ii) identifying a more comprehensive burden of disease indicator for which data are available at district level in the province.
The North West Provincial Department of Health (NWPDoH) district executive managers voiced concerns regarding the inequitable health budget allocation to the four health districts in North West Province (NWP), South Africa (SA): Bojanala, Dr Kenneth Kaunda (KK), Ngaka Moderi Molema (NMM) and Dr Ruth Segomotsi Mompati (RSM). However, management did not have a valid means by which to address this inequity. A study was therefore undertaken to determine current spending on primary healthcare (PHC) and develop a practical needs-based approach to address inequity.
Current healthcare financial resource allocation in SA is largely based on historical budgeting, meaning that provincial and district health budgets are allocated based on past expenditure patterns, adjusted for inflation. This has preserved historical inequities in resource allocation throughout SA. A more evidence-based and equitable allocation of resources at the PHC level is important, as the greatest number of individuals access this level of care.
Historical inequities exist between provinces as well as between districts within each province. The focus of this study is the inequity that exists in PHC expenditure between the four districts of NWP.
The literature demonstrates that using a needs-based resource allocation approach can promote equity in resource distribution between geographical locations.[1,2] This approach was first utilised in the UK in the 1970s[3] and has since been used in many developed and developing countries.'[,4-6] While there has been some discussion on needs-based resource allocation in SA, this approach has not been formally adopted for the allocation of healthcare funds.
The methodology for developing a needs-based formula has been well established internationally, and entails using indicators of relative need for healthcare in each geographical location. In all cases, the key indicators are population size and demographic composition, given that young children, the elderly and women of childbearing age have a greater need for health services than older children and working-age adults. This is usually supplemented by a direct measure of the burden of ill health, such as standardised mortality rates or prevalence of a disease that is a major cause of ill health in that context, and/or an indirect measure related to socioeconomic status, given the strong relationship between low socioeconomic status and greater burden of illness. As the focus is on the allocation of public funds, in contexts where there is a large private sector, the population dependent on the public sector is often used. Finally, in countries with large rural populations, an indicator of rurality is also often used. These formulae produce what is known as a 'target equity allocation' for each area, such as a district, which is then used to guide the future budget allocations to each district. The ability of a district to utilise additional resources in an effective way, or its absorptive capacity, influences how quickly equity targets are reached.
Objectives
To assess the current distribution of spending on district PHC services and explore alternative needs-based resource allocation formulae and redistribution processes to promote equitable PHC service spending across districts in NWP.
Methods
This study entailed finding appropriate, reliable and accurate data sources for each indicator of need used in the construction of the formulae, as well as compiling financial data. There is no single dataset that contains all the variables required (e.g. population size, as well as disease prevalence), so a range of datasets had to be drawn on. In general, data sources that are viewed as accurate and are already used by the NWPDoH and other structures in the NWP government were used. The most up-to-date data available at the time of the study were used.
Data collection and sources of data Financial data
Financial data were downloaded directly from the provincial financial management information system, Vulindlela. Data on actual district PHC expenditure for 2013/14 were extracted.
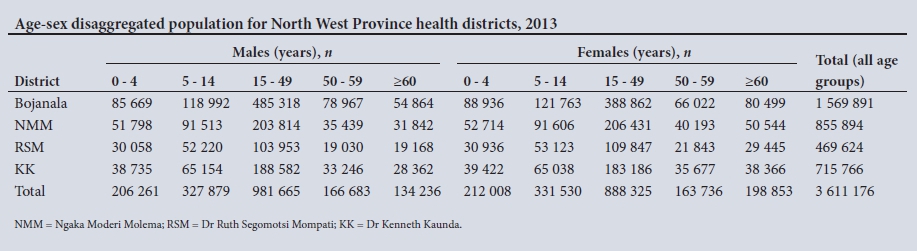
Population and demographic composition data
District-level population data for 2013, disaggregated into age-sex groupings, were derived from the 'Population by gender, age, and race' content table of the IHS Global Insight Regional Explorer database.[7]This is the dataset used by NWP for various planning activities.
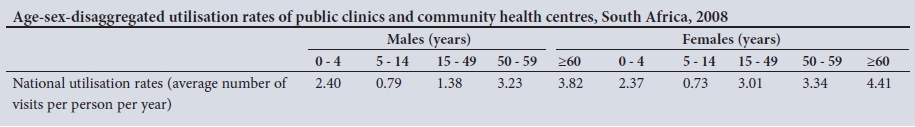
Utilisation data
National utilisation rates of PHC services at clinics and community healthcare centres for each age and sex group were drawn from the South African Consortium for Benefit Incidence Analysis (SACBIA) survey that was undertaken in 2008.[8] This is the only survey in SA that allows utilisation rates to be calculated. Although data from 2008 could be regarded as outdated, we used them to calculate the difference in utilisation across different age-sex groups; this differential is generally relatively stable over time. The key age-sex groups that have a relatively greater need for healthcare, and therefore have higher utilisation rates, are the elderly (>60 years of age), infants aged <5 years, and females of childbearing age (15 - 49 years).
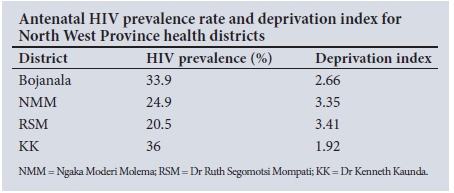
Morbidity data
Given that HIV accounts for a considerable portion of ill-health in SA, the morbidity indicator used in this study was the district antenatal HIV prevalence rate, drawn from the 2011 National Antenatal Sentinel HIV and Syphilis Prevalence Survey in South Africa,[9] which provided the latest figures available at the time of the study.
Deprivation indices
Deprivation indices, as a measure of socioeconomic status, were drawn from the 2007/2008 Health Systems Trust District Health Barometer.[10] These figures were available at district level and were the latest figures available in SA at the time of the study.
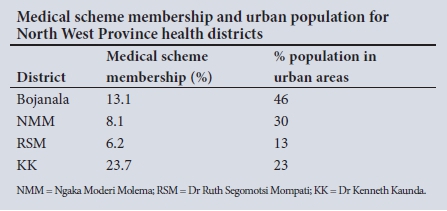
Medical scheme coverage and distribution of population between urban and rural areas
Estimated district private medical scheme coverage was obtained from the 2011/2012 District Health Barometer,[11] and the percentage of the district population living in urban areas was taken from the NWP Development Plan.[12]
Methodology for calculating alternative needs-based formulae
The methodology for calculating needs-based formulae involves weighting population data for different indicators of need.[13] The population was first weighted to account for its demographic composition by multiplying each district's population in each age-sex group by the normalised national PHC service utilisation rate for that group. National age-sex utilisation rates were used, as the intention was to estimate need for healthcare resulting from differences in demographic composition across districts, rather than actual service utilisation, which is influenced by the current supply of and access to health facilities. The utilisation-weighted population was then further weighted for additional indicators of need, namely differences in burden of disease and socioeconomic status across districts. Each district's equity target was calculated as the percentage share of each district's weighted population of the total. Four separate formulae were calculated to explore how equity targets change with the addition of each indicator of need. The most important indicator of need for health services is the size of the population in each district. For this reason, other indicators are usually given a relatively low weighting. In this study, a 20% weighting was used and the effect of using different weightings for indicators of need was also explored.
A sensitivity analysis was then performed to take account of two additional factors, namely the estimated district population covered by private medical schemes and the estimated cost of providing care in rural v. urban areas. Providing care in rural areas is more expensive, for example owing to more sparse population densities, the costs of transporting medical supplies to remote areas, and rural allowances for healthcare workers. Using the estimated private medical scheme coverage figures, the uninsured population size for each district was calculated. The district population covered by private schemes was calculated by multiplying the population size by the percentage of each district's population covered by medical schemes. In this calculation, it was assumed that 80% of medical scheme members reside in urban areas and 20% of medical scheme members reside in rural areas. An assumption had to be made, as data were not available separately on medical scheme members in rural and urban areas. As the majority of medical scheme members, and sometimes some of their dependents, are employed in the formal sector, the vast majority of scheme members tend to be in urban areas. The rural and urban uninsured populations were used in the calculations regarding cost of care in rural areas. No accurate data were available on the cost of providing care in rural v. urban areas. Crude assumptions of 50% and 100% higher cost of service provision in rural than urban areas were therefore made.
The raw data and further details on calculation methods are provided in Appendix 1. Microsoft Excel 2010 (Microsoft, USA) was used to analyse and create the needs-based formulae and graphs.
Results and discussion
Needs-based formulae
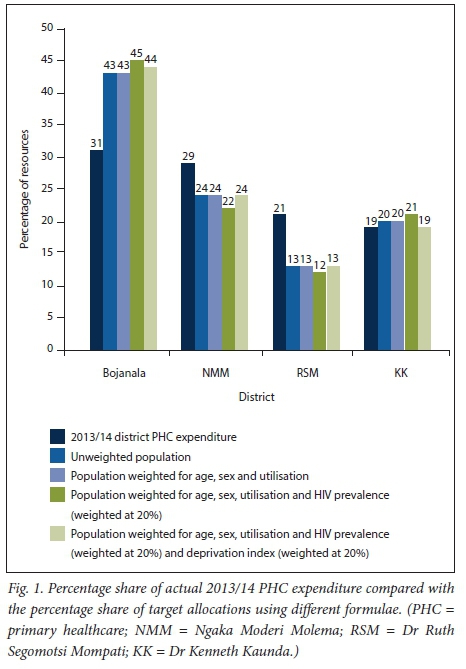
Fig. 1 compares each district's percentage share of actual 2013/14 PHC expenditure with their equity target allocations using different needs-based formulae. Formula 1 uses population size of districts as the only indicator of need. The 2013 data show that Bojanala has the largest population (43% of NWP's population) and RSM the smallest (13%). Formula 2 utilises population size and the age-sex composition of each district's population, weighting for national utilisation rates. Formula 3 uses the same indicators but adds HIV prevalence to the formula (with a weighting of 20%). Formula 4 uses the same indicators and adds a deprivation index (weighted at 20%) as an indicator of socioeconomic status. Regardless of the formula or indicator choice, the trend in the percentage share of target allocations from highest to lowest was as follows: Bojanala, NMM, KK and RSM. Formula 4 was used for the purpose of analysis in this article, as it incorporates all the key indicators of need used in most other countries.
Sensitivity analysis of the effects of increasing the weightings of indicators
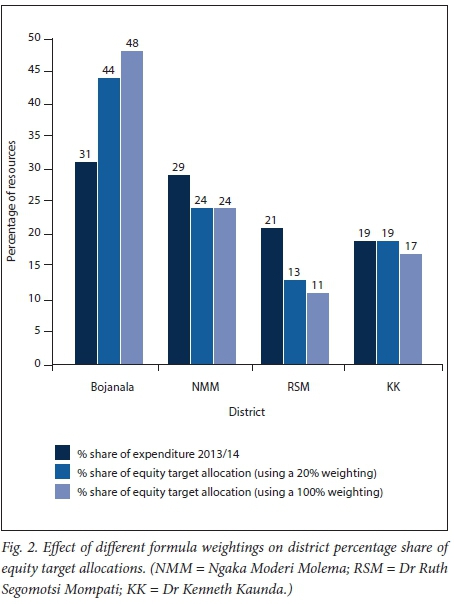
Fig. 2 shows the impact of using a 20% weighting for HIV and deprivation index relative to a 100% weighting. In the case of the 100% weighting, Bojanala's percentage share would increase by 4%. NMM would remain constant and RSM and KK's percentage shares would each decrease by 2%. It is important to note that 1% of the district PHC resources amounts to nearly ZAR24 million (1 USD = ZAR12.03 in April 2015).
Issues relating to moving towards equity target allocations
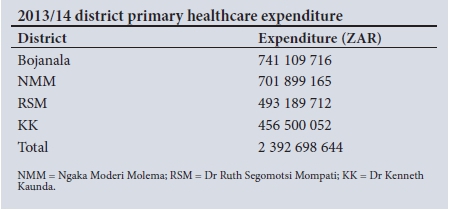
The development of needs-based formulae and equity target allocations for each district was the first part of the process. The second and equally important part relates to the pace of change, as the time period for moving to the equity targets will impact on the annual changes in budget allocations. One scenario would be where there is no real increase in the total PHC budget (i.e. the real budget would stay constant at ZAR2 392 698 644, with only an inflation adjustment). This would mean that relatively over-resourced districts would experience real budget cuts to increase budgets for relatively under-resourced districts, which could jeopardise existing services. Importantly, if PHC services overall are not adequately funded, these districts are not over-resourced in absolute terms, resulting in a case of 'robbing Peter to pay Paul'. This option is therefore unlikely to be acceptable to stakeholders or practically feasible.
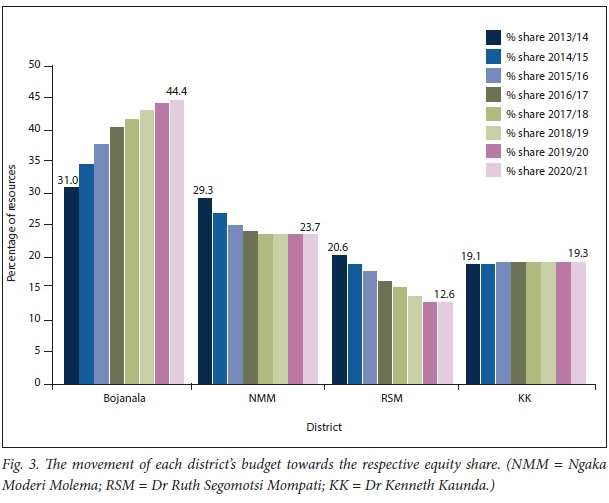
International experience has demonstrated that it is far more feasible to achieve a relative reallocation of resources in the context of a real average annual increase in the overall budget, in this case the total district PHC budget. There was an average real annual increase of 8% in the total PHC budget in NWP from 2010/2011 to 2013/2014. If it is assumed that the real budget for PHC services continues to increase by 8% each year, then the budget of relatively over-resourced districts (NMM and RSM) can be kept constant in real terms, meaning that these districts receive the same amount as the previous year but adjusted for inflation, until they reach their respective equity target allocations. The budgets of relatively under-resourced districts (Bojanala and KK) would increase in real terms yearly, using funds made available by the 8% real increase in the budget. Fig. 3 depicts the movement of each district's budget from the current share towards the equity target percentage share if it is phased in over a 7-year period.
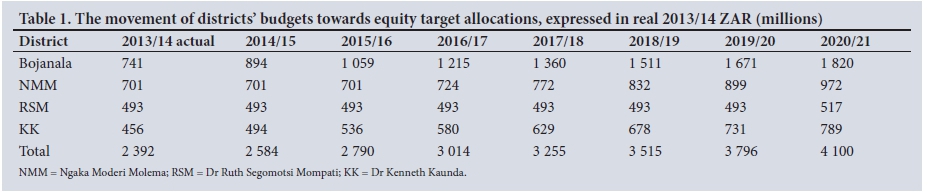
Table 1 shows the ZAR value that corresponds to each of the bars in Fig. 3. The row labelled 'Total' shows the 8% real increase in the overall budget for district PHC services.
Bojanala would need the greatest increase, as it is furthest away from its equity target allocation, while KK is already close to its equity target percentage share. Allocating resources in this manner using a PHC budget that is increasing in real terms is easier and more ethical than cutting any of the districts' budgets, as budgets from relatively over-resourced districts are not cut in real terms to fund under-resourced districts. This approach is therefore recommended and has a greater likelihood of being accepted by stakeholders.
Fig. 3 and Table 1 are an illustration of how equity resource allocation targets could be phased in. There are various factors that could affect the pace of progress to equity targets. For example, within the current constrained macroeconomic and budgetary context, an annual real increase of 8% in the district PHC budget may not be sustainable. A lower real growth rate may mean that equity targets may need to be phased in over a longer period than the 7 years illustrated above. Another important factor is the ability of Bojanala to absorb additional funds. This district would face large annual budget increases, and its ability to translate financial resources into additional services, e.g. building additional facilities and employing more staff, may be constrained in the short term.
Sensitivity analysis
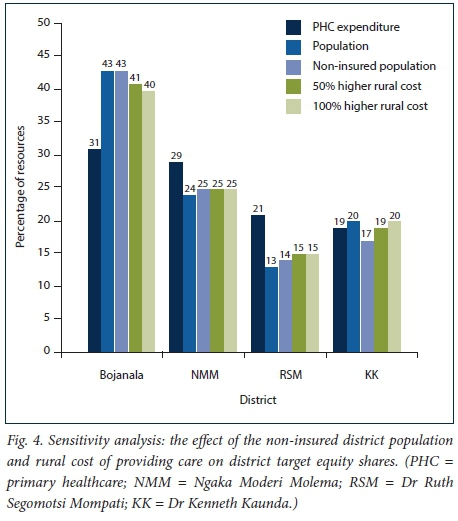
The main reason for conducting the sensitivity analysis was to see the effect additional factors viewed as important by health managers in NWP would have on the equity targets of each district. These factors were to focus on the estimated district population not covered by private medical schemes rather than the total population and to account for the differential cost of providing care in rural v. urban areas.
Fig. 4 shows the outcome of the sensitivity analysis calculations. The percentage shares were calculated using 2013/14 actual PHC expenditure, population size, the size of the uninsured population, and the different rural cost assumptions. It can be seen that the trend remains consistent with the other formulae, meaning that Bojanala is furthest away from its equity share and KK is almost where it should be; both these districts remain as relatively under-resourced. NMM and RSM remain as relatively over-resourced districts. What is striking is that when the above factors are taken into account, the percentage shares do not shift by a large amount.
Study limitations
Some of the datasets drawn on are several years old. However, they were the most recent data available at the time of the study. The assumption that the difference in utilisation rates across age-sex groups is unlikely to have changed since 2008 may not hold, given the roll-out of antiretroviral treatment, which largely affects working-age adults. However, the 2008 SACBIA study is
literally the only survey that allows for the accurate calculation of utilisation rates; while some other surveys collect information on health service utilisation, they do not collect data on all services used within a specific recall period.
It is advisable not to focus on a single disease as an indicator of the relative need for health services in different geographical areas. While a particular district may have a greater burden of ill health due to one disease (e.g. HIV) than other districts, it may have a lower burden of ill health than other districts in relation to other diseases (e.g. diabetes or hypertension). For this reason, it is preferable to use an indicator of overall burden of ill health, such as all-cause mortality rates. However, it is difficult to obtain accurate mortality data at district level at present. The study was also not able to include accurate indicators relating to the cost of providing care in different geographical locations.
As more reliable and accurate data sets become available, these can be included in the selected formula to assess the possible effects of different indicator choices and weightings. Needs-based formulae are not sufficient by themselves to achieve equity; the allocation of financial resources in line with equity targets must be supported by careful planning to absorb these resources effectively, e.g. through increased staffing.
Conclusions
This study shows that in the NWPDoH, inequity in the allocation of PHC resources does exist between districts and that using a needs-based approach to resource allocation can promote equity. Although the study focused on NWP, other provinces face similar inequalities in the distribution of resources between districts; this study therefore has broader relevance.
Unsurprisingly, accurate, relevant and up-to-date data were not readily available for this study, so a number of assumptions were introduced, including the use of a single HIV indicator as a proxy for burden of disease, cost assumptions for providing healthcare to rural areas, and weightings for the effects of various demographic and deprivation indices.
Despite these assumptions, including those in the sensitivity analyses, the trends for resource allocation remained when different indicators were added to the analysis. Bojanala and KK are relatively under-resourced, while RSM and NMM are relatively over-resourced. Bojanala is furthest away from its equity target and KK is relatively close to its equity target. Hence the direction in which resource allocation should take place is clear and defined. It is recommended that efforts be made to maintain the average annual real increase in the total PHC budget, as reallocation of resources in this context does not call for absolute cuts in any district budgets. This is particularly important given that PHC services may be relatively under-funded overall.
This study was an input into deliberations by the NWPDoH around needs-based resource allocation. Any formula selected by the department will need to be refined over time as more up-to-date and accurate data become available. For example, if the formula is initially based purely on population size, the population data will need to be updated each year as population size may be increasing at different rates in each district. The same would apply to other indicators of need selected for the formula. Two priority areas for refining the formula over time include: (i) estimating the differential cost of providing care in rural v. urban areas, as assumptions were used in this study; and (ii) identifying a more comprehensive burden of disease indicator for which data are available at district level in the province.
In terms of implementing a relative reallocation of resources between districts, district managers will need support from provincial managers to utilise increasing resources in an effective manner in the case of relatively under-resourced districts, and to cope with a decrease or lack of real increase in budgets in the case of relatively over-resourced districts. The absorptive capacity of districts should be monitored to inform decisions on the pace of change.
Acknowledgements. This work is based on research supported by the South African Research Chairs Initiative of the Department of Science and Technology and the National Research Foundation of SA. Any opinion, finding and conclusion or recommendation expressed in this article is that of the authors, and the NRF does not accept any liability in this regard.
Author contributions. YM, AR and DM were all involved in the conceptualisation of the research. YM undertook the data collection with support from AR, and YM undertook the data analysis under the guidance of DM. YM prepared the first draft of the article, and AR and DM contributed to its revision and finalisation. All the authors reviewed and approved the final article.
Funding. This work was funded by the South African Research Chairs Initiative of the Department of Science and Technology and the NRF.
Conflicts of interest. None.
References
1. Green A, Ali B, Naeem A, Ross D. Resource allocation and budgetary mechanisms for decentralized health systems: Experiences from Balochistan, Pakistan. Bull World Health Organ 2000;78(8):1024-1035. http://www.who.int/bulletin/archives/78(8)1024.pdf (accessed 14 April 2015). [ Links ]
2. Smith P. Resource allocation and purchasing in the health sector: The English experience. Bull World Health Organ 2008;86(11):884-888. https://doi.org/10.2471/BLT.07.049528 [ Links ]
3. Knox EG. Principles of allocation of health care resources. J Epidemiol Community Health 1978;32(1):3-9. https://www.ncbi.nlm.nih.gov/pmc/articles/PMC1087302/ (accessed 21 June 2015). [ Links ]
4. Birch S, Chambers S. To each according to need: A community-based approach to allocating health care resources. Can Med Assoc J 1993;149(5):607-612. https://www.researchgate.net/pubfication/14834122_To_each_according_to _need_A_community-based_approach_to_allocating_health_care_resources (accessed 10 June 2015). [ Links ]
5. Birch S, Eyles J, Newbold KB. Proxies for healthcare need among populations: Validation of alternatives - a study in Quebec. J Epidemiol Community Health 1996;50(5):564-569. https://www.ncbi.nlm.nih.gov/pmc/articles/PMC1060351/ (accessed 8 June 2015). [ Links ]
6. Manthalu G, Nkhoma D, Kuyeli S. Simple versus composite indicators of socioeconomic status in resource allocation formulas: The case of the district resource allocation formula in Malawi. BMC Health Serv Res 2010;10(6):1-8. https://doi.org/10.1186/1472-6963-10-6 [ Links ]
7. IHS Global Insight Incorporated. IHS Global Insight Regional Explorer Database Demographic: Population by Gender and Age and Race. Centurion: IHS Global Insight South Africa, 2015. [ Links ]
8. McIntyre D. SHIELD Work Package 5 Report: Modelling the Estimated Resource Requirements of Alternative Health Care Financing Reforms in South Africa. Cape Town: Health Economics Unit, University of Cape Town, 2010:1-44. https://www.health-e.org.za/wp-content/uploads/2013/05/eae9d7ccd7744ff54729bebdfb3f1cee.pdf (accessed 11 July 2015). [ Links ]
9. National Department of Health. The 2011 National Antenatal Sentinel HIV and Syphilis Prevalence Survey in South Africa. Pretoria: NDoH, 2011:1-66. [ Links ]
10. Day C, Barron P, Monticelli F, Sello E. District Health Barometer Year 2007/08. Durban: Health Systems Trust, 2009:1-125. http://www.hst.org.za/publications/District%20Health%20Barometers/DHB0708.pdf (accessed 4 December 2013). [ Links ]
11. Massyn N, Candy D, Barron P, Haynes R, English R, Padarath A. District Health Barometer 2011/12. Durban: Health Systems Trust, 2012:1-454. http://www.hst.org.za/publications/District%20Health%20Barometers/District+He alth+Barometer+2011-13.pdf (accessed 2 December 2013). [ Links ]
12. North West Planning Commission. Provincial Development Plan. Mmabatho: North West Planning Commission, 2013:1-358. http://premier.nwpg.gov.za/sites/default/files/vacancies/North%20West%20Provincial %20Development%20Plan.pdf (accessed 6 September 2015). [ Links ]
13. McIntyre D, Anselmi L. Guidance on Using Needs Based Formulae and Gap Analysis in the Equitable Allocation of Health Care Resources in East and Southern Africa. EQUINET Discussion Paper 93. Harare: Regional Network for Equity in Health in Southern Africa Equinet, 2012:1-21. http://www.equinetafrica.org/sites/default/files/uploads/documents/Diss93_ RAguidance_Sep2012.pdf (accessed 9 December 2013). [ Links ]
 Correspondence:
YMaharaj
yasteel.maharaj@gmail.com
Accepted 7 September 2017
Appendix 1. Data and further methodological details
Calculation methods
Formula 1: Unweighted population
Percentage share of total North West population in each health district
Formula 2: Population weighted for utilisation by different age-sex groups/demographic composition
• Normalise national utilisation rates
• Multiply age-sex population in each district by normalised utilisation rate for that age-sex group
• Sum weighted population across age-sex groups in each district
• Calculate percentage share of total demographic composition-weighted North West population in each health district
Formula 3: Population weighted for demographic composition and weighted for HIV prevalence
• Normalise HIV prevalence rates
• Multiply population in each district weighted for demographic composition by normalised HIV prevalence (x 20% weighting)
• Calculate percentage share of total demographic composition- and HIV prevalence-weighted North West population in each health district
Formula 4: Population weighted for demographic composition, for HIV prevalence and for deprivation index
• Normalise deprivation index
• Multiply population in each district weighted for demographic composition and HIV prevalence by normalised deprivation index (x 20% weighting)
• Calculate percentage share of total demographic composition-, HIV prevalence- and deprivation index-weighted North West population in each health district
Sensitivity analysis for medical scheme membership
• Calculate uninsured population = population in each district x (1 - scheme membership rate)
• Calculate each district's percentage share of total uninsured population in North West province
Sensitivity analysis for medical scheme membership and differential cost of providing services to rural and urban population
• Estimate uninsured population in urban and rural areas: Rural population in district - estimated insured population in rural areas of district (i.e. medical scheme members in district x 20% for insured population in rural areas); similarly for urban population, but assumed to be 80% of medical scheme members in district
• Rural uninsured population x 1.5 + urban population (for 50% higher cost of service provision in rural areas); rural uninsured population x 2 + urban population (for 100% higher cost of service provision in rural areas)
• Calculate percentage share of total uninsured population weighted for rural/urban differential cost in North West province for each district

