


Serviços Personalizados
Artigo
 Inglês (pdf)
 Artigo em XML
 Referências do artigo
Indicadores

Links relacionados
-
 Citado por Google
 -
 Similares em Google
Compartilhar

 Permalink
SAMJ: South African Medical Journal
versão On-line ISSN 2078-5135
versão impressa ISSN 0256-9574
SAMJ, S. Afr. med. j. vol.108 no.2 Pretoria Fev. 2018
http://dx.doi.org/10.7196/samj.2018.v108i2.12766
RESEARCH
Physical activity levels in urban-based South African learners: A cross-sectional study of 7 348 participants
A van BiljonI; A J McKuneII, III; K D DuBoseIV, V; U KolanisiVI; S J SempleIII
IMSc (Kinderkinetics); Department of Human Movement Science, Faculty of Science and Agriculture, University of Zululand, KwaDlangezwa, South Africa
IIPhD (Sport and Exercise Science); Discipline of Biokinetics, Exercise and Leisure Sciences, School of Health Sciences, University of KwaZulu-Natal, South Africa
IIIPhD (Sport and Exercise Science); Discipline of Sport and Exercise Science, Research Institute for Sport and Exercise, Faculty of Health, University of Canberra, Australia
IVPhD (Exercise Physiology);Department of Kinesiology, East Carolina University, Greenville, NC, USA
VPhD (Exercise Physiology); East Carolina Diabetes and Obesity Institute, East Carolina University, Greenville, NC, USA
VIPhD (Consumer Science); Department of Consumer Science, Faculty of Science and Agriculture, University of Zululand, KwaDlangezwa, South Africa
ABSTRACT
BACKGROUND: Establishing profiles of physical activity (PA) is critical in tackling the chronic diseases associated with lack of PA and avoiding healthcare costs.
OBJECTIVE: To investigate PA levels in urban-based South African (SA) primary school learners.
METHODS: The Physical Activity Questionnaire for Older Children was completed by 7 348 learners (3 867 males and 3 481 females) aged 8 -14 years, of whom 49% were white, 39% black and 12% from other ethnic groups. Differences in PA levels by ethnic origin and province were determined using an analysis of covariance after adjusting for gender (p<0.05). Bonferroni corrections controlled for multiple comparisons. A fitted regression model examined age-related differences in PA adjusting for province.
RESULTS: Of SA learners aged 8 - 14 years, 57% (n=4 224) engaged in moderate levels of PA. Thirty-one percent (n=2 247) did not meet internationally recommended amounts of moderate to vigorous physical activity. Overall, males reported higher PA levels than females (p<0.0001). PA levels declined with age from 11 to 14 years by 14% and 20% in males and females, respectively. Black learners had higher PA levels than white learners (p=0.0039). There were also significant differences in PA levels between the provinces (p<0.0001).
CONCLUSION: This study provides evidence of differences in PA levels between gender, age and ethnic groups, and between provinces. A targeted approach to increase PA in high-risk populations in SA is warranted. Increased PA will help reduce the risk of chronic diseases and will contribute to the health of SA's population and the growth of the country's economy.
Physical activity (PA) practices among South African (SA) school learners are reported to be insufficient to promote health and prevent chronic diseases.[1] SA's 2014 Report Card on Physical Activity for Children and Youth[1] indicates that <50% of learners (6 - 18 years) meet the recommended amount of 60 minutes of moderate to vigorous PA (MVPA) a day.[1] Low PA levels are partly responsible for the obesity epidemic that threatens the wellness of the SA population and the country's economy. Research indicates that 31.9% of SA learners aged 6 - 13 years are overweight and 8.1% are obese.[2] A more recent study classified 15 - 25% of 9 - 10-year-old SA learners as overweight or obese.[3]
Major healthcare challenges are deemed to arise from populations that are physically inactive, and it is reported that physical inactivity is the fourth leading risk factor contributing to global mortality.[4] Physical inactivity may be responsible for 22% of ischaemic heart disease, 14% of type 2 diabetes mellitus, 16% of colon cancer, 11% of ischaemic stroke and 10% of breast cancer.[5] In addition, several studies have shown a positive association between physical inactivity and healthcare costs.[6-7]
Objective
Establishing profiles of PA is critical for intervention research that will aid in tackling the chronic diseases associated with physical inactivity and avoiding healthcare costs. This study examined the prevalence of PA in SA learners, detailing differences between gender, ethnicity, age and region. Updating PA profiles of SA learners may provide awareness around and contribute towards achieving the health-related Sustainable Development Goals for 2030.[8]
Methods
Participants
Seven thousand, three hundred and forty-eight SA learners (3 867 males and 3 481 females) aged 8 - 14 years completed the Physical Activity Questionnaire for Older Children (PAQ-C) between August and November 2012. The mean age was 11.14 years (standard deviation (SD) 1.46). School principals in seven provinces (Gauteng, North West, KwaZulu-Natal, Northern Cape, Western Cape, Eastern Cape, Mpumulanga) provided written or verbal consent prior to participation. Learners were categorised by ethnic group as white (Caucasian descent, n=3 634), black (African descent, n=2 857) or other (coloured or Indian descent, n=857). The learners were mainly white (49%) and black (39%) and from North-West (29%) and Gauteng (27%) provinces. For the purpose of the study, we defined 'urban area' as a locality characterised by a range of public and private service providers with a population of >15 000 inhabitants.[9,10] The University of Zululand's research ethics committee provided ethical clearance for the study (ref. no. 171110-030).
The questionnaire
A modified version of the self-administered PAQ-C was used.[11] The questionnaire measures general PA levels in children aged 8 -14 years during a typical week in a school year. The survey includes nine questions based on a broad spectrum of different activities taking place during physical education, first and second breaks, days and evenings and over the weekend. These questions were scored on a 5-point Likert rating scale assessing frequency and intensity of activities. A final mean score categorised learners as having low, moderate or high PA levels. Low levels of PA were 1.00 - 2.33, moderate levels 2.34 - 3.66 and high levels 3.67 - 5.00.'[11]
Demographic details including ethnicity and geographical location were added to the original questionnaire (gender and age were existing parameters on the questionnaire). The questionnaire was piloted using Survey Monkey on a convenient sample prior to the main data collection; this sample did not form part of the final analysis. The primary purpose of the pilot testing was to ensure clarity of the terminology used and the applicability and availability of the listed sport activities. Modifications to question 1 were performed after the pilot study; for example, cross-country skiing, ice hockey and badminton were removed and replaced with cricket, athletics and rugby to suit the local context. The secondary aim of the pilot study was to test the feasibility of an online response option, although all participating schools preferred hard copies of the questionnaire.
The PAQ-C has demonstrated internal consistency among ethnic groups'[12] and acceptable test-retest reliability for males (r=0.75) and for females (r=0.82).'[12] Convergent and construct validity of the PAQ-C has been established, with moderate associations found between the activity rating scale (r=0.57) and the 7-day PA recall interview (r=0.46).[14]
Design and sampling
This cross-sectional, descriptive survey study examined PA levels across gender and ethnic groups, provinces and age groups. A two-stage cluster sampling design allowed selection of learners by province and age groups. Contact details for schools were obtained from the online directory of SA schools.'[15] Schools in all nine provinces were randomly selected from a published list of schools. Introductory and instructional letters, principal consent forms and questionnaires were emailed to the interested schools.
Data collection
Of the nine provinces that were contacted, seven agreed to participate in the study. Participating schools from these provinces were requested to indicate an estimated number of eligible learners (8 - 14 years) enrolled in their school. The required number of questionnaires were delivered by courier and administered in class during school hours. The front page of the questionnaire contained short bullet-point instructions on how to complete the questions, and informed learners that there were no wrong answers. Questionnaires were collated according to province and not by individual schools. Seven thousand, four hundred and eighty-five questionnaires were returned, of which 137 had incomplete responses or missing values; these were excluded from the study. The final sample comprised 7 348 learners.
Data analysis
Means, SDs, frequencies and 95% confidence intervals (CIs) were calculated for the final sample by ethnic group, gender, age and province. An independent t-test compared PA between the genders (p<0.05). Differences in PA levels by ethnic group and province were determined via analysis of covariance after adjusting for gender (p<0.05). Bonferroni corrections (p<0.05/3=0.0167; p<0.05/7=0.00714, respectively) were used for post hoc analysis when necessary. Finally, a fitted regression model estimated differences across PA levels by age, adjusting for province. The regression analysis was adjusted for province because PA levels and age were statistically different between provinces. All data analyses were performed using SAS version 9.3 (SAS Institute, USA).
Results
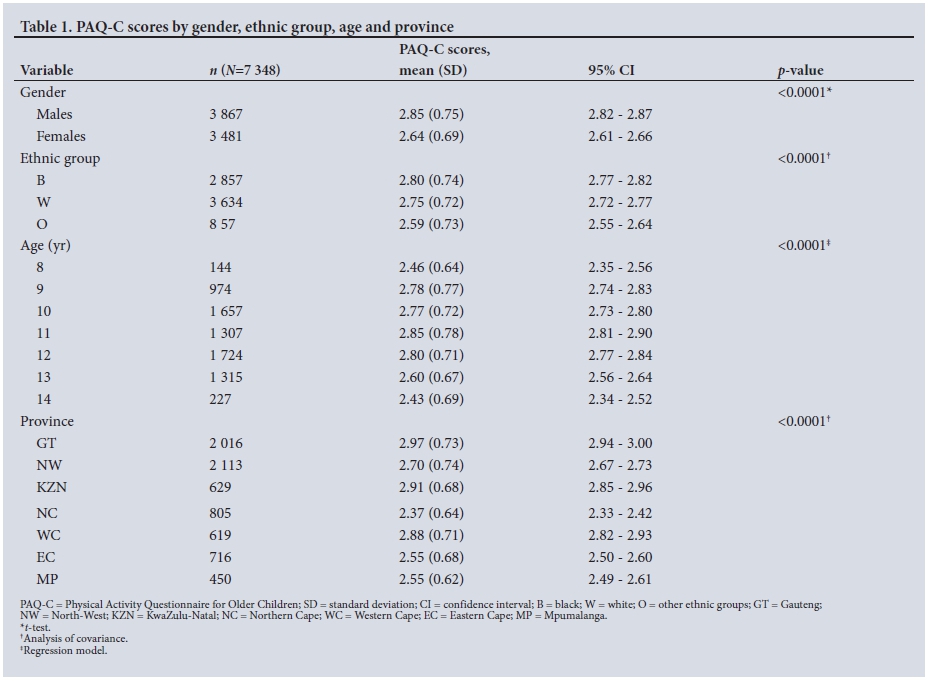
PAQ-C scores for older children are presented in Table 1.
The mean PAQ-C score of the total sample was 2.75 (SD 0.73). Males were significantly more active, recording a mean score of 2.85 (95% CI 2.82 - 2.87) compared with 2.64 (95% CI 2.61 - 2.66) for females (p<0.0001). All ethnic comparisons were statistically significantly different (p<0.0001). Bonferroni corrections (p<0.05/3=0.0167) demonstrated higher PA levels in black learners compared with both white (p=0.0039) and other ethnic group (p<0.0001) learners. The latter group was less active than their white counterparts (p<0.0001).
Among the seven provinces studied, Gauteng learners recorded a mean PAQ-C score of 2.97 (95% CI 2.94 - 3.00) and had significantly higher levels of PA compared with North West (p<0.0001), the Northern Cape (p<0.0001), Mpumalanga (p<0.0001), the Western Cape (p<0.0014) and the Eastern Cape (p<0.0001). KwaZulu-Natal had slightly lower PA levels compared with Gauteng (2.91 v. 2.97), although no significant differences were reported (p=0.0235) with deflated alpha values (p<0.05/7=0.00714). Northern Cape respondents had significantly lower levels of PA than all the other provinces (Gauteng p<0.0001, North-West p<0.0001, Western Cape p<0.0001, Mpumalanga p<0.0001, KwaZulu-Natal p<0.0001 and Eastern Cape p=0.0005). KwaZulu-Natal had the second highest PAQ-C score of 2.91 (SD 0.68), but was not statistically different from the Western Cape with a score of 2.88 (SD 0.71) (p=0.44).
Gender characteristics are described in Table 2. Of the 7 348 learners, 53% were male and 47% female. Males (n=3 867) were mostly white (50%) and black (39%), with a mean age of 11.14 (SD 0.75) years, and the majority resided in North West (28%) and Gauteng (25%). Females (n=3 481) had a mean age of 11.13 (SD 0.69) years and consisted of 39% black and 49% white respondents, with 30% residing in Gauteng and 30% in North West. Eleven-year-old males (2.98; 95% CI 2.93 - 3.04) and 14-year-old males (2.59; 95% CI 2.48 - 2.71) were 13% and 17% more active than females of the same age. Fourteen-year-old females (2.18; 95% CI 2.05 - 2.31) and 8-year-old males (2.53; 95% CI 2.39 - 2.67) were recorded as being the least active, while 11-year-old males (2.98; 95% CI 2.93 - 3.04) and 9-year-old females (2.74; 95% CI 2.68 - 2.81) were the most active.
Province and gender interactions were significant (p=0.0002), with a trend of males being more active than their female counterparts across all provinces (Fig. 1). Gauteng males (3.11 (SD 0.71)) and females (2.83 (SD 0.72)) were 23% and 22% more active than Northern Cape males (2.46 (SD 0.66)) and females (2.28 (SD 0.61)).
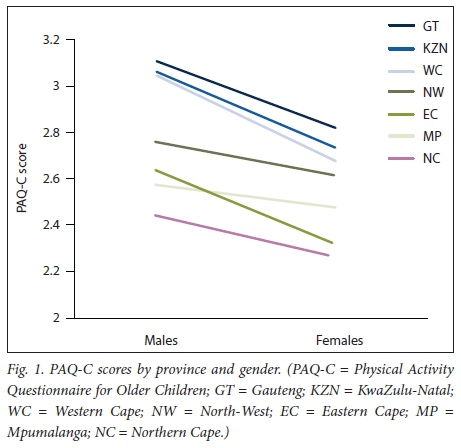
The Western Cape demonstrated the largest gender difference, with PA levels of 3.05 (SD 0.75) for males and 2.69 (SD 0.61) for females in that province.
Discussion
The main findings of the study indicate significant differences in PA levels according to gender, ethnic origin, age group and province. Males had higher PA levels than females (p<0.0001), black and white learners were significantly more active than other ethnic groups (p<0.0001), younger learners tended to be more active than older learners (p<0.0001), and Gauteng had higher PA levels compared with other provinces (p<0.0001), although these were not significantly different to KwaZulu-Natal (p=0.0235).
PA levels in the present study are in line with previous paediatric studies.[16,17] Social and cultural explanations for these PA level findings have been put forward. For example, compared with males, participation by females in vigorous activities is often not encouraged or praised by society, and some cultures consider participation in sport more important than others do.[18] A recent cross-sectional study (N=78) revealed that rural SA males aged 9 - 11 and 12 - 14 years recorded significantly more steps (27.7% and 27.5% more, respectively) than females of the same age.[16] A larger urban-based study (N=767) found that SA males aged 5 - 18 years accumulated more MVPA per week than their female counterparts.[17] The results of the current study support and confirm gender differences in PA levels among SA learners.
The trend of PA levels declining with age has been ascribed to biological maturation in terms of the onset and rate of puberty.[19,20] Specifically, research has demonstrated a decline in PA levels with age, particularly in adolescent females.[21,22] The current study shows that PA levels declined at an earlier age in females compared with males (10 years v. 13 years). Belcher et al.[19] found that 6 - 11-year-old learners in the USA spent significantly more time in MVPA than older learners aged 12 - 15 years (88 v. 33 minutes per day). Similarly, an Australian study of 6 024 learners aged 10 - 18 years reported that older learners were less active than younger learners and that sedentary time peaked at age 14 - 15 years.[23] Likewise, in the south of India, PA decreased significantly over 1 year among learners aged 8 - 15 years.[24]
The results of the present study demonstrate that Gauteng learners had higher PA levels than learners in the other provinces. Furthermore, PA levels were lower in North West (2.70; 95% CI 2.67 -2.73) than in Western Cape (2.88; 95% CI 2.82 - 2.93) and KwaZulu-Natal (2.91; 95% CI 2.85 - 2.96). This is in line with previous findings on PA levels in Gauteng[17] showing that 78% of learners met the recommended guidelines, compared with findings from North West,[25] where only 36% of learners did the recommended amount of MVPA. However, data on geographical regions in SA and their influence on PA levels are limited.
European studies have shown discrepancies in PA levels among children living in different countries, although the PA associations tended to focus more on socioeconomic status and gender rather than geographical area.[26,27] PA levels were estimated in 7 684 European children aged 2 - 11 years from eight countries (Sweden, Germany, Hungary, Italy, Cyprus, Spain, Belgium and Estonia).[27] Two percent of Cypriot females did the recommended amount of 60 minutes of MVPA, compared with 14.7% of Swedish females, while 9.5% of males in Italy and 34.1% of those in Belgium met the PA guidelines. Cultural differences and socioeconomic factors are often used to explain differences in PA prevalence between ethnic groups.[28] It is interesting to note that the provinces in the present study had very different ethnic proportions. Of black learners 41% were from Gauteng, the majority of white learners (49%) lived in North West, and a large proportion of learners from the other ethnic groups (29%) lived in the Northern Cape. Similarly, of learners in Gauteng 58% were black, of learners in North West 85% were white, and 30% of learners in the Northern Cape belonged to other ethnic groups. Corresponding with these results, both black learners and Gauteng had the highest levels of PA in this study, while 'other' ethnic groups and the Northern Cape had the lowest PA levels. These ethnic proportions are supported by the overall ethnic breakdown of the SA population (80.2% black, 8.4% white, and 11.3% other ethnic groups).[29] These ethnic proportions have important implications when making assumptions about PA levels in specific provinces. Perhaps the level of PA is more of a cultural determinant than a provincial/regional factor. In addition, provincial municipalities often reflect the values and attitudes of the culture in that province. For example, more opportunities for PA will exist in a province that values PA and is aware of its benefits. In 2011, for example, the City of Cape Town in the Western Cape launched the first outdoor gym in SA, providing free gym access to the community. The project took on a multidisciplinary approach, with city officials, healthcare stakeholders and the private sector aiming to reduce the high levels of inactivity in the province.[30] The City of Johannesburg Metropolitan Municipality followed this initiative a year later in Soweto, Gauteng.[31]
Many studies indicate that white children engage in more regular PA than children of other ethnic groups.[32,33] Ethnic differences in PA levels were reported in a study of 386 9-year-old SA learners.[34] White learners had greater metabolic equivalent PA scores of 21.70 (SD 2.90) hours per week than black learners (9.50 (SD 0.50) hours per week). In contrast to previous studies, post hoc analyses in the present study suggested that black learners (n=2 857) were 2% more active than white children (p=0.0039) and 7.8% more active than the 'other' ethnic groups (p<0.0001). White learners had significantly higher PA levels than the 'other' groups (p<0.0001). Similar results were found in a cross-sectional study (N=2 071) of 9 - 10-year-old learners in the UK.[35] Specifically, black learners in that study spent time engaging in vigorous PA (>4 000 activity counts per minute) and had 6% more daily activity counts compared with their white counterparts. However, in the same study, a different pattern emerged relating to daily step counts, with white learners recording 3% more counts than black learners. The authors concluded that objective PA instruments have a limited capacity to fully describe the diversity of PA undertaken by children. Steene-Johannessen et al.[36] recognised that self-reported instruments have a tendency to overestimate PA levels. For example, 83% of white learners (N=55) aged 10 - 13 years overestimated daily MVPA beyond 30 minutes, and 98% overestimated vigorous PA by 84.9 minutes per day using both a self-reported questionnaire and an accelerometer.[37] Taken together, measuring PA levels in general (objectively and subjectively) shows some degree of error, especially in children, and contributes to reported controversial findings in the proportion of children meeting PA guidelines.[38-41] These findings range from 42% insufficient amounts of PA in children[38] to 76% of children meeting recommended PA guidelines.[41] Discrepancies in data have been ascribed to the population studied (age, culture and region), different analysis procedures, and the variation in PA guidelines used by researchers.[42] For example, in 2002 the National Youth Risk Behaviour Survey (YRBS) used a self-reported questionnaire to estimate PA levels among 10 699 SA learners in grades 9 - 12 across the nine provinces. The results indicated that 33.5% and 44.6% of learners met recommended amounts of moderate and vigorous PA, respectively, while 37.5% of learners were inactive or did not engage in sufficient amounts of PA. The YRBS reported on a much older sample (15 - 18 years) than that in the current study, and as previously mentioned, PA levels decrease with increasing age. Finally, it is worth mentioning that the YRBS defined recommended PA as either 20 minutes of vigorous PA or 30 minutes of moderate PA. This is inconsistent with the internationally recommended amount of 60 minutes of MVPA for children.[43-44]
Study limitations
The main limitation of this study is that only a questionnaire, which is subjective in nature, was used to estimate PA levels. This lack of objective measurements (e.g. pedometers) places restrictions on the data. Possible inconsistency of administration of the survey is another limitation, as we do not know whether school personnel administered the questionnaire in the same way. Social desirability, recall bias and cultural interpretations of PA contribute to inaccurate reporting of PA data in surveys.[36] The actual population of SA youth is likely to have lower amounts of PA than the levels obtained from this sample. The PAQ-C is a further limitation, as it only measures general PA levels without describing specific frequency, time or intensity.[11] A second limitation is the two-stage sampling method used in this study, e.g. only seven out of the nine provinces contributed to the results. This may not reflect the diversity of the true population, and the results of the study should therefore be applied with caution, as the true prevalence of physical inactivity could have been underestimated. Finally, we did not differentiate between public schools, ex-model C schools and private schools, limiting our analysis of socioeconomic factors that could have influenced PA levels.
Conclusion
The study has generated information on gender, ethnic, age and provincial profiles of PA levels in SA learners. The findings suggest that SA learners engage in adequate amounts of PA. However, significant discrepancies in PA levels were found, raising important questions around population group equality in terms of access to and ability to participate in PA. These results support a target approach to promoting PA levels among high-risk groups, identified in this study as females, older learners, white learners and learners from 'other' ethnic groups. The differences in PA levels between provinces may reflect the PA priorities and cultural values of the residents and the municipalities. Whether the differences between provinces lie in priorities or cultural values, there is a need for a multidisciplinary approach between the Department of Basic Education and Sport and Recreation South Africa with the aim of:
• establishing policies and procedures for equal opportunities to participate in PA
• promoting interest in PA among female, older, white and 'other' ethnic group learners
• improving access to safe outdoor play areas in all communities
• increasing government after-school PA programmes
• re-establishing physical education as a stand-alone subject in the SA school curriculum
• delivering high-quality physical education programmes instructed by specialists in the field.
Initiatives to promote PA among SA learners will contribute to the health of the country and the growth of the economy.
Acknowledgements. The authors thank the schools and learners who participated in this study.
Author contributions. All the authors contributed significantly to the manuscript and read and approved the final submission.
Funding. This research required no external funding.
Conflicts of interest. None.
References
1. Draper C, Basset S, de Villiers A, Lambert EV, HAKSA Writing Group. Results from South Africa's 2014 Report Card on Physical Activity for Children and Youth. J Phys Act Health 2014;11(Suppl 1):S98-S104. https://doi.org10.1123/jpah.2014-0185 [ Links ]
2. Armstrong MEG, Lambert MI, Sharwood K, Lambert EV. Obesity and overweight in South African primary school children - the Health of the Nation Study. S Afr Med J 2006;96(5):439-444. [ Links ]
3. Kimani-Murage EW, Kahn K, Pettifor JM, et al. The prevalence of stunting, overweight and obesity, and metabolic disease risk in rural South African children. BMC Public Health 2010;10:158-170. https://doi.org/10.1186/1471-2458-10-158 [ Links ]
4. Lee IM, Shiroma EJ, Lobelo F, Puska P, Blair SN, Katzmarzyk PT. Effect of physical inactivity on major non-communicable diseases worldwide: An analysis of burden of disease and life expectancy. Lancet 2012;380(9838):219-229. https://doi.org10.1016/S0140-6736(12)61031-9 [ Links ]
5. Joubert J, Norman R, Lambert EV, et al., South African Comparative Risk Assessment Collaborating Group. Estimating the burden of disease attributable to physical inactivity in South Africa in 2000. S Afr Med J 2007;97(8 Pt 2):725-731. [ Links ]
6. Wang F, MacDonald T, Reffitt B, Edington DW. BMI, physical activity and health care utilization/ costs among medicare retirees. Obes Res 2005;13(Suppl 8):1450-1457. https://doi.org/10.1038/oby.2005.175 [ Links ]
7. Denkinger MD, Lukas A, Herbolsheimer F, Peter R, Nikolaus T. Physical activity and other health-related factors predict health care utilization in older adults. Z Gerontol Geriat 2012;45(4):290-297. https://doi.org/10.1007/s00391-012-0335-1 [ Links ]
8. Le Blanc D. Towards integration at last? The Sustainable Development Goals as a network of targets. Sustain Dev 2015;23(3):176-187. https://doi.org/10.1002/sd.1582 [ Links ]
9. Meyer D. Exploration of solutions for revitalisation of rural areas in South Africa. Mediterr J Soc Sc 2014;5(4):613-625. https://doi.org/10.5901/mjss.2014.v5n4p613 [ Links ]
10. City Population. South Africa: Provinces and major urban areas. http://www.citypopulation.de/SouthAfrica-UA.html (accessed 20 December 2017). [ Links ]
11. Kowalski KC, Crocker PRE, Donen RM. The Physical Activity Questionnaire for Older Children (PAQ-C) and Adolescents (PAQ-A) Manual. Canada: College of Kinesiology, University of Saskatchewan, 2004:1-38. [ Links ]
12. Moore JB, Hanes JC, Barbeau P, Gutin B, Trevino RP, Yin Z. Validation of the Physical Activity Questionnaire for Older Children in children of different races. Pediatr Exerc Sci 2007;19(1):6-19. https://doi.org/10.1123/pes.19.1.6 [ Links ]
13. Crocker PRE, Bailey DA, Faulkner RA, Kowalski KC, McGrath R. Measuring general levels of physical activity: Preliminary evidence for the Physical Activity Questionnaire for Older Children. Med Sci Sports Exerc 1997;29(10):1344-1349. [ Links ]
14. Kowalski KC, Crocker PRE, Faulkner RA. Validation of the physical activity questionnaire for older children. Pediatr Exerc Sci 1997;9(2):174-186. https://doi.org/10.1123/pes.9.2.174 [ Links ]
15. SASCHOOLS. Directory of South African schools' websites. http://saschools.co.za/directory.php (accessed 20 May 2012). [ Links ]
16. Minnaar E, Grant CC, Fletcher L. Physical activity of children from a small rural town, South Africa. S Afr Fam Pract 2016;58(2):68-73. https://doi.org/10.1080/20786190.2015.1120935 [ Links ]
17. McVeigh J, Meiring R. Physical activity and sedentary behavior in an ethnically diverse group of South African school children. J Sports Sci Med 2014;13(2):371-378. [ Links ]
18. Skaal HT, Monyeki MA, Toriola AL. The status of physical activity, body composition, health-related fitness and social correlates of physical activity among adolescents: The PAHL study. Afr J Phys Health Educ Recreation Dance 2015;21(4:2):1337-1354. http://hdl.handle.net/10520/EJC182296 [ Links ]
19. Belcher BR, Berrigan D, Dodd KW, Emken BA, Chou CP, Spruijt-Metz D. Physical activity in US youth: Effect of race/ethnicity, age, gender, and weight status. Med Sci Sports Exerc 2010;42(12):2211-2221. https://doi.org/10.1249/MSS.0b013e3181e1fba9 [ Links ]
20. Bacil EDA, Mazzardo O, Rech CR, Legnani RF, Dos S, de Campos W. Physical activity and biological maturation: A systematic review. Rev Paul Pediatr 2015;33(1):114-121. https://doi.org/10.1016/j.rpped.2014.11.003 [ Links ]
21. Nader P, Bradley R, Houts R, McRitchie S, O'Brien M. Moderate-to-vigorous physical activity from ages 9 to 15 years. JAMA 2008;300(3):295-305. https://doi.org/10.1001/jama.300.3.295 [ Links ]
22. Troiano RP, Berrigan D, Dodd KW, Masse LC, Tilert T, McDowell M. Physical activity in the United States measured by accelerometer. Med Sci Sports Exerc 2008;40(1):181-188. https://doi.org/10.1249/MSS.0b013e31817057da [ Links ]
23. Olds T, Wake M, Patton G, et al. How do school-day activity patterns differ with age and gender across adolescence? J Adolesc Health 2009;44(1):64-72. https://doi.org/10.1016/j.jadohealth.2008.05.003 [ Links ]
24. Swaminathan S, Selvam S, Thomas T, Kurpad AV, Vaz M. Longitudinal trends in physical activity patterns in selected urban south Indian school children. Indian J Med Res 2011;134(2):174-180. [ Links ]
25. Wushe SN, Moss SJ, Monyeki M. Objectively determined habitual physical activity in South African adolescents: The PAHL study. BMC Public Health 2014;14(1):1-8. https://doi.org/10.1186/1471-2458-14-471 [ Links ]
26. Bürgi R, Tomatis L, Murer K, de Bruin ED. Spatial physical activity patterns among primary school children living in neighbourhoods of varying socioeconomic status: A cross-sectional study using accelerometry and Global Positioning System. BMC Public Health 2016;16(1):282. https://doi.org/10.1186/s12889-016-2954-8 [ Links ]
27. Konstabel K, Veidebaum T, Verbestel V, et al. Objectively measured physical activity in European children: The IDEFICS study. Int J Obes 2014;38(S2):S135-S143. https://doi.org/10.1038/ijo.2014.144 [ Links ]
28. Nazroo JY. The structuring of ethnic inequalities in health: Economic position, racial discrimination, and racism. Am J Public Health 2003;93(2):277-284. https://doi.org/10.2105/AJPH.93.2.277 [ Links ]
29. Statistics South Africa. Mid-year population estimates 2014. Statistical release P0302. Pretoria: Stats SA, 2014. http://www.statssa.gov.za/publications/P0302/P03022014.pdf (accessed 20 December 2017). [ Links ]
30. Pollack M. City Parks and partners to create outdoor gyms in public open spaces. 15 December 2011. https://www.capetown.gov.za/en/Pages/CityParkspartnerstocreateoutdoorgymspublicopenspaces.aspx (accessed 17 April 2016). [ Links ]
31. City of Johannesburg. Sport and recreation. Outdoor gym proves popular. 23 April 2012. http://www.joburg.org.za/index.php?option=com_content&view=article&id=7963:outdoor-gym-proves-popular&catid=88:news-update&Itemid=2É (accessed 17 April 2016). [ Links ]
32. Schmitz KH, Lytle LA, Phillips GA, Murray DM, Birnbaum AS, Kubik MY. Psychosocial correlates of physical activity and sedentary leisure habits in young adolescents: The teens eating for energy and nutrition at a school study. Prev Med 2002;34(2):266-278. https://doi.org/10.1006/pmed.2001.0982 [ Links ]
33. Gordon-Larson P, McMurray RG, Popkin BM. Determinants of adolescent physical activity and inactivity patterns. J Pediatr 2000;105(6):1-8. https://doi.org/10.1542/peds.105.6.e83 [ Links ]
34. McVeigh JA, Norris SA, Cameron N, Pettifor JM. Associations between physical activity and bone mass in black and Caucasian South African children at age 9 yr. J Appl Physiol 2004;97(3):1006-1012. https://doi.org/10.1152/japplphysiol.00068.2004 [ Links ]
35. Owen CG, Nightingale CM, Rudnicka AR, Cook DG, Ekelund U, Whincup PH. Ethnic and gender differences in physical activity levels among 9 - 10-year-old children of white European, South Asian and African-Caribbean origin: The Child Heart Health Study in England (CHASE Study). Int J Epidemiol 2009;38(4):1082-1093. https://doi.org/10.1093/ije/dyp176 [ Links ]
36. Steene-Johannessen J, Anderssen SA, van der Ploeg HP, et al. Are self-report measures able to define individuals as physically active or inactive? Med Sci Sports Exerc 2016;48(2):235-244. https://doi.org/10.1249/MSS.0000000000000760 [ Links ]
37. Grewal T, Simran K. Awareness of physical activity levels and sedentary behaviour: An assessment of awareness of physical activity levels and sedentary behaviour among parents and children. 2013. University of Western Ontario Electronic Thesis and Dissertation Repository. Paper 1155. http://ir.lib.uwo.ca/etd/1155 (accessed 20 December 2017). [ Links ]
38. Reddy SP, Resnicow K, James S, et al. Rapid increases in overweight and obesity among South African adolescents: Comparison of data from the South African National Youth Risk Behaviour Survey in 2002 and 2008. Am J Public Health 2012;102(2):262-268. https://doi.org/10.2105/AJPH.2011.300222 [ Links ]
39. Katzmarzyk PT, Barreira TV, Broyles ST, et al. Physical activity, sedentary time, and obesity in an international sample of children. Med Sci Sports Exerc 2015;47(10):2062-2069. https://doi.org//10.1249/MSS.0000000000000649 [ Links ]
40. Fakhouri TI, Hughes JP, Brody DJ, Kit BK, Ogden CL. Elementary school-aged children in the United States from 2009 to 2010. JAMA Pediatr 2013;167(3):223-229. https://doi.org/10.1001/2013.jamapediatrics.122 [ Links ]
41. Leadbetter C, Geyer J, O'Connor N. The Scottish Health Survey: Physical activity. 25 November 2014. http://www.gov.scot/Resource/0046/00464091.pdf (accessed 20 December 2017). [ Links ]
42. Borges A, Gomes TN, Santos D, et al. A count model to study the correlates of 60 min of daily physical activity in Portuguese children. Int J Environ Res Public Health 2015;12(3):2557-2573. https://doi.org/10.3390/ijerph120302557 [ Links ]
43. World Health Organization. Global Recommendations on Physical Activity for Health. Geneva: WHO, 2010. [ Links ]
44. US Department of Health and Human Services. 2008 Physical Activity Guidelines for Americans. Washington, DC: USDHHS, 2008. [ Links ]
 Correspondence:
A van Biljon
vanbiljona@unizulu.ac.za
Accepted 5 September 2017

