


Serviços Personalizados
Artigo
 Inglês (pdf)
 Artigo em XML
 Referências do artigo
Indicadores

Links relacionados
-
 Citado por Google
 -
 Similares em Google
Compartilhar

 Permalink
SAMJ: South African Medical Journal
versão On-line ISSN 2078-5135
versão impressa ISSN 0256-9574
SAMJ, S. Afr. med. j. vol.108 no.1 Pretoria Jan. 2018
http://dx.doi.org/10.7196/samj.2018.v108i1.11090
RESEARCH
Keeping our heads above water: A systematic review of fatal drowning in South Africa
C J SaundersI, II, III; D SewduthIV; N NaidooV
IBSc (Med) Hons, PhD; Division of Emergency Medicine, Department of Surgery, Faculty of Health Sciences, University of Cape Town, South Africa
IIBSc (Med) Hons, PhD; Division of Emergency Medicine, Department of Surgery, Faculty of Health Sciences, University of Cape Town, South Africa
IIIBSc (Med) Hons, PhD; Division of Emergency Medicine, Department of Surgery, Faculty of Health Sciences, University of Cape Town, South Africa
IVMEd, MDP; Lifesaving South Africa, Durban, South Africa
VN Dip AEC, BTech EMC, H Dip Ed, MPH; Department of Emergency Medical Sciences, Faculty of Health and Wellness Sciences, Cape Peninsula University of Technology, Cape Town, South Africa
ABSTRACT
BACKGROUND: Drowning is defined as the process of experiencing respiratory impairment from submersion/immersion in liquid, and can have one of three outcomes - no morbidity, morbidity or mortality. The World Health Organization African region accounts for approximately 20% of global drowning, with a drowning mortality rate of 13.1 per 100 000 population. The strategic implementation of intervention programmes driven by evidence-based decisions is of prime importance in resource-limited settings such as South Africa (SA).
OBJECTIVE: To review the available epidemiological data on fatal drowning in SA in order to identify gaps in the current knowledge base and priority intervention areas.
METHODS: A systematic review of published literature was conducted to review the available epidemiological data describing fatal drowning in SA. In addition, an internet search for grey literature, including technical reports, describing SA fatal drowning epidemiology was conducted.
RESULTS: A total of 13 published research articles and 27 reports obtained through a grey literature search met the inclusion and exclusion criteria. These 40 articles and reports covered data collection periods between 1995 and 2016, and were largely focused on urban settings. The fatal drowning burden in SA is stable at approximately 3.0 per 100 000 population, but is increasing as a proportion of all non-natural deaths. Drowning mortality rates are high in children aged <15 years, particularly in those aged <5.
CONCLUSIONS: This review suggests that SA drowning prevention initiatives are currently confined to the early stages of an effective injury prevention strategy. The distribution of mortality across age groups and drowning location differs substantially between urban centres and provinces. There is therefore a need for detailed drowning surveillance to monitor national trends and identify risk factors in all SA communities.
At the turn of the millennium, drowning was the third leading cause of unintentional injury-related death globally, with an estimated mortality rate of 7.4 per 100 000 population.[1] The drowning mortality rate for the World Health Organization (WHO) African region was considerably higher at 13.1 per 100 000 population[1] and in 2012 was found to account for 20% of drowning globally. [2] Drowning is defined as the process of experiencing respiratory impairment from submersion/immersion in liquid and can have one of three outcomes - no morbidity, morbidity or mortality.[2,3] Non-fatal drowning incidents are often associated with significant morbidity and socioeconomic burden from severe pulmonary and neurological sequelae.[4,5] Taking both morbidity and mortality into account, the WHO global burden of disease study estimates that 125 500 years of healthy life (disability-adjusted life-years) were lost due to drowning in South Africa (SA) in 2012.[6]
Drowning prevention is a key priority for the International Lifesaving Federation (ILS), the Royal Life Saving Society, and their member organisations such as Lifesaving South Africa (LSA). The first phase in proven injury prevention models is establishing the extent of the injury burden through appropriate surveillance.[7] Well-designed surveillance programmes will inform the second phase of such models: the identification of risk factors and predisposing conditions.[7,8] The strategic implementation of intervention programmes driven by evidence-based decisions is of prime importance in resource-limited settings such as SA. However, the 2007 ILS World Drowning Report[9] indicates the absence of reliable drowning surveillance in the developing world, particularly in Africa.
Objective
To systematically review the available epidemiological data on fatal drowning in SA in order to identify gaps in the current knowledge base and priority intervention areas.
Methods
A systematic review of published literature was conducted to identify the available epidemiological data describing fatal drowning in SA. The EBSCOhost, Medline (via PubMed), Web of Science, Scopus, Science Direct, Safety Lit and Cochrane Systematic Reviews databases were searched in March 2017. The EBSCOhost database search included the Academic Search Premier, Cumulative Index to Nursing and Allied Health Literature, Africa Wide Information, General Science Abstracts and Psylnfo databases. Articles in which 'drown*', 'immersion injur*' or 'submersion injur*' appeared anywhere in the title, abstract or keywords together with the exact term 'South Africa' anywhere in the article were retrieved (Table 1). Searches were limited to English articles published after 1994.
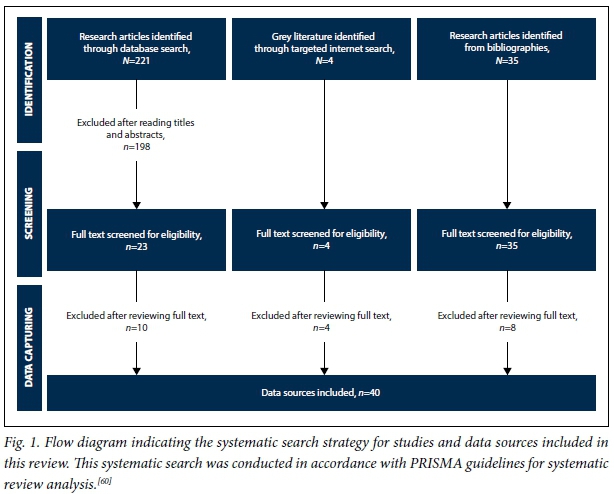
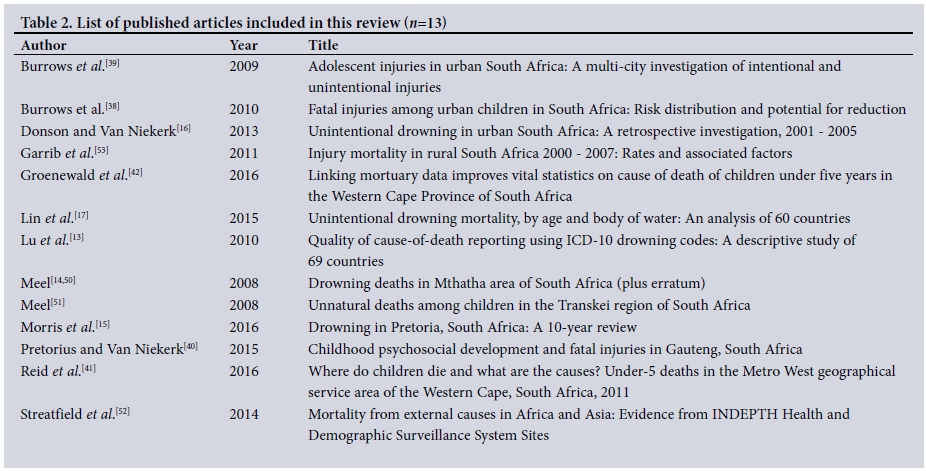
After removing duplicates, two authors separately screened the titles and abstracts for indications that articles may include epidemiological data on fatal drowning in SA collected after the end of apartheid in 1994 (Fig. 1). Articles were excluded if drowning epidemiology data were collected in or before 1994 for three reasons: (i) the historical exclusion of data from the former homeland states during the apartheid era;[10](ii) the recognised under-registration of deaths in the black population during the apartheid era;[11] and (iii) the effects of migrant labour on the estimation of population size during this time.[12] The full text of remaining articles was reviewed by two authors separately. Where it was possible to separate the data, only data on unintentional drowning were included. Where it was not possible to separate the data, this is noted in the results. The bibliographies of included articles were screened for additional articles of relevance, which were submitted to the same review process before inclusion. Thirteen published research articles were included in this review (Table 2).
In addition, an internet search for grey literature describing SA fatal drowning epidemiology was conducted (March 2017). The websites of Statistics South Africa (Stats SA; www.statssa.gov.za), the South African Medical Research Council (SAMRC; www.mrc.ac.za), the SA government departments of Home Affairs (http://www.home-affairs.gov.za) and Health (www.health.gov.za), the South African Police Service (www.saps.gov.za), the National Sea Rescue Institute (NSRI; http://www.nsri.org.za/) and LSA (http://www.lifesaving.co.za/) were searched for relevant data using a search strategy specific to the context of each website. Epidemiological data collected before 1994 were excluded. Twenty-seven additional sources of information were screened and included in this review (Table 3). These included public or technical reports from Stats SA, the SAMRC Violence, Injury and Peace Research Unit (VIPRU) and LSA.
There was a large variation in design, data collection and reporting in the retrieved information, and consequently direct comparison and meta-analysis were not possible. Where appropriate, descriptive statistics including means and standard deviations (SDs) were computed in Microsoft Excel (Microsoft Office for Mac 2011, version 14.6.7, Microsoft, USA), and linear regression was performed using GraphPad PRISM (version 5.02, GraphPad Software, USA).
Results
The systematic search and review strategy retrieved 13 published research articles, and a further 27 reports obtained through a grey literature search, that met the inclusion and exclusion criteria (Fig. 1). These 40 articles and reports covered data collection periods between 1995 and 2016, and were largely focused on urban settings. Drowning surveillance was the primary aim in only seven of the included articles and reports.[13-19]
The drowning burden in SA
In the included articles and reports, the majority of data reported were sourced from Stats SA (n=12) and the SAMRC-VIPRU National Injury Mortality Surveillance System (NIMSS) (n=17), both of which are based on vital registration records. Fig. 2 shows the number of fatal accidental drownings per year as indicated in the annual Stats SA P0309.3 report on mortality and causes of death in SA between 1997 and 2015.[20-31] In the most recent 5 years between 2011 and 2015, there was an average of 1 541 (SD 81) fatal drownings per year, with a mean drowning mortality rate of 2.87 (0.23) per 100 000 population (Fig. 2). Although the absolute number of fatal drownings increased significantly between 1999 and 2015 (r2=0.419; p=0.012), the drowning mortality rate per 100 000 population remained consistent (r2=0.243; p=0.087).

However, drowning fatalities as a proportion of all non-natural deaths rose significantly over this same period (r2=0.465; p=0.007). Lu et al.[13] investigated the quality of 'cause of death' reporting in drowning fatalities. Using the WHO mortality database, 147 unintentional drowning deaths were reported for SA in 2005, which differs remarkably from the 1 231 drowning and submersion fatalities reported by Stats SA[22] for the same year. Lin et al.[17] examined unintentional drowning mortality across 60 countries using mortality data from the WHO Health Statistics and Health Information services and reported an age-standardised drowning mortality rate of 2.5 per 100 000 population for SA between 2007 and 2009.
The NIMSS, undertaken by the SAMRC-VIPRU in collaboration with pathology services, has varying degrees of coverage of injury fatalities reported by medicolegal laboratories in several urban centres across SA.[32-37] Coverage has varied by location and by year over the period of its existence, representing 35 - 56% of all non-natural deaths in SA with higher coverage in urban centres. Fig. 3 presents the age-adjusted unintentional drowning mortality rate per 100 000 population across the major urban centres included in the NIMSS annual reports between 2001 and 2007.[34-36] In addition, Donson and Van Niekerk[16] performed a retrospective review of unintentional fatal drowning in five urban centres in SA using the NIMSS data. Age-adjusted drowning mortality rates ranged from 1.4 per 100 000 population in the inland city of Pretoria to 2.7 per 100 000 in the coastal city of Cape Town between 2001 and 2005. In these five cities, the child drowning mortality rate (3.2 per 100 000 population) was more than double the adult drowning mortality rate (1.5 per 100 000) across this time period. Morris et al.[15] performed a 10-year retrospective review of drowning mortality (both intentional and unintentional) in Pretoria and reported 278 confirmed drowning fatalities between 2002 and 2011, representing 1.2% of the caseload for the relevant inland, urban medicolegal laboratory.
Three published articles analysed NIMSS data to describe fatal injury epidemiology in SA children specifically. Burrows and colleagues investigated fatal injuries in children (0 - 14 years)[38] and adolescents (10 - 19 years)[39] in six South African cities (Buffalo City, Cape Town, Johannesburg, eThekwini, Tshwane, Nelson Mandela Metro) between 2001 and 2003. The age-adjusted unintentional drowning mortality rate across all six cities was 5.3 per 100 000 population for male children and 2.1 per 100 000 for female children.[38] Drowning mortality rates differed considerably across cities, ranging from 2.2 per 100 000 population in Cape Town to 9.2 per 100 000 in Buffalo City; however, drowning was in the top five causes of fatal injury across all six cities.[38] The population-attributable risk for drowning in children was high for both sex and city, indicating substantial potential for risk reduction.[38] In adolescents, drowning accounted for approximately a third of non-transport-related unintentional injuries (males 34%, females 27%).[39] Pretorius and Van Niekerk[40] investigated the occurrence of injury mortality in Gauteng Province in children (0 - 19 years of age), where drowning represented 8.9% of the total fatal injury burden between 2008 and 2011. Two studies used the Western Cape local mortality surveillance system to describe causes of death in young children in the Western Cape.[41,42] In 2011, drowning accounted for 2.8% of deaths in children aged <5 years in the Western Cape.[42]
NIMSS coverage has recently been limited to the inland provinces of Mpumalanga and Gauteng. In Mpumalanga, there was an average of 112 (SD 27) fatal drownings annually between 2008 and 2011, with a mean age-adjusted unintentional drowning mortality rate of 3.3 (0.8) per 100 000 population.[43-46] Drowning was consistently the leading cause (27.5% (2.0%)) of non-transport-related unintentional injury deaths. In Gauteng, there was an average of 172 (31) fatal drownings annually between 2008 and 2011, with a mean age-adjusted drowning mortality rate of 2.1 (0.5) per 100 000 population.[47-49] Drowning accounted for an average of 13.6% (2.9%) of non-transport-related unintentional injury deaths in Gauteng during this time.
There is a paucity of data describing drowning in rural settings in SA. One study included combined intentional and unintentional drowning data for Mthatha, a rural inland town in the Eastern Cape Province.[14,50] On the assumption of zero population growth, the drowning mortality rate increased from 4.0 per 100 000 population in 1995 to 12.0 per 100 000 in 2004. Another study in Mthatha described non-natural deaths in children aged <18 years, where drowning made up 39.4% of all non-traumatic violent deaths (n=166) between 1996 and 2004.[51] Two studies have published analyses of injury-related mortality at a rural demographic surveillance site in northern KwaZulu-Natal Province.[52,53] The Africa Centre is a health and demographic surveillance system site in a predominantly rural setting.[52] Between 2000 and 2007, accidental drowning accounted for 3.3% of all injury deaths at this site and was the second most common cause of injury death in children after road traffic injuries.[53] Streatfield et al.[52]reported an age-sex-time standardised drowning mortality rate of 0.07 per 1 000 person-years at this site for adult males.
Drowning mortality differs according to age
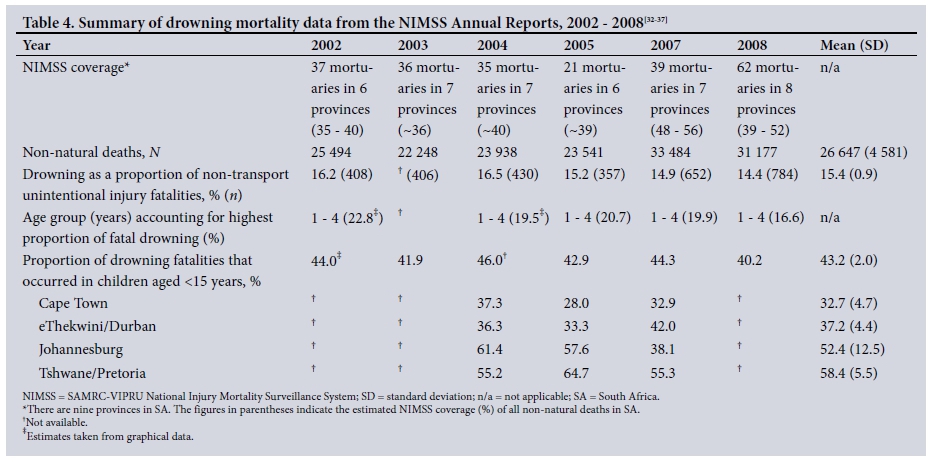
Drowning mortality is consistently higher in children aged <15 years than in adults. On average, 43.2% (SD 2.0%) of drownings described in the NIMSS annual reports occurred in children aged <15 years (Table 4).[32-37] Morris et al.[15] reported that 55% of drowning deaths in Pretoria involved children aged <18 years. This was consistent with data from rural settings such as the Africa Centre, where 65% of drownings occurred in children aged <15 years.[53] LSA published two circulars analysing fatal drowning incidents reported in the SA media in 2015 (n=232, representing 16% of fatal drownings)[18] and 2016 (n=249).[19] The highest proportion of reported incidents occurred in children aged <10 years (33.0% in 2015 and 29.1% in 2016). In an investigation of unintentional drowning mortality across 60 countries, the age-standardised death rates for SA were highest in the age group 0 - 4 years (4.4 per 100 000 population, 95% confidence interval (CI) 4.1 - 4.8). Interestingly, this was followed by adults aged >65 years (3.2 per 100 000, 95% CI 2.8 - 3.6) and then children aged 5 - 14 years (2.9 per 100 000, 95% CI 2.7 - 3.1).[17] Similarly, the NIMSS annual reports consistently report the highest proportion of drowning fatalities occurring in the age group 1 - 4 years (Table 4). In Donson and Van Niekerk's[16] city-level analysis of NIMSS data, the highest age-adjusted drowning mortality rates were 6.3 per 100 000 population in children aged 0 - 4 years, and 2.2 per 100 000 in children aged 5 - 14 years. The age group 0 - 4 years had the highest drowning mortality rate in all five cities investigated, the rate being particularly high in the inland cities of Johannesburg (9.3 per 100 000 population) and Pretoria (6.9 per 100 000).[16] In a separate analysis of drowning in Pretoria, 19% of all drowning fatalities occurred in the age group 1 - 2 years and 15% occurred in children aged <1 year.[15] Pretorius and Van Niekerk[40] investigated the occurrence of injury mortality in Gauteng in developmentally meaningful age groups. Drowning accounted for 9.4% of injury mortality in infancy (0 - 1 years), 16.8% in early childhood (2 - 3 years), 13.4% in preschool children (4 - 6 years), 13.1% in school-age children (7 - 12 years) and 3.0% in adolescence (13 - 19 years), with the highest mortality rate observed in early childhood (1.29 per 100 000 population).
Drowning mortality differs between males and females
Drowning mortality was consistently higher in males than in females across all included articles and reports. Burrows et al.[38] observed that the difference in mortality rate by sex was highest for drowning when compared with other fatal injuries in SA children. In Pretoria, 79% of fatal drowning victims were male. [15] The male-to-female ratio ranged between 2.8[14] and 4.0,[16] and was highest in the 45 - 59, 15 - 29 and 30 - 44 years age groups.[16] Donson and Van Niekerk[16] reported an age-adjusted drowning mortality rate of 3.4 per 100 000 population in males compared with 0.9 per 100 000 in females in an urban setting. This was consistent with observations in a rural setting, where Garrib et al.[5i]reported a drowning mortality rate of 6.2 per 100 000 person-years in males compared with 3.4 per 100 000 in females.
Drowning risk factors
Drowning occurred disproportionately in the summer months of December, January and February.[15,16] Donson and Van Niekerk[16] reported that just under half (48.9% (SD 3.2%)) of drowning incidents occurred over weekends (Fridays to Sundays - Sundays 17.9%, Saturdays 17.2%), mostly between 12h00 and 19h59 (59.0% (SD 4.7%)).
With the exception of the coastal city of Port Elizabeth, where 76.4% of drownings occurred in the sea, approximately half of drowning incidents occurred in and around the home (Johannesburg 51.6%, Pretoria 46.7%).[16] This was particularly the case in young children, with 70.0% of drownings in children aged 0 - 4 years occurring in or around the home in buckets, bathtubs and swimming pools.[16] In the inland city of Pretoria, infants were more likely to drown in swimming pools (56%) and buckets (17%), while an even higher proportion of drownings in toddlers occurred in swimming pools (69%).[15] Fatal drowning in older children, adolescents and adults was more evenly distributed between swimming pools, dams and rivers.[15] There was a paucity of data regarding activity prior to drowning. In media reports compiled by LSA, the activity prior to drowning was unknown in 21.6% of cases. Victims were swimming in 27.8% of cases, playing near water in 13.5% and fishing in 9.4%.[18,19]
Few studies reported on blood alcohol content (BAC) at the time of drowning. In Pretoria, alcohol was detected in 42% of drowning fatality cases in which blood alcohol analysis was undertaken, of which 35% (n=37 males, n=3 females) had a BAC >0.05 g/100 mL.[15] Similarly, Donson and Van Niekerk[16] observed that alcohol was detected in 40% of drowning fatality cases in which blood alcohol analysis was undertaken; of these, 85% had levels >0.05 g/100 mL. One-third of cases in which alcohol was detected had a BAC consistent with being 'drunk' to 'very drunk', and males were 11 times more likely than females to have a positive BAC result.[16]
Discussion
This systematic review aimed to identify and review the available epidemiology data on fatal drowning in SA in order to identify gaps in the current knowledge base and priority intervention areas. It has highlighted the lack of current and routine drowning surveillance in SA. The results provide an overview of the drowning burden in SA. Although many of the included data are outdated, the analysis of vital registration records from Stats SA reports suggests that the drowning mortality rate in SA is stable at ~3.0 per 100 000 population. It is, however, interesting to note that the proportion of non-natural deaths accounted for by drowning is increasing. This may be due to sustained and focused public health efforts to reduce the burden of other injuries such as burns and road traffic injuries. The population-attributable risk for fatal drowning in children is >40% for both sex and city in SA,[38] indicating substantial potential for drowning risk reduction by identifying and targeting high-risk locations and risk factors through similar drowning prevention programmes. The mortality rate presented here is just under half that reported for global drowning estimates (7.4 per 100 000 population).[1] However, there is a large variation in global drowning mortality, with drowning rates in low- and middle-income countries reported to be over three times higher than those in high-income countries.[2] In an analysis of 60 countries, SA ranked 21st in all-age drowning mortality but among the top 10 for child drowning mortality.[17]
Drowning mortality rates are high in SA children aged <15 years, particularly in those aged <5 years. This is consistent with global patterns, where male children aged <5 years have been found to have the highest drowning mortality rates.[1] The high proportion of drownings that occur in and around the home in this age group highlights the need for campaigns to increase awareness and implementation of safety measures around the home including barriers to access, improved supervision and water safety education.[8] There is a paucity of local legislation regulating residential pool safety measures,[54] which clearly highlights the need for policy engagement in local government structures. In addition, addressing broader socioeconomic determinants of health such as infrastructure and formal housing development, as well as improving access to sanitation, may have a significant effect on drowning in SA.[55] There is very limited evidence describing activity prior to drowning, which appears to be unknown in a substantial proportion of drowning incidents in SA. This is consistent with the findings of a recent systematic review describing global risk factors for fatal river drowning,[56] which reported a scarcity of published studies describing activity prior to drowning.
A recent study by Joanknecht et al.[5]described a retrospective chart review of immersion injuries admitted to Red Cross War Memorial Children's Hospital (RCWMCH) in Cape Town, SA. This study was not included in the current review as it largely reports on non-fatal drowning injuries. However, the drowning risk factors and trends described are worth noting in comparison with the results presented here. RCWMCH admits children up to 14 years of age, and 60% of admissions for immersion injuries were of children aged <5 years (70.7% male). Similar to the findings for fatal drowning presented here, the majority of drowning incidents occurred in and around the home (60.5%), but were only witnessed in 19% of cases.[5] The authors further described an interesting relationship between location of drowning, age and first language in these children. In particular, children aged <5 years were more likely than older children to drown in buckets, baths and private swimming pools, while the majority of older children drowned in rivers, public swimming pools and the ocean.[5] The highest proportion of drownings in Afrikaans- and English-speaking children occurred in private swimming pools, while among Xhosa-speaking children the highest proportion occurred in public swimming pools and buckets.[5] First language may be used as a gross proxy for population group. The majority of South Africans living in informal settlements are from the black and coloured population groups,[57] and this uniquely SA pattern of drowning prevalence is therefore likely to be a result of specific racialised socioeconomic determinants of health. In homes without a plumbed water supply, water for cooking and cleaning must be collected from central collection points daily and is kept in buckets around the home. Although not supported by the evidence presented in this review, poor infrastructure in these settlements may create additional drowning risks such as large puddles associated with water leaks, uncovered storm-water drains and open grey/black-water channels.[58] Members of low-income households are also not likely to have access to private swimming pools, and therefore make use of public swimming pools and bodies of water accessible to the public.
The ratio of male-to-female drowning reported here is higher than that reported globally, where males are generally twice as likely to drown as females, but is consistent with the higher drowning prevalence in males globally.[1,2] The high ratio of male to female drowning is particularly pronounced in adulthood, and this observation may be explained by increased risk-taking behaviour in males, particularly in teenagers and during early adulthood.[59] This is supported by the observation that adult males were more likely than females to be under the influence of alcohol at the time of death. There were limited data describing drowning risk factors other than sex and age. The prevalence of drowning was highest in the warmer summer months, during weekends and during the mid- to late afternoon. Although no exposure data are available, it can reasonably be hypothesised that this pattern reflects the higher exposure during these times. The limited data available suggest that ~40% of drowning victims, males in particular, will test positive for blood alcohol at the time of death. Globally, alcohol use around bodies of water has been identified as a significant risk factor for drowning in adolescents and adults.[2]
Study limitations
There are several limitations to the data presented in this review. First, the majority of the data included were extracted from vital registration records or medicolegal autopsy records and therefore exclude cases where the body was not recovered after drowning. [17] Such cases are likely to be biased towards drowning incidents in large bodies of water and may therefore affect the distribution of drowning across locations. Second, there is inconsistency in the separation and annotation of unintentional and intentional drowning incidents. Although this review has attempted to include only data relating to unintentional drowning, there are cases noted in the results where it was not possible to do so. Donson and Van Niekerk[16] have previously reported that 79.9% of deaths from drowning in SA were unintentional, and it can therefore be assumed that, where included, intentional drowning deaths are under-represented in the data. Third, the data presented here are mainly focused on urban SA, and data on drowning in rural areas are conspicuous in their paucity.
Conclusions
The SA public health system is laden with a high infectious disease burden and a high prevalence of injury, including violence, transport-related injuries and burns, and there are limited resources for injury prevention programmes outside these high-priority areas. It is therefore imperative that drowning prevention initiatives are evidence-based and effective. This review suggests that SA drowning prevention initiatives are currently confined to the early stages of an effective injury prevention strategy. The results presented suggest that drowning mortality and the distribution of mortality across age groups and drowning location differ substantially between urban centres and provinces. However, there are few supporting data sources for these findings. In addition, there is very little exploration of other risk factors such as activity prior to drowning and the role of alcohol consumption. Evidence suggests that epidemiological studies describing specific risk factors associated with location of, and activity prior to, drowning are needed to inform targeted intervention strategies.[56] Furthermore, there is a gap in the evidence base relating to risk factors for adult drowning. There is therefore a need for consistent and detailed drowning surveillance in SA in order to monitor national trends as well as identify risk factors in all SA communities and allow for temporal and spatial comparison of drowning epidemiology at both a national and international level. This requires a collaborative system including first-response organisations, local government, hospital emergency departments and forensic departments as well as a co-ordinating body such as the National Department of Health or a national water safety authority.
Acknowledgements. None.
Author contributions. CJS contributed to the conception and design of the work, data acquisition and analysis, interpretation of the data and drafting the manuscript. DS contributed to the conception of the work and critical revision of the manuscript. NN contributed to data analysis, interpretation of the data and critical revision of the manuscript. All authors approved the final version of this manuscript and accept responsibility for the accuracy and integrity of this work.
Funding. The work reported did not require project funding.
Conflicts of interest. None.
References
1. Peden MM, McGee K. The epidemiology of drowning worldwide. Inj Control Saf Promot 2003;10(4):195-199. https://doi.org/10.1076/icsp.10A195.16772 [ Links ]
2. World Health Organization. Global Report on Drowning: Preventing a Leading Killer. Geneva: WHO, 2014. http://www.who.int/violence_injury_prevention/global_report_drowning/en/ (accessed 15 January 2017). [ Links ]
3. Idris AH, Berg RA, Bierens J, et al. Recommended guidelines for uniform reporting of data from drowning. Circulation 2003;108(20):2565-2574. https://doi.org/10.1161/01.CIR.0000099581.70012.68 [ Links ]
4. Suominen PK, Vähätalo R. Neurologic long term outcome after drowning in children. Scand J Trauma Resusc Emerg Med 2012;20(55):1-7. https://doi.org/10.1186/1757-7241-20-55 [ Links ]
5. Joanknecht L, Argent AC, van Dijk M, van As AB. Childhood drowning in South Africa: Local data should inform prevention strategies. Pediatr Surg Int 2015;31(2):123-130. https://doi.org/10.1007/s00383-014-3637-0 [ Links ]
6. Department of Health Statistics and Information Systems. WHO Methods and Data Sources for Country-level Causes of Death. Geneva: World Health Organization, 2014. http://www.who.int/healthinfo/statistics/GlobalCODmethod.pdf (accessed 15 January 2017). [ Links ]
7. Finch C. A new framework for research leading to sports injury prevention. J Sci Med Sport 2006;9(1-2):3-9. https://doi.org/10.1016/j.jsams.2006.02.009 [ Links ]
8. World Health Organization. Preventing Drowning: An Implementation Guide. Geneva: WHO, 2017. http://www.who.int/violence_injury_prevention/drowning/drowning_prevention_guide/en/ (accessed 29 April 2017). [ Links ]
9. International Life Saving Federation. World Drowning Report 2007. Leuven: ILSF, 2007. https://ilsf.org/drowning-prevention/library/world-drowning-report (accessed 4 December 2017). [ Links ]
10. Kibel SM, Joubert G, Bradshaw D. Injury-related mortality In South African children, 1981 - 1985. S Afr Med J 1990;78:398-403. [ Links ]
11. Botha JL, Bradshaw D. African vital statistics - a black hole? S Afr Med J 1985;67:977-981. [ Links ]
12. Davis S, Smith LS. The epidemiology of drowning in Cape Town - 1980 - 1983. S Afr Med J 1985;68:739-742. [ Links ]
13. Lu T-H, Lunetta P, Walker S. Quality of cause-of-death reporting using ICD-10 drowning codes: A descriptive study of 69 countries. BMC Med Res Methodol 2010;10:30. https://doi.org/10.1186/1471-2288-10-30 [ Links ]
14. Meel BL. Drowning deaths in Mthatha area of South Africa. Med Sci Law 2008;48(4):329-332. https://doi.org/10.1258/rsmmsl.48.4.329 [ Links ]
15. Morris NK, du Toit-Prinsloo L, Saayman G. Drowning in Pretoria, South Africa: A 10-year review. J Forensic Leg Med 2016;37:66-70. https://doi.org/10.1016/j.jflm.2015.10.010 [ Links ]
16. Donson H, van Niekerk A. Unintentional drowning in urban South Africa: A retrospective investigation, 2001 - 2005. Int J Inj Contr Saf Promot 2013;20(3):218-226. https://doi.org/10.1080/17457300.2012.686041 [ Links ]
17. Lin C-Y, Wang Y-F, Lu T-H, Kawach I. Unintentional drowning mortality, by age and body of water: An analysis of 60 countries. Inj Prev 2015;21(e1):e43-50. https://doi.org/10.1136/injuryprev-2013-041110 [ Links ]
18. Lifesaving South Africa. Drowning statistics: January 2015 - December 2015. Durban: LSA, 2016. http://lifesaving.co.za/blog/176/#sthash.IwMVYctl.dpbs (accessed 15 March 2017). [ Links ]
19. Lifesaving South Africa. Drowning statistics: January 2016 - December 2016. Durban: LSA, 2017. http://lifesaving.co.za/download-result.php?filename_download=1483535132drowning-stats-jan-2016-dec-2016.pdf (accessed 15 January 2016). [ Links ]
20. Statistics South Africa. Mortality and causes of death in South Africa, 1997 - 2003. Findings from death notification. Statistical release P0309.3. Pretoria: Stats SA, 2005. http://www.statssa.gov.za/?page_id=1854&PPN=P0309.3&SCH=3337 (accessed 15 March 2017). [ Links ]
21. Statistics South Africa. Mortality and causes of death in South Africa, 2003 and 2004. Findings from death notification. Statistical release P0309.3. Pretoria: Stats SA, 2006. http://www.statssa.gov.za/?page_id=1854&PPN=P0309.3&SCH=3659 (accessed 15 March 2017). [ Links ]
22. Statistics South Africa. Mortality and causes of death in South Africa, 2005. Findings from death notification. Statistical release P0309.3. Pretoria: Stats SA, 2007. http://www.statssa.gov.za/?page_id=1854&PPN=P0309.3&SCH=3937 (accessed 15 March 2017). [ Links ]
23. Statistics South Africa. Mortality and causes of death in South Africa, 2006 . Findings from death notification. Statistical release P0309.3. Pretoria: Stats SA, 2008. http://www.statssa.gov.za/?page_id=1854&PPN=P0309.3&SCH=4254 (accessed 15 March 2017). [ Links ]
24. Statistics South Africa. Mortality and causes of death in South Africa, 2008. Findings from death notification. Statistical release P0309.3. Pretoria: Stats SA, 2010. http://www.statssa.gov.za/?page_id=1854&PPN=P0309.3&SCH=4790 (accessed 15 March 2017). [ Links ]
25. Statistics South Africa. Mortality and causes of death in South Africa, 2009. Findings from death notification. Statistical release P0309.3. Pretoria: Stats SA, 2011. http://www.statssa.gov.za/?page_id=1854&PPN=P0309.3&SCH=5097 (accessed 15 March 2017). [ Links ]
26. Statistics South Africa. Mortality and causes of death in South Africa, 2010. Findings from death notification. Statistical release P0309.3. Pretoria: Stats SA, 2013. http://www.statssa.gov.za/?page_id=1854&PPN=P0309.3&SCH=5490 (accessed 15 March 2017). [ Links ]
27. Statistics South Africa. Mortality and causes of death in South Africa, 2011. Findings from death notification. Statistical release P0309.3. Pretoria: Stats SA, 2014. http://www.statssa.gov.za/?page_id=1854&PPN=P0309.3&SCH=5774 (accessed 15 March 2017). [ Links ]
28. Statistics South Africa. Mortality and causes of death in South Africa, 2012. Findings from death notification. Statistical release P0309.3. Pretoria: Stats SA, 2014. http://www.statssa.gov.za/?page_id=1854&PPN=P0309.3&SCH=6015 (accessed 15 March 2017). [ Links ]
29. Statistics South Africa. Mortality and causes of death in South Africa, 2013. Findings from death notification. Statistical release P0309.3. Pretoria: Stats SA, 2014. http://www.statssa.gov.za/?page_id=1854&PPN=P0309.3&SCH=5955 (accessed 15 March 2017). [ Links ]
30. Statistics South Africa. Mortality and causes of death in South Africa, 2014. Findings from death notification. Statistical release P0309.3. Pretoria: Stats SA, 2015. http://www.statssa.gov.za/?page_id=1854&PPN=P0309.3&SCH=6377 (accessed 15 March 2017). [ Links ]
31. Statistics South Africa. Mortality and causes of death in South Africa, 2015. Findings from death notification. Statistical release P0309.3. Pretoria: Stats SA, 2017. http://www.statssa.gov.za/?page_id=1854&PPN=P0309.3&SCH=6987 (accessed 15 March 2017). [ Links ]
32. MRC-UNISA Crime, Violence and Injury Lead Programme. A profile of fatal injuries in South Africa: Fourth Annual Report of the National Injury Mortality Surveillance System 2002. 2003. http://www.mrc.ac.za/crime/nimssannual2002.pdf (accessed 15 March 2017). [ Links ]
33. MRC-UNISA Crime, Violence and Injury Lead Programme. A profile of fatal injuries in South Africa: Fifth annual report 2003 of the National Injury Mortality Surveillance System. 2004. http://www.mrc.ac.za/crime/summary2003.pdf (accessed 15 March 2017). [ Links ]
34. MRC-UNISA Crime, Violence and Injury Lead Programme. A profile of fatal injuries in South Africa: 6th Annual Report of the National Injury Mortality Surveillance System 2004. 2005. http://www.mrc.ac.za/crime/national2004.pdf (accessed 15 March 2017). [ Links ]
35. MRC-UNISA Crime, Violence and Injury Lead Programme. A profile of fatal injuries in South Africa: 7th Annual Report of the National Injury Mortality Surveillance System 2005. 2007. http://www.mrc.ac.za/crime/national2005.pdf (accessed 15 March 2017). [ Links ]
36. MRC-UNISA Crime, Violence and Injury Lead Programme. A profile of fatal injuries in South Africa 2007. 2008. http://www.mrc.ac.za/crime/nimss07.PDF (accessed 15 March 2017). [ Links ]
37. MRC-UNISA Crime, Violence and Injury Lead Programme. A profile of fatal injuries in South Africa 2008. 2009. http://www.mrc.ac.za/crime/nimss2008.pdf (accessed 15 March 2017). [ Links ]
38. Burrows S, van Niekerk A, Laflamme L. Fatal injuries among urban children in South Africa: Risk distribution and potential for reduction. Bull World Health Organ 2010;88(4):267-272. https://doi.org/10.2471/BLT.09.068486 [ Links ]
39. Burrows S, Swart L-A, Laflamme L. Adolescent injuries in urban South Africa: A multi-city investigation of intentional and unintentional injuries. Int J Child Adolesc Health 2009;2(1):117-129. [ Links ]
40. Pretorius K, van Niekerk A. Childhood psychosocial development and fatal injuries in Gauteng, South Africa. Child Care Health Dev 2015;41(1):35-44. https://doi.org/10.1111/cch.12140 [ Links ]
41. Reid AE, Hendricks MK, Groenewald P, Bradshaw D. Where do children die and what are the causes? Under-5 deaths in the Metro West geographical service area of the Western Cape, South Africa, 2011. S Afr Med J 2016;106(4):359-364. https://doi.org/10.7196/SAMJ.2016.v106i4.10521 [ Links ]
42. Groenewald P, Bradshaw D, Neethling I, et al Linking mortuary data improves vital statistics on cause of death of children under five years in the Western Cape Province of South Africa. Trop Med Int Health 2016;21(1):114-121. https://doi.org/10.1111/tmi.12624 [ Links ]
43. MRC-UNISA Crime, Violence and Injury Lead Programme. A profile of fatal injuries in Mpumalanga. 2009. http://www.mrc.ac.za/crime/fatal_inj08.PDF (accessed 15 March 2017). [ Links ]
44. MRC-UNISA Safety and Peace Promotion Research Unit. A profile of fatal injuries in Mpumalanga 2009. 2010. http://www.mrc.ac.za/crime/mpumalanga2009.pdf (accessed 15 March 2017). [ Links ]
45. MRC-UNISA Safety and Peace Promotion Research Unit. A profile of fatal injuries in Mpumalanga 2010. 2012. http://www.mrc.ac.za/crime/NIMSSMpumalanga2010.pdf (accessed 15 March 2017). [ Links ]
46. MRC-UNISA Safety and Peace Promotion Research Unit. A profile of fatal injuries in Mpumalanga 2011. 2013. http://www.mrc.ac.za/crime/NIMSS2011Mpumalanga.pdf (accessed 15 March 2017). [ Links ]
47. MRC-UNISA Safety and Peace Promotion Research Unit. A profile of fatal injuries in Gauteng 2009. 2010. http://www.mrc.ac.za/crime/gauteng_2009.PDF (accessed 15 March 2017). [ Links ]
48. MRC-UNISA Safety and Peace Promotion Research Unit. A profile of fatal injuries in Gauteng 2010. 2012. http://www.mrc.ac.za/crime/NIMSSGauteng2010.pdf (accessed 15 March 2017). [ Links ]
49. MRC-UNISA Safety and Peace Promotion Research Unit. A profile of fatal injuries in Gauteng 2011. 2013. http://www.mrc.ac.za/crime/NIMSS2011Gauteng.pdf (accessed 15 March 2017). [ Links ]
50. Meel BL. Erratum. Med Sci Law 2010;49(3):228. [ Links ]
51. Meel BL. Unnatural deaths among children in the Transkei region of South Africa. Med Sci Law 2008;48(3):232-236. https://doi.org/10.1258/rsmmsl.48.3.232 [ Links ]
52. Streatfield PK, Khan WA, Bhuiya A, et al Mortality from external causes in Africa and Asia: Evidence from INDEPTH health and demographic surveillance system sites. Glob Health Action 2014;7(1). https://doi.org/10.3402/gha.v7.25366 [ Links ]
53. Garrib A, Herbst AJ, Hosegood V, Newell M-L. Injury mortality in rural South Africa 2000 - 2007: Rates and associated factors. Trop Med Int Health 2011;16(4):439-446. https://doi.org/10.1111/j.1365- [ Links ]
54. Sewduth D. South Africa: The impact of the absence of legislation governing water safety and drowning prevention. In: World Water Safety Conference. 2007. https://www.ilsf.org/drowning-prevention/library/south-africa-impact-absence-legislation-governing-water-safety (accessed 15 January 2017). [ Links ]
55. Commission on Social Determinants of Health. Closing the gap in a generation: Health equity through action on the social determinants of health. Final Report of the Commission on Social Determinants of Health. Geneva: CSDH, 2008. [ Links ]
56. Peden AE, Franklin RC, Leggat PA. Fatal river drowning: The identification of research gaps through a systematic literature review. Inj Prev 2016;22(3):202-209. https://doi.org/10.1136/injuryprev-2015-041750 [ Links ]
57. Statistics South Africa. Living conditions of households in South Africa 2008/9. Statistical release P0310. Pretoria: Stats SA, 2011. http://www.statssa.gov.za/?page_id=1854&PPN=P0310&SCH=5017 (accessed 15 July 2017). [ Links ]
58. Christopher L, Naidoo N, Cousins D, Willoughby S. Cape Winelands District Municipality: Community based risk assessment comprehensive report. Cape Town: Cape Peninsula University of Technology, 2008. [ Links ]
59. Turner C, McClure R Age and gender differences in risk-taking behaviour as an explanation for high incidence of motor vehicle crashes as a driver in young males. Inj Control Saf Promot 2003;10(3):123-130. https://doi.org/10.1076/icsp.10.3.123.14560 [ Links ]
60. Moher D, Shamseer L, Clarke M, et al Preferred reporting items for systematic review and meta-analysis protocols (PRISMA-P) 2015 statement. Syst Rev 2015;4(1):1-9. https://doi.org/10.1186/2046-4053-4-1 [ Links ]
 Correspondence:
C J Saunders
c.saunders@uct.ac.za
Accepted 21 August 2017

