


Services on Demand
Article
 English (pdf)
 Article in xml format
 Article references
Indicators

Related links
-
 Cited by Google
 -
 Similars in Google
Share

 Permalink
SAMJ: South African Medical Journal
On-line version ISSN 2078-5135
Print version ISSN 0256-9574
SAMJ, S. Afr. med. j. vol.108 n.1 Pretoria Jan. 2018
http://dx.doi.org/10.7196/samj.2018.v108i1.12615
RESEARCH
Self-reported alcohol use and binge drinking in South Africa: Evidence from the National Income Dynamics Study, 2014 - 2015
N G VelliosI; C P van WalbeekII
IMSocSc (Economics); Southern Africa Labour and Development Research Unit, School of Economics, Faculty of Commerce, University of Cape Town, South Africa
IIPhD (Economics); Southern Africa Labour and Development Research Unit, School of Economics, Faculty of Commerce, University of Cape Town, South Africa
ABSTRACT
BACKGROUND: Although the South African (SA) government has implemented alcohol control measures, alcohol consumption remains high.
OBJECTIVES: To quantify the prevalence of self-reported current drinking and binge drinking in SA, and to determine important covariates.
METHODS: We used the 2014 - 2015 National Income Dynamics Study, a nationally representative dataset of just over 20 000 individuals aged >15 years. Multiple regression logit analyses were performed separately by gender for self-reported current drinkers (any amount), self-reported bingers as a proportion of drinkers, and self-reported bingers as a proportion of the total population. An individual was defined as a binge drinker if he/she reported consumption of >5 standard drinks on an average drinking day.
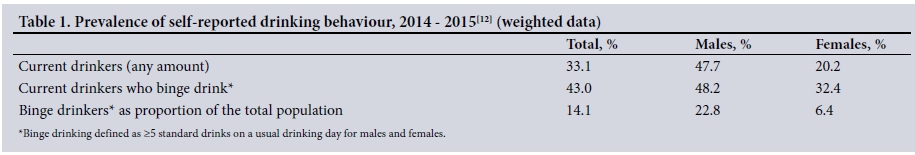
RESULTS: Current alcohol use (any amount) in 2014 - 2015 was reported by 33.1% of the population (47.7% males, 20.2% females). Of drinkers, 43.0% reported binge drinking (48.2% males, 32.4% females). The prevalence of self-reported binge drinking as a percentage of the total population was 14.1% (22.8% males, 6.4% females). Although black African males and females were less likely than white males and females to report drinking any amount, they were more likely to report binge drinking. Coloured (mixed race) females were more likely than black African females to report drinking any amount. Males and females who professed a religious affiliation were less likely than those who did not to report drinking any alcohol. The prevalence of self-reported binge drinking was highest among males and females aged 25 - 34 years. Smoking cigarettes substantially increased the likelihood of drinking any amount and of binge drinking for both genders.
CONCLUSION: In SA, one in three individuals reported drinking alcohol, while one in seven reported binge drinking on an average day on which alcohol was consumed. Strong, evidence-based policies are needed to reduce the detrimental effects of alcohol use.
Of the 48 countries in the World Health Organization (WHO) African region, South Africa (SA) had the highest per capita alcohol consumption (in terms of pure litres of alcohol) by individuals aged >15 years in 2010.[1] SA has a particularly harmful pattern of drinking. This indicator considers the manner and circumstances in which alcohol is consumed, rather than the prevalence of drinking. The quantity of alcohol consumed per occasion, festive drinking, the proportion of drinking events that end in drunkenness, the proportion of drinkers who drink daily, and the prevalence of drinking outside of mealtimes and in public places are considered in compiling the pattern-of-drinking score.[2] The WHO classifies countries' patterns of drinking on a five-point scale, where 1 indicates the least risky pattern of drinking and 5 the most risky pattern.[2] According to this scale, many Western European countries score a 1. At the other extreme, the Russian Federation and Ukraine are the only two countries that score a 5. Nine countries (SA, Belarus, Belize, Grenada, Guatemala, Kazakhstan, Moldova, Namibia and Zimbabwe) score a 4.[3]
Risky drinking is associated with many social ills. In 2000, alcohol-related homicide and violence, alcohol-related traffic accidents, alcohol-related disorders and fetal alcohol syndrome were responsible for 7.1% (95% confidence interval (CI) 6.6 - 7.5) of all deaths and 7% (95% CI 6.6 - 7.4) of disability-adjusted life-years lost in SA.[4] Alcohol harm is the fourth most important risk factor for premature death among the 17 risk factors identified by the South African National Burden of Disease Study.[5]
A 2009 review of prevalence data from five national and local surveys on alcohol use in SA from the previous 12 years found no significant increase in alcohol use.[6] A 2011 study using 2008 data showed that 27.7% of the SA population (41.5% of males and 17.1% of females) were current drinkers.[7] Past-month binge drinking (defined as >4 drinks for females and >5 for males) was reported by 9.6% of the population (17.1% of males and 3.8% of females).[7]
Given the stigma associated with alcohol use in many communities, and the well-known finding that people tend to under-report the consumption of goods and services that may be perceived as socially undesirable [8-10] it is likely that the prevalence and intensity of drinking is under-reported in surveys. This was recently investigated in a 2017 study where five nationally representative SA surveys were used to calculate the percentage of total alcohol use that is accounted for in self-reported surveys. [11] The authors found that survey data covered between 11.8% (95% CI 9.3 - 16.2) and 19.4% (95% CI 14.9 - 24.2) of total alcohol consumption, suggesting massive under-reporting of actual alcohol consumption by respondents in surveys.[11] Even though alcohol use is under-reported in survey data, estimates of self-reported current and binge drinking can assist policy makers to monitor trends in alcohol use, especially risky drinking.
Objectives
To provide recent estimates of self-reported current drinking and binge drinking using a large nationally representative household dataset and to identify some of the important covariates of alcohol consumption. Given the substantial under-reporting of alcohol use, the numbers presented should be seen as lower limits.
Methods
We used data from wave 4 of the 2014 - 2015 National Income Dynamics Study (NIDS).[12] NIDS is the first national cohort study in SA, focusing primarily on demographics, labour market participation, grants received, education and health. A stratified, two-stage cluster sample design was used in sampling the households included in the 2008 base wave.[13] The individuals interviewed in waves 2, 3 and 4 included both household members from the original sample and new individuals who had joined the original households.[14] Response rates in the NIDS survey were high - 81% of households were successfully interviewed in wave 4.
The NIDS contains questionnaires for households, adults (>15 years), children and proxies. We used only the responses from the adult questionnaire of wave 4 in this study (n=22 752). Since we were less interested in changes in binge drinking than in the prevalence of binge drinking, we did not exploit the panel aspect of the data, but rather treated wave 4 as a cross-sectional dataset.
Respondents classified themselves into one of the previously defined official SA population groups. African' refers to black people originating from the African continent, 'coloured', a uniquely defined SA group, includes people of mixed Khoi, San, Malay, European and black African ancestry, 'Asian' defines descendants of individuals from East Asia and the Indian subcontinent, and 'white' refers to Caucasians of European ancestry.[8]
Two survey questions were relevant to this study. The first was 'How often do you drink alcohol?' with options (i) Ί have never drunk alcohol', (ii) Ί no longer drink alcohol', (iii) Ί drink alcohol very rarely', (iv) 'Less than once a week', (v) 'On 1 or 2 days a week', (vi) 'On 3 or 4 days a week', (vii) 'On 5 or 6 days a week', and (viii) 'Every day'. A person was classified as a current drinker if he/she selected any option from (iii) through (viii). The second question was 'On a day that you have an alcoholic drink, how many standard drinks do you usually have?' (emphasis in original). The questionnaire defined a standard drink as 'a small glass of wine, a 330 mL can of regular beer, a tot of spirits, or a mixed drink'. The options were (i) '13 or more standard drinks', (ii) '9 to 12 standard drinks', (iii) '7 to 8 standard drinks', (iv) '5 to 6 standard drinks', (v) '3 or 4 standard drinks', and (vi) '1 or 2 standard drinks'. The questionnaire did not ask about the duration of a typical drinking session.
We present descriptive statistics, by demographic, socioeconomic and other indicators, of the proportion of adults (>15 years) who indicated consumption of any alcohol and adults who reported binge drinking. In order to compare the coverage rate of alcohol consumption reported in the NIDS data with official sales, we estimated the number of drinks consumed in the 2014/2015 tax year by dividing the excise tax revenue received by the government for each of the four categories of alcohol (namely beer, sorghum beer and sorghum flour, wine and other fermented beverages, and spirits) by the appropriate specific excise tax amount for that category of alcohol.[15] We subsequently estimated odds ratios (ORs) for males and females using multiple logit regressions, for any drinkers (relative to the total population), bingers (relative to any drinkers), and bingers (relative to the total population). The choice of covariates was based on previous studies and data availability. All results refer to self-reported consumption patterns of alcohol. Standard errors were clustered at the household level. All data were weighted and estimated using Stata/SE 14.1 (StataCorp, USA).
Results
In 2014 - 2015, 33.1% of SA adults aged >15 years (47.7% males, 20.2% females) reported consumption of any alcohol (Table 1). Of those who reported any alcohol consumption, 48.2% of males and 32.4% of females reported drinking >5 standard drinks per drinking day; 22.8% of adult males and 6.4% of adult females were therefore categorised as binge drinkers. Given under-reporting in survey data, these percentages should be seen as lower limits.
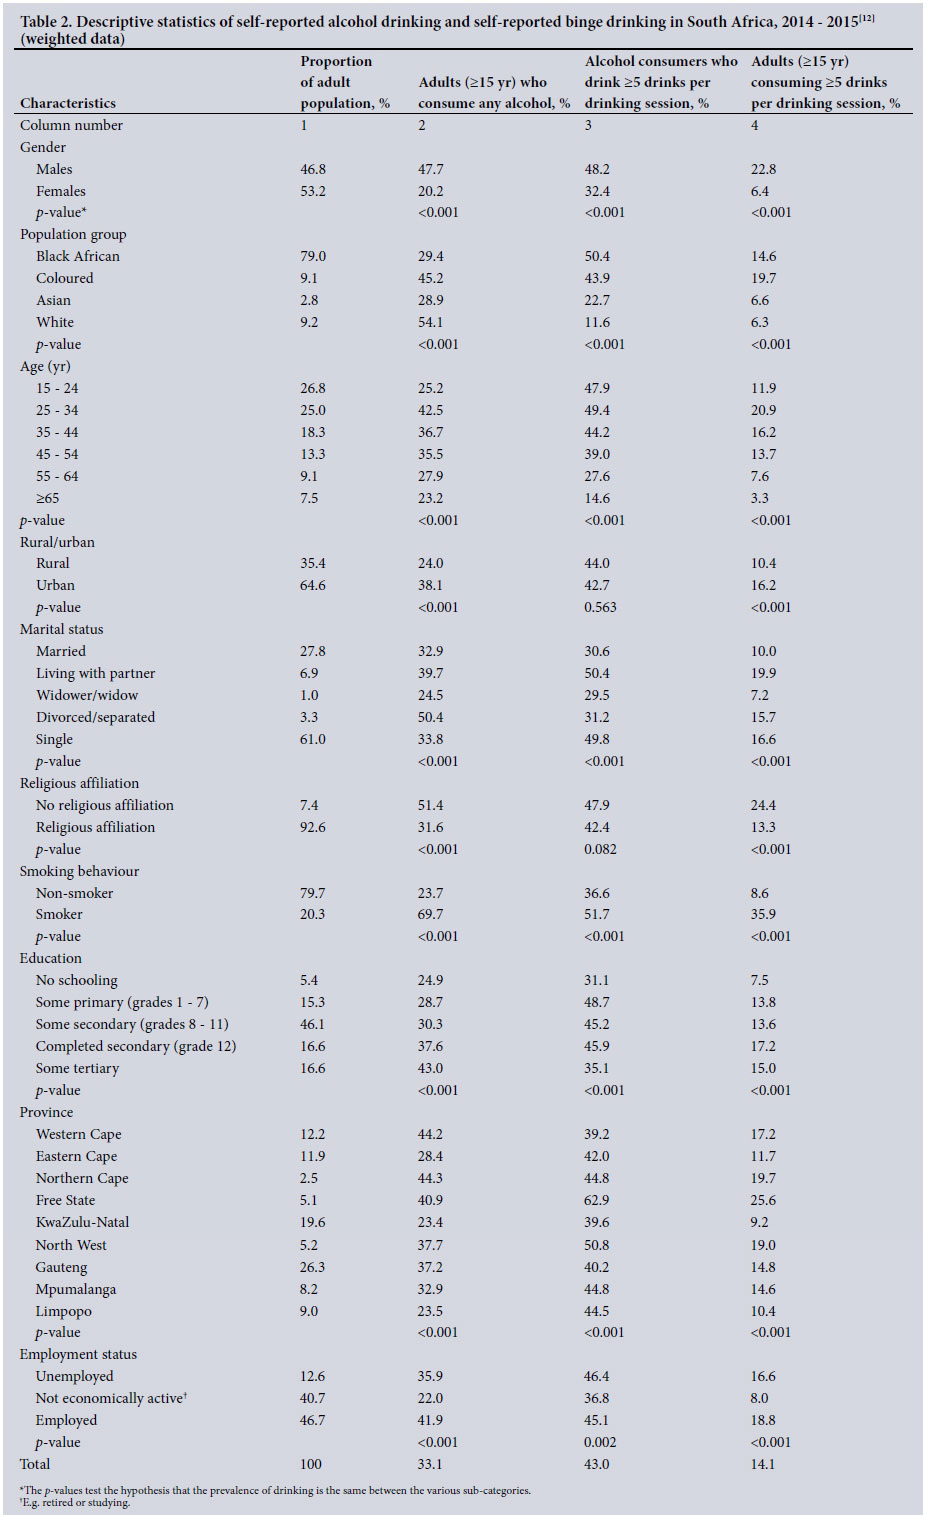
Descriptive statistics of adult (>15 years) drinkers of any amount and binge drinkers (>5 drinks) are shown in Table 2. Column 2 considers current drinkers as a percentage of the entire population, column 3 considers binge drinkers as a percentage of current drinkers, and column 4 considers binge drinkers as a percentage of the entire population.
Almost half of males and a fifth of females in SA reported current drinking (Table 2, column 2). Current drinking was highest among whites (54.1%) and coloureds (45.2%) and among individuals aged 25 - 34 years (42.5%). The prevalence of current drinking was higher in urban areas than in rural areas (38.1% and 24.0%, respectively). Half of adults who were divorced/separated reported current drinking. More than two-thirds of smokers reported current drinking. Those who were unemployed or employed reported higher prevalences of current drinking (35.9% and 41.9%, respectively) than those who were not economically active (e.g. retired or studying) (22.0%).
Although whites had the highest reported rate of current drinking (54.1%), whites had a lower rate of binge drinking among drinkers than all the other population groups (11.6%) (Table 2, column 3). Black Africans had the lowest rate of reported drinking (29.4%), but the highest rate of binge drinking among drinkers (50.4%). Asians had a low reported drinking prevalence (28.9%) and a relatively low prevalence of binge drinking among drinkers (22.7%). Males had a high prevalence of drinking (47.7%) and a high prevalence of binge drinking among drinkers (48.2%), while females were substantially lower on both measures (20.2% and 32.4%, respectively). The correlation coefficient between the prevalence percentages in columns 2 and 3 is 0.12 (p=0.465), which suggests that the prevalence of drinking (any amount) is uncorrelated with the prevalence of binge drinking among drinkers.
Binge drinking was more prevalent among black Africans (14.6%) and coloureds (19.7%) than among Asians (6.6%) and whites (6.3%) (Table 2, column 4). Binge drinking peaked in the age range 25 - 34 years (20.9%). The prevalence of binge drinking was higher among individuals living in urban areas (16.2%) than among those living in rural areas (10.4%). There were also significant differences in prevalence by marital/partnership status, those who were living with a partner, divorced/separated or single, binging more than those who were married or were widows/widowers. The rate of binge drinking was higher among those who professed no religious affiliation (24.4%) than among those who professed a religious affiliation (13.3%), and it was much higher among smokers (35.9%) than among non-smokers (8.6%). Individuals with no schooling had a lower rate of binge drinking than those with any level of education.
The total number of drinks reported in the 2014 - 2015 NIDS data was 4.8 billion (an average of 138 drinks per year per adult, irrespective of drinking status, and an average of 418 drinks per self-reported drinker). Specific excise tax revenue was collected from ~18.7 billion drinks (which indicates 534 drinks per adult, irrespective of drinking status) in the 2014/2015 tax year,[15] representing a coverage rate of 26%. Unrecorded consumption is estimated to account for 14% of total consumption (for the period 2009/2010).[16] Including this estimate of unrecorded consumption decreases the coverage rate to ~22%.
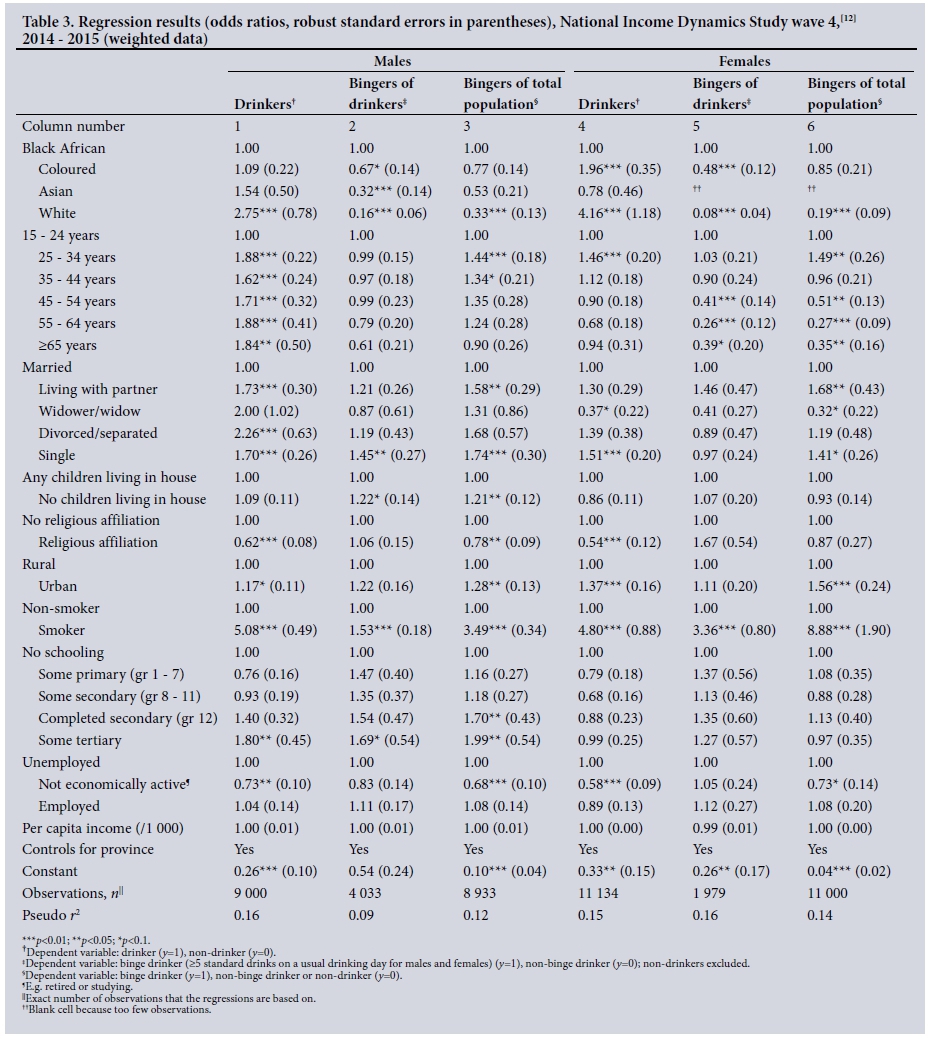
ORs, obtained from logit analyses, are shown in Table 3, which presents weighted regression results for males (columns 1 - 3) and females (columns 4 - 6), using different measures of alcohol consumption. Since the prevalence of drinking and binge drinking is much higher for males than for females, the regressions are estimated separately by gender. Columns 1 and 4 consider current drinking of any amount of alcohol, where y= 1 if the person is a drinker and y=0 if the person is a non-drinker. Columns 2 and 5 consider binge drinking among drinkers, where y=1 if the drinker is a binge drinker and y=0 if the drinker is a non-binge drinker (non-drinkers are excluded from the analysis). Columns 3 and 6 consider binge drinking in the entire population, where y= 1 if the person is a binge drinker and y=0 if the person is a non-binge drinker or a non-drinker. In the description of results, we primarily focus on drinking of any amount (columns 1 and 4) and bingers as a percentage of the total population (columns 3 and 6).
Although white males (OR 2.75; 95% CI 1.58 - 4.80) and females (OR 4.16; 2.39 - 7.25) were more likely to drink any amount of alcohol than black African males and females, white males (OR 0.33; 95% CI 0.16 - 0.69) and females (OR 0.19; 95% CI 0.07 - 0.48) were less likely to binge drink than black African males and females, respectively. Considering self-reported bingers as a percentage of self-reported drinkers (columns 2 and 5), coloured, Asian and white males and females were less likely to binge than black African males and females who drank. While there were no significant differences in bingers as a percentage of the total population (columns 3 and 6) between black Africans, coloureds and Asians, white males and females binged significantly less.
Compared with males aged 15 - 24 years, males >24 years of age were more likely to drink any amount (column 1). Females aged 25 - 34 years were most likely to drink any amount (column 4). As a percentage of the total population, individuals aged 25 - 34 years were more likely to binge than those aged 15 - 24 years, for both males (OR 1.44; 95% CI 1.13 - 1.85) and females (OR 1.49; 95% CI 1.06 - 2.08). Binge drinking behaviour for older males did not differ significantly from that for males aged 15 - 24, but older females, especially beyond age 45, were significantly less likely to binge than females aged 15 - 24.
Compared with males who were married, males living with a partner (OR 1.58; 95% CI 1.09 - 2.27) or who were single (OR 1.74; 95% CI 1.24 - 2.43) were more likely to binge drink. Compared with females who were married, females living with a partner (OR 1.68; 95% CI 1.01 - 2.79) or who were single (OR 1.41; 95% CI 0.99 - 2.02) were more likely to binge drink, a similar result to that for males.
There was no statistical difference in male and female prevalence of any drinking according to whether there were children living in the house or not (columns 1 and 4). Having children in the house slightly increased the probability of binge drinking for males (OR 1.21; 95% CI 1.00 - 1.47), but not for females (OR 0.93; 95% CI 0.69 - 1.26).
Males who professed a religious affiliation were less likely to drink (OR 0.62; 95% CI 0.48 - 0.79) or to binge (OR 0.78; 95% CI 0.61 - 0.99) than males who professed no religious affiliation. The effect was similar for females, but was not significant for binge drinking. Living in an urban area as opposed to a rural area increased the probability of binge drinking for both males (OR 1.28; 95% CI 1.04 -1.56) and females (OR 1.56; 95% CI 1.15 - 2.11). Cigarette smoking was associated with a substantially greater likelihood of drinking and binge drinking for both males and females.
The impact of schooling on the likelihood of binge drinking differed substantially between males and females. The level of education did not appear to influence binge drinking among females, but did have an effect on males. Males with some tertiary education were more likely than males with no education to drink any amount, while males who had completed secondary school (OR 1.70; 95% CI 1.04 - 2.80) and had at least some tertiary education (OR 1.99; 05% CI 1.17 - 3.38) were more likely to binge than males with no schooling.
Males and females who were not economically active (e.g. retired or studying) were less likely to drink any amount (OR 0.73; 95% CI 0.56 - 0.95 for males and OR 0.58; 95% CI 0.44 - 0.78 for females) or to binge drink (OR 0.68; 95% CI 0.51 - 0.91 for males and OR 0.73; 95% CI 0.51 - 1.06 for females) than those who were unemployed. The likelihood of employed males and females binge drinking was similar to that of unemployed males and females, respectively. Differences in per capita income did not explain differences in the likelihood of drinking any amount or of binge drinking.
Discussion
Our current self-reported drinking estimate of 33.1% in 2014 - 2015 is higher than estimates (also age >15 years) reported in the 1998 Demographic and Health Survey (DHS)[8] of ~31%, and 27.7% in the South African National HIV, Incidence, Behaviour and Communication (SABSSM) survey in 2008.[7] We found that 48.2% of male drinkers reported binge drinking, while 32.4% of female drinkers reported binge drinking. Data from the 1998 DHS study revealed that rates of risky drinking were very similar for males and females, with one-third of current drinkers drinking at risky levels over weekends.[8] The difference in the estimates is likely to be due to the way we defined binge drinking for females (>5 drinks) compared with the 1998 DHS study, which used >3 drinks, as well as the difference in timing of drinking (usual drinking v. weekend drinking).[8] The 2008 SABSSM data reveal that 9.6% of the population reported binge drinking (defined as consuming >4 drinks for females and >5 drinks for males). [7] This estimate is very similar to NIDS 2010 - 2011,[7] where self-reported binge drinking was estimated at 10.6% (females 3.5%, males 19.1%). The NIDS 2010 -2011 prevalence data align closely to the WHO prevalence data for individuals aged >15 years in 2010 (10.4% of the population; females 3.7%, males 17.8%).[1] Whereas we defined binge drinking as >5 drinks per average drinking day, the WHO defined binge drinking as having consumed at least 60 g of pure alcohol on at least one occasion in the past 30 days. Although the definitions are different, the WHO estimate of 60 g of pure alcohol translates to about five 330 mL beers.
The SA government is expected to receive about ZAR20.8 billion in excise taxes on alcohol products in 2016/2017 (which is ~1.8% of total tax revenue).[15] Revenue received through alcohol excise taxes needs to be viewed in conjunction with costs resulting from alcohol harm. The economic costs in 2001 were estimated at ~1% of gross domestic product (GDP).[18] A 2009 study found that alcohol-related costs incurred by government (not society as a whole) were more than alcohol-related government revenue (excise tax and value-added tax (VAT)).[19] A 2014 study provides two estimates of the cost of alcohol as a percentage of the 2009 GDP: (i) the tangible, financial costs (e.g. healthcare, crime response, road traffic accidents) of harmful alcohol use is ~1.6% of GDP; and (ii) including the intangible costs (e.g. premature mortality and morbidity, absenteeism) increases the costs to 10 - 12% of GDP.[16,20] The manufacturing and retail of liquor was estimated to contribute 3.9% to 2009 GDP,[16] which is considerably lower than the more encompassing cost estimate of 10 - 12% of GDP. To address high rates of alcohol consumption and the associated economic and social costs to society, public health advocates in SA have been supporting higher excise taxes since as far back as 1995, arguing that the affordability of alcohol products is a strong determinant of alcohol use.[21] During the past two decades there have been substantial activities by the SA government aimed at preventing substance misuse, including public education campaigns aimed at pregnant women, drunk driving and the introduction of warning labels on containers on the harmful effects of alcohol.[22]
By 2002, National Treasury set the total consumption tax burden (excise duties plus VAT) as a percentage of the weighted average retail selling price for wine, clear beer and spirits at 23%, 33%, and 43%, respectively.[23] The targeted tax burdens were increased to 35% for beer and 48% for spirits in 2012,[23] in the same year that the Minister of Health introduced the Control of Marketing of Alcoholic Beverages Draft Bill, which among other things would ban alcohol advertising. Although the SA Cabinet approved the Bill in September 2013, the alcohol industry successfully opposed the bill. In September 2016, the Minister of Trade and Industry tabled the National Liquor Policy Review, which outlines policy recommendations to be used in the draft Liquor Bill.[24] The policy recommendations in the review include, among others, advertising restrictions and increasing the legal drinking age from 18 to 21 years.
Policies and interventions aimed at reducing alcohol consumption, and especially risky consumption, are outlined in the 2014 WHO Global Status Report on Alcohol and Health.[1] These include pricing policies, marketing of alcoholic beverages and drink-driving policies and countermeasures. Since binge drinking varies substantially across demographic and socioeconomic groups, binge-drinking reduction policies should focus on groups with a high prevalence of binge drinking: males, black Africans, individuals aged 25 - 34 years, singles and people living with partners. There is very strong evidence that smokers are substantially more likely to binge drink than non-smokers. Although we do not claim causality, measures that reduce smoking prevalence may have the additional benefit of reducing the prevalence of binge drinking.
Our estimates are likely to be lower bounds for several reasons. First, whether a person consumes alcohol or not, and the quantity consumed, is self-reported in the NIDS questionnaire. It is well known that people under-report the purchase of socially undesirable goods.[8-10] A comparison between aggregate alcohol consumption, as reported in NIDS, and tax-based sales data indicates that NIDS reported only ~22% of total recorded and unrecorded consumption in 2014 - 2015. A 2017 study found that NIDS 2012 covered 14.6% (95% CI 11.3 - 20.3) of the total alcohol used per capita.[11] This suggests that either alcohol abstention is substantially less than reported, or that consumption per drinker (on average) is much more than reported, or both. Further research on how to deal with underreporting in the SA context is required.
Second, there may be under-reporting between different groups of people, since stigma is an important factor that is likely to affect the reporting of undesirable behaviours among some groups more than others. For example, women may be less likely to report drinking and binge drinking than men. Similarly, people with a religious affiliation may be less likely to report drinking and binge drinking compared with those who do not have a religious affiliation. On the other hand, self-reported smokers could be impervious to reporting drinking or binge drinking.
Third, there may be gender differences in alcohol metabolism[25] that we did not account for. Many academic studies classify binge drinking as >4 drinks per drinking session for females and >5 drinks for males.[26] The way the options for intensity of drinking are grouped in the NIDS questionnaire (1 - 2 drinks, 3 - 4 drinks, 5 - 6 drinks, etc.) makes it impossible to differentiate meaningfully between male and female binge drinking.
Fourth, our definition of binge drinking encompasses only the quantity consumed, and not the time frame of consumption or the time period of past binge-drinking episodes. A 2009 review of the scientific binge-drinking literature concludes that a definition of binge drinking should include all three factors.[26] In large household surveys, where alcohol use is not the main variable of interest, encompassing all three factors is often difficult. The NIDS questionnaire asks about the intensity of drinking as number of drinks per day, rather than per session. It is possible that some respondents could drink >5 drinks over the length of the day, which would not necessarily be classified as binge drinking.
Fifth, it is possible that consumers of 'non-commercial' forms of alcohol (home brews and other traditional forms of alcohol) do not classify themselves as drinkers, since a 'standard drink' in the NIDS questionnaire refers to wine, beer, spirits and mixed drinks.
Conclusion
The alcohol industry argues that it does not encourage harmful use of alcohol.[27] Since a very large proportion of alcohol consumed in SA is consumed hazardously, with associated detrimental consequences, the alcohol industry's statements sound hollow, since they depend on these drinkers for profits. The public, and the public health community in particular, should support efforts by the ministries of Trade and Industry and Health to implement strong, evidence-based policies that reduce the detrimental effects of alcohol use.
Acknowledgements. We thank Dr Hana Ross for comments on an earlier draft of this article.
Author contributions. NV conducted the statistical analyses and wrote the first draft of the manuscript. CvW contributed to the analysis of the results and writing the manuscript. Both authors approved the final manuscript.
Funding. We thank the University of Cape Town for funding this research.
Conflicts of interest. None.
References
1. World Health Organization. Global Status Report on Alcohol and Health 2014. http://www.who.int/substance_abuse/publications/global_alcohol_report/en/ (accessed 27 November 2017). [ Links ]
2. World Health Organization. Global Health Observatory (GHO) data: Patterns of drinking score. Situation and trends 2017. http://www.who.int/gho/alcohol/consumption_patterns/drinking_score_patterns_text/en/ (accessed 27 November 2017). [ Links ]
3. World Health Organization. Patterns of Drinking Score (Age 15+), 2010. Geneva: WHO, 2014. http://gamapserver.who.int/mapLibrary/Files/Maps/Global_drinking_scores_2010.png (accessed 27 November 2017). [ Links ]
4. Schneider M, Norman R, Parry C, Bradshaw D, Plüddemann A, and the South African Comparative Risk Assessment Collaborating Group. Estimating the burden of disease attributable to alcohol use in South Africa in 2000. S Afr Med J 2007;97(8):664-672. [ Links ]
5. Norman R, Bradshaw D, Schneider M, et al. A comparative risk assessment for South Africa in 2000: Towards promoting health and preventing disease. S Afr Med J 2007;97(8):637-641. [ Links ]
6. Peltzer K, Ramlagan S. Alcohol use trends in South Africa. J Soc Sci 2009;18(1):1-12. http://citeseerx.ist.psu.edu/viewdoc/download?doi=10.1.1.598.8726&rep=rep1&type=pdf (accessed 30 November 2017). [ Links ]
7. Peltzer K, Davids A, Njuho P. Alcohol use and problem drinking in South Africa: Findings from a national population-based survey. Afr J Psychiatry 2011;14(1):30-37. https://doi.org/10.4314/ajpsy.v14i1.65466 [ Links ]
8. Parry CDH, Plüddemann A, Steyn K, Bradshaw D, Norman R, Laubscher R. Alcohol use in South Africa: Findings from the first Demographic and Health Survey (1998). J Stud Alcohol 2005;66(1):91-97. https://doi.org/10.15288/jsa.2005.66.91 [ Links ]
9. Livingston M, Callinan S. Underreporting in alcohol surveys: Whose drinking is underestimated? J Stud Alcohol Drugs 2015;76(1):158-164. https://doi.org/10.15288/jsad.2015.76.158 [ Links ]
10. Stockwell T, Donath S, Cooper-Stanbury M, Chikritzhs T, Catalano P, Mateo C. Under-reporting of alcohol consumption in household surveys: A comparison of quantity-frequency, graduated-frequency and recent recall. Addiction 2004;99(8):1024-1033. https://doi.org/10.1111/j.1360-0443.2004.00815.x [ Links ]
11. Probst C, Shuper PA, Rehm J. Coverage of alcohol consumption by national surveys in South Africa. Addiction 2017;112(4):705-710. https://doi.org/10.1111/add.13692 [ Links ]
12. Southern Africa Labour and Development Research Unit. National Income Dynamics Study 2014 - 2015, Wave 4. Version 1.1. Cape Town: SALDRU, 2016. [ Links ]
13. Leibbrandt M, Woolard I, de Villiers L. National Income Dynamic Study. Methodology: Report on NIDS Wave 1. Technical Paper No. 1. Cape Town: Southern Africa Labour and Development Research Unit, 2009. [ Links ]
14. Chinhema M, Brophy T, Brown M, Leibbrandt M, Mlatsheni C, Woolard I. National Income Dynamics Study Panel User Manual. Cape Town: Southern Africa Labour and Development Research Unit, 2016. [ Links ]
15. Republic of South Africa: National Treasury. 2016 Budget Review: Statistical Tables. http://www.treasury.gov.za/documents/national%20budget/2016/review (accessed 8 November 2016). [ Links ]
16. Truen S, Ramkolowan Y, Corrigall J, Matzopoulos R. Baseline Study of the Liquor Industry Including the Impact of the National Liquor Act 59 of 2003. Pretoria: Department of Trade and Industry, 2011. [ Links ]
17. Southern Africa Labour and Development Research Unit. National Income Dynamics Study 2010 - 2011, Wave 2. Version 3.1. Cape Town: SALDRU, 2016. [ Links ]
18. Parry CDH, Myers B, Thiede M. The case for an increased tax on alcohol in South Africa. S Afr J Econ 2003;71(2):137-145. https://doi.org/10.1111/j.1813-6982.2003.tb01308.x [ Links ]
19. Budlender D. National and Provincial Government Spending and Revenue Related to Alcohol Abuse. Johannesburg: Soul City Development Institute, 2009. [ Links ]
20. Matzopoulos RG, Truen S, Bowman B, Corrigall J. The cost of harmful alcohol use in South Africa. S Afr Med J 2014;104(2):127-132. https://doi.org/10.7196/SAMJ.7644 [ Links ]
21. Yach D, Parry CDH, Harrison S. Prospects for substance abuse control in South Africa. Addiction 1995;90(10):1293-1296. [ Links ]
22. Parry CDH. South Africa: Alcohol today. Addiction 2005;100(4):426-429. https://doi.org/10.1111/j.1360-0443.2005.01015.x [ Links ]
23. Republic of South Africa: National Treasury. A Review of the Taxation of Alcoholic Beverages in South Africa: A Discussion Document. May 2014. http://www.treasury.gov.za/public%20comments/Alc/Alcohol%20Tax%20Review%20-%20May%202014%20Discussion%20Paper.pdf (accessed 30 November 2017). [ Links ]
24. Republic of South Africa: Department of Trade and Industry. Final Liquor Policy Paper: National Liquor Policy Review. August 2016. Pretoria: Republic of South Africa. https://www.thedti.gov.za/news2016/NLP.pdf (accessed 27 November 2017). [ Links ]
25. Wechsler H, Dowdall GW, Davenport A, Rimm EB. A gender-specific measure of binge drinking among college students. Am J Public Health 1995;85(7):982-985. [ Links ]
26. Courtney K, Polich J. Binge drinking in young adults: Data, definitions, and determinants. Psychol Bull 2009;135(1):142-156. https://doi.org/10.1037/a0014414 [ Links ]
27. Industry Association for Responsible Alcohol Use. Alcohol Limits and Unit Guidelines. http://www.ara.co.za/alcohol-limits-and-unit-guidelines/ (accessed 1 February 2017). [ Links ]
 Correspondence:
N G Vellios
nicole.vellios@uct.ac.za
Accepted 14 August 2017

