


Servicios Personalizados
Articulo
 Inglés (pdf)
 Articulo en XML
 Referencias del artículo
Indicadores

Links relacionados
-
 Citado por Google
 -
 Similares en Google
Compartir

 Permalink
SAMJ: South African Medical Journal
versión On-line ISSN 2078-5135
versión impresa ISSN 0256-9574
SAMJ, S. Afr. med. j. vol.107 no.6 Pretoria jun. 2017
http://dx.doi.org/10.7196/samj.2017.v107i6.11311
RESEARCH
Analysis of HIV disease burden by calculating the percentages of patients with CD4 counts <100 cells/μL across 52 districts reveals hot spots for intensified commitment to programmatic support
L M CoetzeeI; N CassimII; D K GlencrossIII
IPhD; National Priority Programme, National Health Laboratory Service, Johannesburg, South Africa; and Department of Molecular Medicine and Haematology, Faculty of Health Sciences, University of the Witwatersrand, Johannesburg, South Africa
IIMPH; National Priority Programme, National Health Laboratory Service, Johannesburg, South Africa; and Department of Molecular Medicine and Haematology, Faculty of Health Sciences, University of the Witwatersrand, Johannesburg, South Africa
IIIMB BCh, MMed; National Priority Programme, National Health Laboratory Service, Johannesburg, South Africa; and Department of Molecular Medicine and Haematology, Faculty of Health Sciences, University of the Witwatersrand, Johannesburg, South Africa
ABSTRACT
BACKGROUND. South Africa (SA)'s Comprehensive HIV and AIDS Care, Management and Treatment (CCMT) programme has reduced new HIV infections and HIV-related deaths. In spite of progress made, 11.2% of South Africans (4.02 million) were living with HIV in 2015.
OBJECTIVE. The National Health Laboratory Service (NHLS) in SA performs CD4 testing in support of the CCMT programme and collates data through the NHLS Corporate Data Warehouse. The objective of this study was to assess the distribution of CD4 counts <100 cell/μL (defining severely immunosuppressed HIV-positive patients) and >500 cells/μL (as an HIV-positive 'wellness' indicator).
METHODS. CD4 data were extracted for the financial years 2010/11 and 2014/15, according to the district where the test was ordered, for predefined CD4 ranges. National and provincial averages of CD4 counts <100 and >500 cell/μL were calculated. Data were analysed using Stata 12 and mapping was done with ArcGIS software, reporting percentages of CD4 counts <100 and >500 cell/μL by district.
RESULTS. The national average percentage of patients with CD4 counts <100 cell/μL showed a marked decrease (by 22%) over the 5-year study period, with a concurrent increase in CD4 counts >500 cell/μL (by 57%). District-by-district analysis showed that in 2010/11, 44/52 districts had >10% of CD4 samples with counts <100 cell/μL, decreasing to only 17/52 districts by 2014/15. Overall, districts in the Western Cape and KwaZulu-Natal had the lowest percentages of CD4 counts <100 cell/μL, as well as the highest percentages of counts >500 cell/μL. In contrast, in 2014/15, the highest percentages of CD4 counts <100 cell/μL were noted in the West Rand (Gauteng), Vhembe (Limpopo) and Nelson Mandela Bay (Eastern Cape) districts, where the lowest percentages of counts >500 cell/μL were also noted.
CONCLUSIONS. The percentages of CD4 counts <100 cell/μL highlighted here reveal districts with positive change suggestive of programmatic improvements, and also highlight districts requiring local interventions to achieve the UNAIDS/SA National Department of Health 90-90-90 HIV treatment goals. The study further underscores the value of using NHLS laboratory data, an underutilised national resource, to leverage laboratory test data to enable a more comprehensive understanding of programme-specific health indicators.
In 2004, the National Department of Health (NDoH) rolled out South Africa (SA)'s first Comprehensive HIV and AIDS Care, Management and Treatment (CCMT) programme.[1] The initial CCMT was later extended in the HIV, AIDS and sexually transmitted diseases national strategic plan (NSP) to reduce HIV incidence by 50% during the period 2007 - 2011.[2] Later, NSP goals for 2012 - 2016 aimed to expand access to treatment, care and support further to 80% of eligible patients, while reducing the rate of new HIV infections and HIV-associated maternal mortality by 50% and new HIV infections in children by 90%.[3] The CCMT programme has grown considerably since 2004, with declines in new HIV infections reported.[3-5] However, recent data reveal that despite these advances, SA still has a considerable burden of HIV disease and other challenges to overcome.
Since the inception of the CCMT programme, absolute CD4 T-lymphocyte counts have been used to establish baseline levels of immunosuppression in HIV-positive patients and identify those eligible for initiation onto antiretroviral therapy (ART), as well as for laboratory monitoring of patients on ART.[6] In SA, a network of ~60 CD4 testing facilities in the National Health Laboratory Service (NHLS) have provided ~3.6 million CD4 tests per annum to >3 000 NDoH health facilities (hospitals and clinics). These data sets are collated nationally through the NHLS Corporate Data Warehouse (CDW).
During the period 2004 - 2015, the NHLS provided >32 million CD4 tests in support of the CCMT programme. Cumulative and annualised CD4 laboratory test volume data linked to the districts/ provinces where the tests were ordered (but not necessarily where patients live) provide important insights into and information about the relative HIV disease burden. Marked immunosuppression can be characterised by CD4 counts <100 cell/μL, and HIV-positive patient 'wellness' by the distribution of CD4 counts >500 cell/μL.
Objective
To document the distribution and percentages of severely immunosuppressed HIV-positive patients, as well as the percentages of recovering and treated patients with CD4 counts >500 cell/μL, overall across SA's nine provinces and in the context of the country's 52 districts.
Methods
CD4 data were extracted from the NHLS CDW to establish a baseline (2010/11) with which 2014/15 outcomes could be compared. Data were analysed using Microsoft Excel and Stata 12. National averages were established for CD4 ranges <100 cell/μL, 100 - 200, 201 - 350 and 351 - 500 cell/μL and >500 cell/μL, after which the percentages of results with reported CD4 counts <100 and >500 cell/μL, categorised by province and district for the the years 2010/11 and 2014/15, were assessed. District boundaries data were downloaded from the demarcation board web page (http://www.demarcation.org.za) and uploaded to ArcGIS software (version 10.2, Esri, USA) to enable district boundaries to be defined, including the highlighting of prioritised National Health Insurance (NHI) pilot districts. Health district percentages for CD4 counts <100 and >500 cell/μL were captured in ArcGIS and subsequently mapped using quintile graduated colour function in ArcGIS to define bins by district. Bins defined included seven for CD4 <100 cell/μL (2010/11) with a range of 7.7 - 19.9% in increments of 2%. For 2014/15 data, similar bins were created for a range of 6.3 - 13.9%, also in increments of 2%. For CD4 counts >500 cell/μL (2014/15), only four bins were created for a range of 30.5 - 50% with increments of ~5%.
Results
National, provincial and district averages were compiled from 3.5 million data points in 2010/11 and 3.9 million data points in 2014/15.
Analysis of percentages of patients within specified CD4 ranges, overall and across provinces
The percentages of patients with CD4 counts in the ranges of <100, 101 - 200, 201 - 350, 351 - 500 and >500 cell/μL in the financial years 2010/11 and 2014/15 are set out in Table 1, according to province. Percentages of patients with higher CD4 counts increased across the country from 2010/11 to 2014/15, with higher percentages of patients with CD4 counts >350 or >500 cell/μL noted across all provinces. Overall there was less evidence of immunosuppression (CD4 count <100 cell/μL) by 2014/15; in 2010/11 the national average was noted to be 12.47% v. an average of 9.69% by 2014/15 (a 22% decrease over 4 years). In this latter group, the percentage of patients with CD4 counts between 100 and 200 cell/μL decreased by 50% between 2010/11 and 2014/15, while a 25% reduction was noted in the percentage of patients whose CD4 counts fell into the 'severely immunosuppressed' group, i.e. <100 cell/μL (Table 1). The national percentage of patients with a CD4 count >500 cell/μL increased dramatically by 57% from an average of 23.19% in 2010/11 to 36.47% in 2014/15. Further details on the changes at provincial level can be seen in Table 1.
Analysis of percentages of patients with CD4 counts <100 cell/μL, by district
The percentages of immunosuppressed patients (CD4 count <100 cell/μL) are shown in the context of 52 districts for the years 2010/11 and 2014/15 in Figs 1 and 2 (A and B).
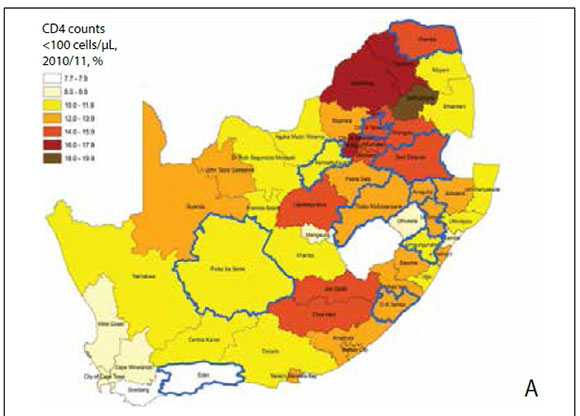
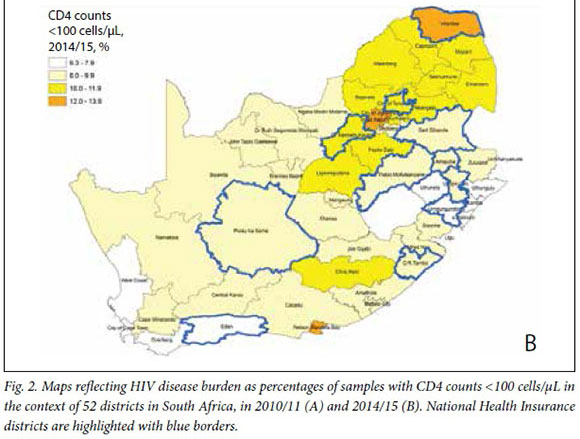
Fig. 1 shows the distribution of percentages of CD4 counts <100 cell/μL, per district grouped by province for 2010/11. These data sets indicate that almost half the districts (24/52) were above the national average of 12.3%. Twenty-nine of 52 districts had a figure of >12% in the same time frame, with the highest district percentage noted (Greater Sekhukune in Limpopo Province (LP)) at 18.9%. Although the national average percentage of CD4 counts <100 cells/ μL fell to 9.7% in 2014/15, only 26 of 52 districts managed to reduce the percentage of immunosuppressed patients. This leaves 17 districts with a percentage higher than the national average. The highest percentage noted in 2014/15 in a district was 13.0% (West Rand, Gauteng Province (GP)). A better appreciation of the decrease in the district average percentages of CD4 counts <100 cell/μL over time can be seen in Fig. 2 (A and B), where colour-graded bins are used.
In 2010/11, the majority of districts (44/52) had individual average percentages of CD4 counts <100 cell/μL that exceeded 10%. Greater Sekhukune district had the highest percentage of CD4 counts <100 cell/μL, exceeding 18%, while three districts had a percentage of >16% (West Rand in GP, Capricorn and Waterberg in LP). Ten more districts had percentages of CD4 counts <100 cells/ μL between 14% and 16% (these were Chris Hani and Joe Gqabi districts in the Eastern Cape (EC), Lejweleputswa in the Free State (FS), City of Johannesburg Metro, Tshwane Metro, Ekurhuleni Metro and Sedibeng districts in GP, Vhembe in LP and Gert Sibande and Nkangala in Mpumalanga Province (MP)). Higher percentages of CD4 counts <100 cell/μL were not limited to rural areas, but were noted in urban areas as well, with figures of 12 - 14% and 10 - 12% being noted in 15 districts each (Fig. 1 (insert) and Fig. 2 (A)). The districts with the lowest percentages of CD4 counts <100 cell/μL in 2010/11 were Eden and Overberg in the Western Cape (WC) at 7.7% and 7.9%, respectively. Six districts had an average percentage of <10%; these included districts from WC (Cape Winelands, Cape Town Metro, West Coast), KZN (Ilembe and Uthukela) and FS (Motheo).
A marked overall positive shift was noted by 2014/15, when no district had a >14% average percentage of CD4 counts <100 cell/μL (Figs 1 and 2 (B)). Overall, districts with a percentage of CD4 counts <100 cells/μL >10% had reduced substantially, declining four-fold over 5 years from 44/52 (84.6%) in 2010/11 to 17/52 (33%) by 2014/15 (Fig. 2 (B)). There was a dramatic increase in the number of districts with a lower percentage of CD4 counts <100 cell/μL (<10%), from 8 in 2010/11 to 35 in 2014/15. Only four districts had percentages of CD4 counts <100 cell/μL between 12% and 14% in 2014/15, including West Rand, City of Johannesburg, Nelson Mandela Bay (EC) and Vhembe (Table 1 and Fig. 2 (B)). Thirteen districts had an average percentage of CD4 counts <100 cell/μL between 10% and 12% in 2014/15, including four districts in LP (Capricorn, Greather Sekhukhune, Mopani, Waterberg), three in GP (Bojanala, Tshwane Metro, Ekurhuleni), two each in MP (Ehlanzeni, Nkangala) and North West (NW) (Dr Kenneth Kaunda and Fezile Dabi) and one each in FS (Lejweleputswa) and EC (Chris Hani). By 2014/15, KZN had the lowest recorded percentage of CD4 counts <100 cell/μL, noted in Umkhanyakude district (5.4%). The majority of KZN districts (9/11) showed a remarkable decrease in percentages of CD4 counts <100 cell/μL, with a mean of 7.3% in 2014/15.
Although there is evidence that some districts had a marked reduction in the percentage of immunosuppressed patients over the 5 years since 2010, 32/52 districts showed only modest change over the same period, reducing by 1 - 4 percentage points (see Fig. 1 for details). By 2014/15, the largest reduction in the percentage of CD4 counts <100 cell/μL was noted in Greater Sekhukhune district in LP, where a 7 percentage points reduction occurred, from 18.9% to 11.8%. Other districts that showed reductions of >5 percentage points included five in KZN (Ethekwini Metro, Umkhanyakude, Ugu, Nkangala, Zululand), two in EC (Joe Gqabi and OR Tambo), GP (Sedibeng and Ekurhuleni) and LP (Waterberg and Capricorn), and one in MP (Gert Sibande). Five districts showed no change in the percentage of CD4 counts <100 cell/μL over time, i.e. Nelson Mandela Bay in EC, Motheo in FS, Dr Kenneth Kaunda in NW and Eden and Overberg in WC. A negative trend was documented for a single district, Mopani, in LP (minus 1 percentage point).
NHI pilot districts (n=11) are highlighted in Fig. 2 (A and B). In 2010/11, the majority of NHI districts had a percentage of CD4 counts <100 cell/μL exceeding 14%. By 2014/15, only Vhembe district showed an average percentage of CD4 counts <100 cell/μL >12%, with the rest reporting percentages <10%. A sub-analysis of NHI v. non-NHI districts showed similar responses over time.
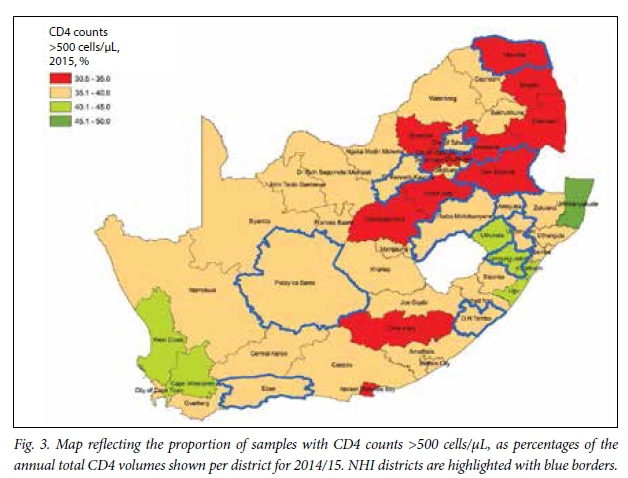
Analysis of percentages of patients with CD4 counts >500 cell/μL, by district
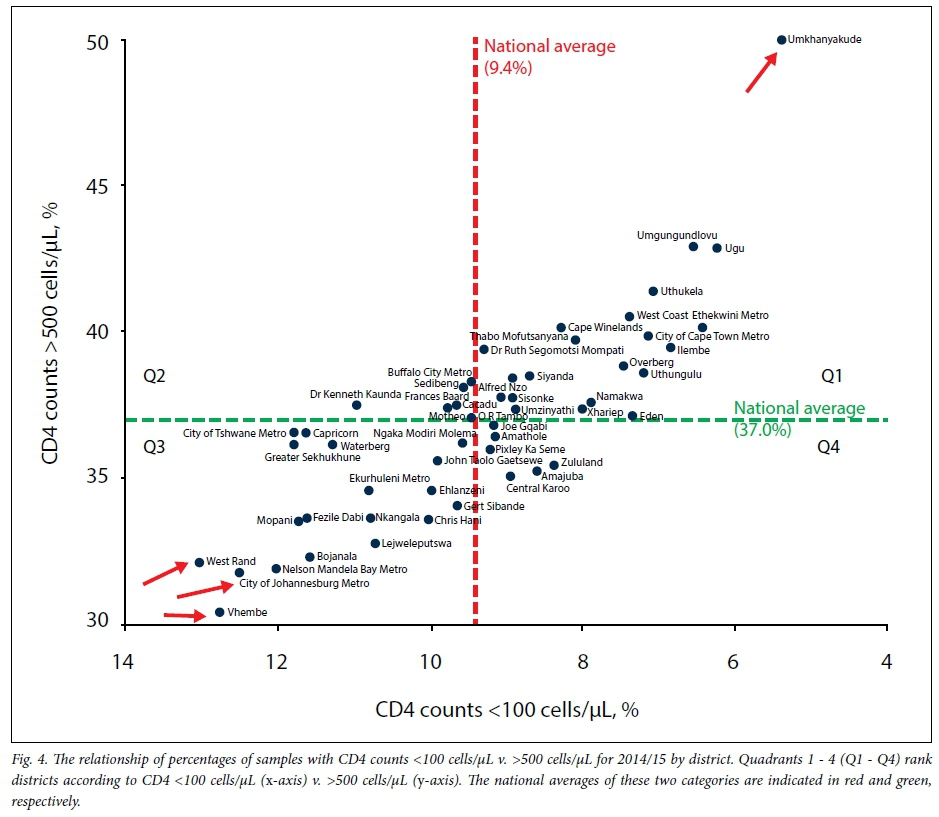
Fig. 3 shows the percentages of patients with CD4 counts >500 cells/ μL, by district. Generally, districts with lower percentages of CD4 counts <100 cell/μL matched with districts with higher percentages of counts >500 cell/μL, both for 2010/11 and 2014/15 (Figs 3 and 4), i.e. an inverse relationship was noted. Correlation of regression analysis confirmed a strong significant relationship overall between CD4 counts <100 and >500 cell/μL (Spearman non-parametric r=-0.82; p<0.0001). As with the CD4 <100 cell/μL data, there is evidence of changes in the percentages of CD4 counts >500 cell/μL over the 5-year study period, with the highest proportions of counts >500 cell/μL noted in KZN and WC during 2014/15. However, not all districts showed the same inverse relationship between a decline in CD4 counts <100 cell/μL and an increase in counts >500 cells/ Fig. 4 incorporates this information in the context of the percentage of severely immunosuppressed patients (CD4 <100 cell/μL) to reveal the relationship between the percentage of CD4 counts >500 cell/μL (y-axis) and the percentage of counts <100 cell/μL (x-axis), highlighting districts that are currently below the national average reported for 2014/15.
Fig. 4 illustrates the relationship between the percentage of CD4 counts <100 cell/μL and that of counts >500 cell/μL in quadrants. The best-case scenario (Q1) represents districts where the percentage of CD4 counts >500 cell/μL was highest and the percentage of counts <100 cell/μL lowest. Districts that fulfil these criteria are nine in KZN, five in WC, two in FS, three in EC, two in NC and one in NW. Q2 represents districts where the percentage of CD4 counts <100 cells/μL was above the national average, but in contrast the percentage of counts >500 was also above the national average, including Buffalo City Metro (EC), Sedibeng (GP), Mangaung (FS), Frances Baard (NC) and Dr Kenneth Kaunda (NW). Q3 represents districts with the highest percentage of CD4 counts <100 cell/μL and the lowest percentage of counts >500 cell/μL and includes 19 districts in seven provinces. These are LP (n=5 districts), GP (n=4), MP (n=3), NW (n=2), FS (n=2), EC (n=2) and NC (n=1). Most of the Q3 districts were in LP, including Vhembe (CD4 count <100 cell/μL 12.8% and >500 cell/μL 30.5%), Greater Sekhukhune (11.8% and 36.2%, respectively), Capricorn (11.6% and 36.5%), Mopani (11.6% and 33.6%) and Waterberg (11.3% and 36.2%) (Fig. 4). This quadrant Q4 represents districts where the percentage of CD4 counts <100 cell/μL was below the national average, but the percentage of counts >500 cell/μL was also below the national average (not in keeping with the national trend). Q2 and Q4 therefore represent districts where the inverse relationship between CD4 <100 and CD4 >500 cell/μL does not follow overall national trends, indicating a higher percentage of immunosuppression and/or a lower percentage of CD4 values exceeding the 500 cell/μL level (considered to imply wellness).
Discussion
Travis et al.[7] explain that in the attempt to overcome health systems constraints necessary to achieve the Millennium Development Goals, focus on disease priority in the health context has left key areas such as workforce, drug supply, health financing and information systems under-resourced. They further describe the lack of generation and use of information for monitoring systems as a major barrier to solving priority health problems.[7] SA is unique in having the CDW held by the NHLS, which enables both collection and use of vital laboratory-related health data.
SA is one of the first countries in Africa to adopt universal test and treat (UTT) in accordance with the 2016 World Health Organization guidelines[8] and the UNAIDS 90-90-90 targets.[9] In a recent NDoH circular[10] (September 2016), eligibility criteria for UTT clearly state that baseline monitoring of the CD4 count is the 'key factor in determining fast-tracking and prioritization of patients with CD4 <350 and CD4 <200 cells/μl into care', and eligibility for opportunistic infection prophylaxis is defined as a CD4 count of <200 cell/μL and that for cryptococcal disease screening at <100 cell/μL.[6,10] The NHLS CDW is an invaluable health data repository that can be unlocked to provide information to address gaps and guide interventions in local health services. The data presented in this article specifically focus on the group of HIV-positive patients with CD4 counts of <100 cell/μL, mapped by district to indicate severe immunosuppression.
Since 2004, the NDoH has achieved progress in the CCMT programme. Initial reports revealed an average CD4 count of individuals presenting for HIV counselling and treatment (HCT) of <200 cell/μL,[4] but counts have risen steadily since commencement of the programme, increasing to 271 cell/μL in 2014.[11]m line with these trends, data reported here confirm an overall decrease in the proportion of patients with a CD4 count <100 cell/μL of 2.8 percentage points (effective as a 22% improvement) over 5 years. However, despite this progress, -11% of all patients nationally still had CD4 counts <200 cell/μL in 2014/15 (Table 1). This is in line with other published data indicating that a significant number of patients continue to initiate ART late,[11] despite changes in threshold guidelines and scaling up of national HIV programmes. Additional data reported here further confirm a significant increase in the percentage of patients with CD4 counts >500 cell/μL (13% increase), with an overall inverse relationship to the decline in counts <100 cell/μL. CD4 group intervals in the <200, <350 and <500 cell/μL showed a similar trend, i.e. an increase in the percentages of patients with higher CD4 counts, from 2010/11 to 2014/15 (Table 1 and Fig. 1). This may reflect better uptake, earlier enrolment into care and patients responding better to treatment, although it was out of the scope of this study to report on programmatic parameters.
Analysing data at a district level (Figs 1 - 4) added important information that was masked by national or provincial averages reported. Firstly, district-by-district performance was not consistent during the 5-year study period, but this could perhaps be expected, considering that the same performance cannot be expected across all districts or provinces. This approach allows for localised response and customisation of HIV programmes[7] and maintaining focus by targeting local needs while still taking into consideration the broader health system context. In some districts there was a dramatic reduction in the percentage of patients with CD4 counts <100 cells/μL, i.e. 5 - 7 percentage point reductions were noted in 8/52 districts (including Greater Sekhukhune at 7.1%). Gert Sibande and Ethekwini also showed a 5 - 6 percentage point reduction in CD4 counts <100 cells/ μL. Three districts (Eden, Dr Kenneth Kaunda and Mopani), however, showed an increase in the percentage of counts <100 cell/μL during the 5-year period. Although most districts matched the CD4 <100 cell/μL average of the parent province, in others a marked contrast to provincial percentages was noted, emphasising the importance of contextual interpretation of local HCT and CCMT initiatives (Figs 1 - 4) in any given district. This highlights the importance of the inclusion of district and sub-district data to successfully identify target problem areas. Underlying reasons/ root causes can then be identified and addressed (Figs 1 and 4), including HCT, earlier enrolment into care and long-term therapy compliance. Fig. 4 shows the areas where focused attention is urgently required (Q3), in which the burden of severely immunosuppressed patients (CD4 <100 cell/μL) is highest. Districts that reported no change in the percentage of immunosuppressed patients (CD4 <100 cell/μL) over the 5-year period were Dr Kenneth Kaunda (NW), Eden (WC), Mangaung (FS), Nelson Mandela Bay Metro (EC) and Overberg (WC). In the Alfred Nzo district, the percentage of immunosuppressed patients (CD4 <100 cell/μL) increased from 10.8 to 11.6% across the 5-year period. In contrast, the dramatic changes seen in the remote district of Umkhanyakude in KZN (where the percentage of patients with CD4 counts <100 cell/μL was only 5.4% and the percentage of patients with counts >500 cell/μL >50% in 2014/15) should serve as a beacon of hope and testimony to the success of local/provincial CCMT initiatives.[12,13]
While district and provincial NDoH activities have played a significant role, SA health and related statistics for 2016 may offer insights into other factors that could have contributed to the dramatic improvement noted in districts across KZN, such as that in Umkhanyakude.[13] This 2016 report reveals that, although KZN has the highest antenatal prevalence of HIV infection in SA, the province also has the highest number of hospital beds and medical personnel as well as the highest spend on laboratory servicing.[13] Furthermore, KZN is one of two provinces with the highest HIV testing coverage, KZN and LP reporting that 39.0% and 40.8%, respectively, of adults aged 15 - 49 years were tested for HIV in 2013/14.[13] The data reported in our article correspond to those of Day et al.[13]in the South African Health Review in that KZN districts had the lowest percentages of CD4 counts <100 cell/μL. Day et al.[13] also reported that the two provinces with the poorest HIV testing coverage were FS and GP, at 26.2% and 23.3%, respectively; our findings are consistent with these figures in that GP had two of three districts with the highest percentages of immunosuppressed patients (CD4 <100 cells/ μL) and the lowest percentages of patients with CD4 counts >500 cells/ μL nationwide. A platform for sharing lessons learned and systems used in districts that have shown improvement over time could offer help and insights to assist translation of best practices into other districts where little improvement has been noted. Such an approach could improve outcomes in districts where a marked burden of disease still exists, and facilitate their alignment with the NSP and the UNAIDS/NDoH 90-90-90 strategy.[3,9]
Finally, the data presented here and outcomes noted at district level, highlighting those areas across SA where the percentage of patients with CD4 counts <100 cell/μL is high, should be considered in the light of CD4 categories[10] currently used by the NDoH to prioritise or fast-track patients into care. HIV patients with CD4 counts <100 cell/μL are severely immunosuppressed, urgently requiring enrolment into care. Through the national NHLS CD4 service, this group is currently automatically screened for the presence of cryptococcal antigen (CrAg)[6,10] to identify HIVpositive immunosuppressed patients with early cryptococcal disease before they progress to meningitis. The CrAg results are reported to health facilities via the NHLS HIV dashboard on a weekly basis as 'results for action' (RFA),[14] to enable prompt patient follow-up and antifungal treatment; immediate enrolment onto ART should also be a priority. The NHLS RFA system also enables health facilities to be notified about HIV-positive patients with CD4 counts <100 cells/ μL, who in our opinion should be considered as medical emergencies requiring urgent enrolment onto ART. Formal acknowledgement of this specific category of patients by the NDoH is required to enable action at clinic level and ultrafast tracking of this group of patients into care.
Study limitations
The CD4 laboratory data used in this study do not distinguish between first-ever and follow-up CD4 tests, and may include both ART-naive patients and those already on ART, or patients with higher CD4 counts not yet enrolled onto ART. The study did not investigate underlying factors that could contribute to higher percentages of CD4 counts <100 cell/μL (and lower percentages of counts >500 cell/μL), such as CD4 recovery over time, adherence or retention in HIV care. The study merely aimed to report the distribution of immunosuppressed individuals across 52 districts in an effort to identify hot spots for programmatic intervention, and it was not in its scope to assess cohorts.
Conclusions
The collation of NHLS CDW CD4 data provided important insights into HIV disease burden, i.e. immunosuppression (CD4 <100 cells/ μL) and patients with CD4 counts >500 cell/μL. The latter could indicate baseline results for patients not yet on treatment (see 'Study limitations') or response to ART. Analysis of CD4 counts <100 cells/ μL overall, together with a review of the percentages of patients with counts >500 cell/μL, by province and by district, showed a positive shift over time (a decrease in the percentage of CD4 counts <100 cells/ μL and an increase in counts >500 cell/μL) and identified districts that may require urgent interventions to lower their percentage of counts <100 cell/μL. The study underscores the value of using laboratory data for identifying areas with higher priority needs for programmatic intervention.
Acknowledgements. The authors thank the NHLS CDW staff for help and support in extracting data. DKG thanks the NRF for Incentive Funding for Rated Researchers.
Author contributions. LMC: co-developed and executed research, reviewed the first draft, data analysis assistance and editorial input; NC: codeveloped and executed research, reviewed the first draft, data analysis assistance and editorial input; DKG: conceptualised idea for research, editorial input and project leader/budget owner, final submitted draft.
Funding. None.
Conflicts of interest. None.
References
1. National Department of Health, South Africa. Operational Plan for Comprehensive HIV and AIDS Care, Management and Treatment for South Africa. Pretoria: NDoH, 2003. [ Links ]
2. National Department of Health, South Africa. HIV & AIDS and STI Strategic Plan for South Africa: 2007-2011. Pretoria: NDoH, 2007. [ Links ]
3. National Department of Health, South Africa. National Strategic Plan for HIV, TB and STI*s 2012-2016. Pretoria: Joint Committee on HIV and AIDS, NDoH, 2012. [ Links ]
4. National Department of Health, South Africa. Progress Update on the National Strategic Plan for HIV, TB and STIs 2012-2016. Pretoria: Joint Committee on HIV and AIDS, NDoH, 2013. [ Links ]
5. Rehle TM, Hallett TB, Shisana O, et al. A decline in new HIV infections in South Africa: Estimating HIV incidence from three national HIV surveys in 2002, 2005 and 2008. PLoS One 2010;5(6):e11094. http://dx.doi.org/10.1371/journal.pone.0011094 [ Links ]
6. National Department of Health, South Africa. National Consolidated Guidelines for the Prevention of Mother-to-child Transmission of HIV (PMTCT) and the Management of HIV in Children, Adolescents and Adults. Pretoria: NDoH, 2015. [ Links ]
7. Travis P, Bennett S, Haines A, et al. Overcoming health-systems constraints to achieve the Millennium Development Goals. Lancet 2004;364(9437):900-906. http://dx.doi.org/10.1016/S0140-6736(04)16987-0 [ Links ]
8. World Health Organization. Consolidated Guidelines on the Use of Antiretroviral Drugs for Treating and Preventing HIV Infection: Recommendations for a Public Health Approach. Geneva: WHO, 2016. [ Links ]
9. Joint United Nations Programme on HIV/AIDS (UNAIDS). 90-90-90 - an Ambitious Treatment Target to Help End the AIDS Epidemic. Geneva: UNAIDS, 2014. [ Links ]
10. National Department of Health, South Africa. Implementation of the Universal Test and Treat Strategy for HIV Positive Patients and Differentiated Care for Stable Patients. Pretoria: Joint Committee on HIV and AIDS, NDoH, 2016. [ Links ]
11. Kufa T. Evaluation of programmes to support adherence during all stages of the HIV care cascade in South Africa: Determinants of CD4 immune recovery among individuals on antiretroviral therapy in South Africa: A national analysis. 2016. https://doi.org/10.13140/RG.2.2.14702.41287 [ Links ]
12. National Department of Health, South Africa. Health Indicators Update: Antiretroviral Indicators. Pretoria: Directorate: Monitoring and Evaluation, NDoH, 2013:35. [ Links ]
13. Day C, Gray A. South African Health Review 2016: Health and Related Indicators. Annual Report. Durban: Health Systems Trust, 2016. [ Links ]
14. Carmona S. Groundbreaking data system set to accelerate HIV/Aids elimination in SA [press release]. Johannesburg: Right to Care, 2016. http://www.righttocare.org/press-releases/groundbreaking-data-system-set-to-accelerate-hivaids-elimination-in-sa/ (accessed 23 May 2017). [ Links ]
 Correspondence:
D K Glencross
debbie.glencross@nhls.ac.za
Accepted 8 March 2017

