


Services on Demand
Article
 English (pdf)
 Article in xml format
 Article references
Indicators

Related links
-
 Cited by Google
 -
 Similars in Google
Share

 Permalink
SAMJ: South African Medical Journal
On-line version ISSN 2078-5135
Print version ISSN 0256-9574
SAMJ, S. Afr. med. j. vol.107 n.4 Pretoria Apr. 2017
http://dx.doi.org/10.7196/samj.2017.v107i4.11438
RESEARCH
Available data sources for monitoring non-communicable diseases and their risk factors in South Africa
M WandaiI; J Aagaard-HansenII; C DayIII; B SartoriusIV; K J HofmanV
IBSc, MSc; Health Systems Trust, Johannesburg, South Africa
IIMD, MPH; Steno Diabetes Centre, Gentofte, Denmark; and South African Medical Research Council Developmental Pathways for Health Research Unit, Department of Paediatrics, Faculty of Health Sciences, University of the Witwatersrand, Johannesburg, South Africa
IIIBSc (Pharm), MMedSci; Health Systems Trust, Johannesburg, South Africa
IVBSc, BSc Hons, MSc, PhD; Discipline of Public Health Medicine, School of Nursing and Public Health, College of Health Sciences, Nelson R Mandela School of Medicine, University of KwaZulu-Natal, Durban; and South African Medical Research Council/University of KwaZulu-Natal Gastrointestinal Research Centre, Durban, South Africa
VMB BCh, FAAP; PRICELESS SA, School of Public Health, Faculty of Health Sciences, University of the Witwatersrand, Johannesburg, South Africa
ABSTRACT
BACKGROUND. Health information systems for monitoring chronic non-communicable diseases (NCDs) in South Africa (SA) are relatively less advanced than those for infectious diseases (particularly tuberculosis and HIV) and for maternal and child health. NCDs are now the largest cause of premature mortality owing to exposure to risk factors arising from obesity that include physical inactivity and accessible, cheap but unhealthy diets. The National Strategic Plan for the Prevention and Control of Non-Communicable Diseases 2013 - 17 developed by the SA National Department of Health outlines targets and monitoring priorities.
OBJECTIVES. To assess data sources relevant for monitoring NCDs and their risk factors by identifying the strengths and weaknesses, including usability and availability, of surveys and routine systems focusing at national and certain sub-national levels.
METHODS. Publicly available survey and routine data sources were assessed for variables collected, their characteristics, frequency of data collection, geographical coverage and data availability.
RESULTS. Survey data sources were found to be quite different in the way data variables are collected, their geographical coverage and also availability, while the main weakness of routine data sources was poor quality of data.
CONCLUSIONS. To provide a sound basis for monitoring progress of NCDs and related risk factors, we recommend harmonising and strengthening available SA data sources in terms of data quality, definitions, categories used, timeliness, disease coverage and biomarker measurement.
The importance of quality data[1,2] in health service delivery, programme planning, monitoring and evaluation is widely acknow-ledged.[3-7] The concept of data availability for decision-making has been promoted with a view to improving evidence-based public health programming for better health outcomes.[8.9] Quality data are also critical to the pathway to universal health coverage, enabling better understanding of budget allocation in the organisation of health services, including an integrated approach for those in need. A World Health Organization (WHO) report showed that in many low- and middle-income countries (LMICs), data for monitoring indicators of major non-communicable diseases (NCDs) such as cancer are at best only partially quantifiable.[10]
In South Africa (SA), health information systems for major infectious diseases function relatively better than those for NCDs. The electronic tuberculosis register (ETR.net), designed for TB/HIV surveillance, programme monitoring and evaluation, and the Three Interlinked Electronic Registers (TIER.net), which keep patient records on HIV and tuberculosis (TB), while not perfect, have been implemented by most public health facilities.[11] In contrast, in common with those of most LMICs, SA data sources for monitoring NCDs are rudimentary.[12,13] These diseases were previously mostly associated with affluence in LMICs,[14] so they received little attention, leading to this paucity of reliable health information systems for NCDs. The High-Level Meeting of the 66th session of the United Nations General Assembly in 2011 and the WHO's Global Action Plan for the Prevention and Control of Noncommunicable Diseases 2013 - 2020,[15] which had as one of six objectives 'to monitor the trends and determinants of noncommunicable diseases and evaluate progress in their prevention and control', combined to give new momentum to NCD monitoring efforts.
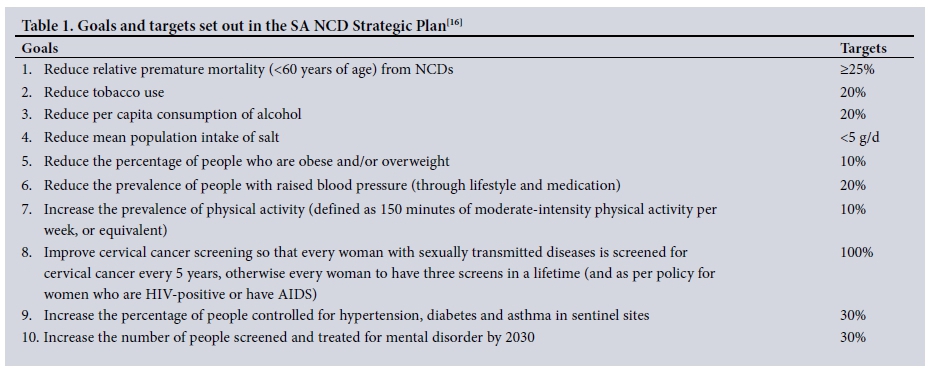
In 2012, the SA National Department of Health (NDoH) developed a National Strategic Plan for the Prevention and Control of Non-Communicable Diseases 2013 - 17[16] (NCD Strategic Plan) followed by the 2015 Strategy for the Prevention and Control of Obesity in South Africa 2015 - 2020.[17] The NCD Strategic Plan outlined priority health conditions and set out goals and targets to be achieved by the year 2020 for various indicators (Table 1).
In terms of NCD surveillance, evaluation and research, the plan stated, 'South Africa has many elements that can be developed further into a strategic surveillance system for NCDs ... a comprehensive surveillance system needs to be developed for NCDs'.[16] Although the plan mentioned a number of data sources to monitor NCDs and their risk factors, it also noted that current data are inadequate for this purpose.
Objectives
To describe data sources currently available to monitor NCD prevalence, risk conditions and risk factors in SA; to assess the range, quality, regularity and comparability of results from these sources and identify gaps; and to suggest improvements to data producers.
Methods
We identified available data sources to help monitor the status of the NCD Strategic Plan's 10 targets for prevention and control of NCDs and their main risk conditions and factors in the adult (>15 years) population at national and certain sub-national levels. Two types of sources were used, surveys and routine surveillance systems. The surveys included in the study were purposefully selected based on the authors' knowledge of the data sources with national coverage in the SA public health environment. The assessment involved a comparison of the surveys' NCD-related data attributes by reviewing details contained in documentations including surveys, questionnaires, planning documents and information in various reports. Of particular importance was how questions were phrased in the questionnaires; how the relevant biomarkers were measured; data categorisation and gaps; frequency of the survey; and time taken to carry out the survey, release the results and make the data publicly available. Result-based information derived from the data and from the relevant reports was also compared and contrasted. Routine data sources were assessed based on the data attributes in the relevant system and also as reported.
The surveys used were the South African Demographic and Health Survey!18,191 (SADHS), the South African National Health and Nutrition Examination Survey1201 (SANHANES), the General Household Survey (GHS) and the National Income Dynamics Study (NiDS). Routine surveillance systems used were the District Health Information System (DHIS), cause-of-death (CoD) vital registration data and the National Cancer Registry. To assess comparability of survey data, analysed and reported, results for variables defined similarly in three 2012 surveys (SANHANES, NiDS and GHS) were compared to find out whether the results from these different sources were similar. NiDS and GHS results for this purpose were extracted from a report[21] analysing trends of NCDs and related risk factors. SANHANES data were extracted from its published report.[20]
We differentiated risk conditions (hypertension, obesity and dyslipidaemia) from lifestyle risk factors (physical inactivity, unhealthy diets, alcohol use and smoking) by considering them as possible intermediary consequences of the latter in the causal pathway leading to NCDs.
Findings and discussion of data sources
Regularity and availability of survey data
The SADHS is the oldest of the four surveys, but has only been conducted twice (in 1998 and 2003), while SANHANES, the main focus of which is NCDs and their risk factors, has been conducted once so far (in 2011). The SANHANES report was released about a year after data collection. The GHS, produced by Statistics South Africa (Stats SA), is the most regular of the four survey data sources, having been conducted annually since 2002. The last two surveys (2013 and 2014) ran from January to December, whereas previous surveys took about 2 months between July and September. Reports, including a health section showing numbers of those self-reporting diagnosis of specific NCDs, are usually released between 6 and 12 months later.
NiDS, a biennial survey, has been carried out since 2008 by the Southern Africa Labour and Development Research Unit at the University of Cape Town. As part of its main focus on tracking poverty transition among South Africans, NiDS collects health-related data that can be useful for monitoring NCDs and their risk factors. This panel survey has completed and availed to the public four waves of data so far, with the fifth having been implemented in 2016.
Availability of survey data to researchers and users varies. Data for the 1998 SADHS, NiDS and GHS are available to registered users from the DataFirst website (http://datafirst.uct.ac.za/dataportal/index.php/catalog/central). The 1998 SADHS data are also available at the programme's website (http://dhsprogram.com/data/dataset/South-Africa_Standard-DHS_1998.cfm?flag=0), while the GHS data are also publicly available from the Stats SA data repository (http:// interactive.statssa.gov.za:8282/webview/). SADHS 2003 data are not available in any public data repository. According to policy of the Human Sciences Research Council, the main implementer of SANHANES, data are made available to the public 24 months after a project's official completion. However, at the time of writing in 2017, data from SANHANES 2012 were not yet available on their data service website (http://datacuration.hsrc.ac.za/search/browse).
The lowest sub-national level at which data are available in SADHS, SANHANES and GHS is the province, whereas NiDS is stratified to district level, though the data producer has warned that small sample sizes may contribute to inaccuracies in inferences at provincial and district levels.
Data on NCDs and related risk factors from the four surveys are characterised by being based either on self-report or by actual measurement of the relevant biomarker.
Self-reported survey data
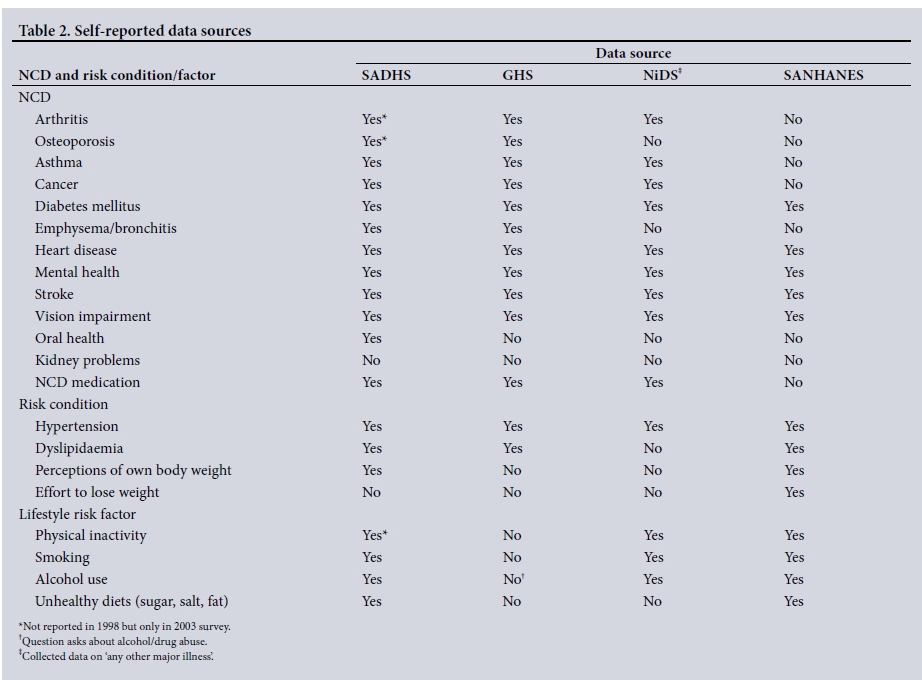
In the four surveys, respondents were asked whether they had ever been informed by a doctor, nurse or healthcare worker at a clinic or hospital that they had a specific NCD. SADHS and GHS have collected the most comprehensive self-reported data on NCDs, while SANHANES and SADHS have collected data on risk conditions and factors more comprehensively. Kidney diseases are not considered by any survey. Oral health is covered only by SADHS, which devotes a complete chapter to it. Both GHS and NiDS collect data on eye health by asking whether the respondent uses eyeglasses, spectacles or contact lenses (Table 2).
In SADHS and SANHANES, respondents were also asked to indicate whether any blood relatives (parent, sibling or child) had specific NCDs, with no indication of whether responses were based on information from a health practitioner. SANHANES further asked respondents their reason for seeking care at their last visit to a healthcare facility and whether this included monitoring for NCD vital signs.
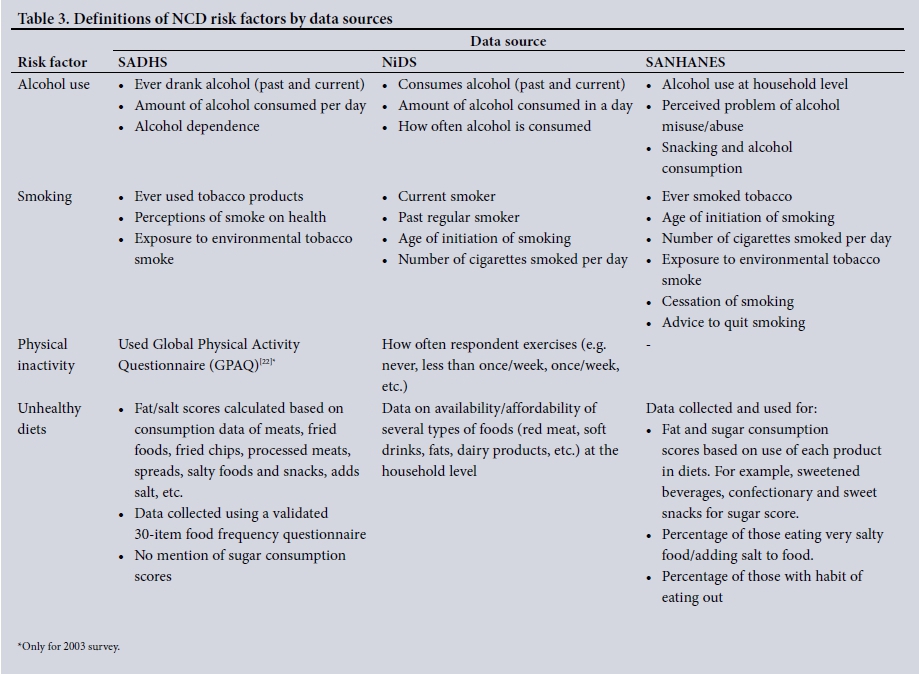
Data characteristics for risk factors are summarised in Table 3. Of the four surveys, only GHS does not collect data on any risk factors. Similar data on alcohol use (past and current use as well as the amount of alcohol consumed) were collected by SADHS and SANHANES, allowing data on levels of alcohol consumed (harmful/ risky/heavy/episodic/binge/moderate) to be monitored over time and across surveys. In SANHANES, data on alcohol use are reported only at household level, where the head or senior member of the household reports on whether any member of the household consumes alcohol.
Data on smoking behaviour collected in these three surveys were similar, although SANHANES considered more behavioural aspects than the other two surveys. SADHS and SANHANES also reported on respondents' exposure to environmental smoke. SADHS and NiDS collected data on the number of cigarettes smoked per day, which is useful for categorising levels (light or heavy) of exposure and their effect on NCDs and risk conditions.
Among the risk factors, collection of data related to physical inactivity was most variable across the surveys. Although SADHS 1998 did not include data on physical activity/fitness, this was reported in its 2003 survey.'191 SANHANES measured physical activity through a cardiovascular fitness test rather than self-reporting. NiDS respondents were individually asked 'How regularly do you exercise?' Responses were categorised by exercise events per week, which may have excluded many respondents who were physically active according to definition of physical activity.[22,23]
Anthropometry and other biomarkers
The most comprehensive surveys in terms of taking measurements necessary for monitoring NCD risk conditions and factors have been SANHANES, followed by SADHS (Table 4). SANHANES has been unique in using cotinine measurement and cardiovascular fitness tests, a 3-minute step test conducted by a doctor, but these were limited to individuals between the ages of 18 and 40 years, excluding much of the adult population. NiDS has not measured two vital biomarkers, blood sugar and cholesterol. GHS has not measured any biomarkers.
Comparability of results from survey data
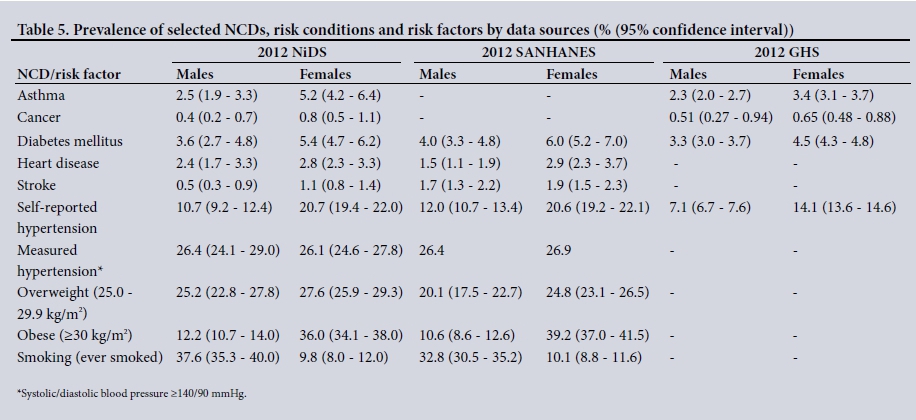
Table 5 shows results from three surveys conducted in 2012 where NCD and risk factor questions were framed similarly. Although results differed in some instances (for example, between NiDS and SANHANES for stroke), they are similar for most NCDs and risk factors. GHS estimates tend to be lower than SANHANES and NiDS, probably because the GHS sample size is much larger. Measurement-based results (blood pressure (BP) and anthropometrics) are similar for NiDS and SANHANES. The BP measurements in both surveys were done after few minutes' rest and seated, using an Automatic Digital BP Monitor (model M7 (NiDS) and model M2 (SANHANES), Omron Healthcare, USA). Measurements in NiDS were recorded twice, while in SANHANES a second measurement was only taken if the first BP was 140/90 mmHg or higher. This implies that if the surveys are designed with adequate representation of all important variables, results would be similar, leading to similar conclusions and actionable recommendations. Measured prevalence of hypertension is on average about twice as high as reported prevalence (Table 5), confirming the well-known bias that self-reporting disease prevalence results in substantial under-reporting. Female prevalences are also generally higher than those for males (apart from smoking), possibly reflecting real differences, as has been reported elsewhere, for example for obesity. [20,21,24] The smaller difference between self-reported and measured hypertension for females could, however, also indicate that women are more likely to utilise healthcare screening services.
Routine data sources
DHIS
The most detailed level of DHIS data availability at the time of the study was the health facility, where routine data are collected at the point of healthcare provision, recorded in health facility registers, then collated and submitted as aggregated data elements to subdistrict or district health information offices. DHIS data elements relating to NCDs and so relevant to the NCD Strategic Plan include diabetes, hypertension, mental health, dental health, cataract surgery and cervical cancer screening. For diabetes and hypertension, DHIS records those diagnosed and undergoing treatment for the first time as proxies for the incidences of these two conditions. Records for diabetes and mental health are disaggregated into age groups below and above 18 years. Mental health data include both outpatient and inpatient clients. The number of patients admitted involuntarily to psychiatric hospitals is also reported.
Recorded dental counts include all individual clients attending the facility who received dental or oral health services. Total cataract surgeries represent the number of eyes (not persons) on which cataract surgery was performed. The only DHIS data element relating to cancer is the number of cervical cancer screening tests that involve a cervical (Pap) smear or visual inspection with acetic acid for women aged >30 years.
The current DHIS (version 1.4) data are not population based but represent primarily those who seek care in the public sector. No patient-level data are recorded in the system, although this is expected to change with the introduction of the web-based version of DHIS (DHIS2), which allows collection of patient-level data such as age, gender and other variables, and will accept data from a variety of mobile apps, including those from community-based workers doing screening and household assessments. While this version of the DHIS has been rolled out nationally in some countries in Africa, Latin America and Asia, it is only partially applied, and only so for some programmes in SA. The major weakness of the current DHIS data is errors and non-recording by some facilities contributing to poor quality.[25]
The National Cancer Registry
The National Cancer Registry, maintained by the National Institute for Occupational Health, records cancer cases diagnosed in pathology laboratories (both public and private) nationwide and reports annual cancer incidence rates stratified by sex, age and population groups. Voluntary participation in reporting data by private laboratories has declined since 2005.[26] These data have limited usefulness for monitoring cancers in terms of the NCD Strategic Plan because they are not disaggregated at any sub-national level and there is also a long time lag in availability, with 2010 being the most recent data at the time of writing.
Cause-of-death data
CoD data from vital registration can be used to monitor mortality rates at national and sub-national levels down to local municipalities. The rapid mortality surveillance (RMS) report[27] emphasised the dual under-reporting problem of CoD data: (i) due to non-registration on the population register at the Department of Home Affairs (DHA) because the deceased did not have an SA birth certificate or identity document; and (ii) due to non-reporting of deaths to the DHA. Completeness of reporting varies across the country, although this has not been quantified. In some districts in 2013, the quality of CoD coding was poor, with >60% of underlying causes ill-defined or 'garbage codes' along with substantial misattribution of causes.[28]
Cross-cutting issues
The NCD Strategic Plan[16] emphasises the importance of an appropriate, operational NCD surveillance system. Ideally, such a data source should provide timely and accessible data on all the plan's 10 main goals (Table 1). Streamlining existing data sources could ensure use of the most appropriate case definitions, preferably based on measurements rather than self-reports, and comprising key attributes such as gender and age in order to allow disaggregation. New variables should also be added to fill the present data gaps. Disaggregating data collection to district as opposed to national or provincial levels would allow identification of hot spots for particular public health attention.
Self-report based on diagnosis by a health practitioner is the basis of monitoring several NCDs, although self-reported data have been widely critiqued as inaccurate and unreliable assessment tools.[29] We therefore recommend that, where possible, biomarkers or health measurements be added to surveys conducted regularly with coverage at sub-national level. For diseases not amenable to such measurements, there are three alternatives that can be implemented in existing routine data sources.
The first is national deployment of the DHIS2 version of the DHIS with a national indicator data set that would enable holistic monitoring of all NCDs as per the Strategic Plan. A major advantage of this is that data can be analysed at the individual level based on where the patients live rather than where they choose to seek care.
A second alternative to the shortcomings of survey-sourced data would be to implement an NCD module in the existing TIER.net system[30] originally designed for monitoring HIV, TB, and maternal and child health. The system was reported to have been operational in about 3 000 of the approximately 4 000 facilities in SA by 2014.[11]
This would still exclude private sector patients, because the TIER.net system is not linked or interoperable with specific groups of private healthcare providers.
A third alternative would be adopting the dual database system covering dispensed chronic medication routinely dispensed in the public sector, similar to those in use by the Western Cape Department of Health and that have been used by researchers to monitor NCD comorbidities and multimorbidities in a cross-sectional study.'311 Efforts for national roll-out are underway through the Central Chronic Medicine Dispensing and Distribution Programme (CCMDD), implemented by the Health Systems Trust on behalf of the NDoH with President's Emergency Plan for AIDS Relief (PEPFAR) funding. To date, the CCMDD has been implemented at >600 public facilities in the 10 National Health Insurance (NHI) pilot districts.[32]
Of the surveys discussed, GHS is conducted most frequently, but its dependence on self-reported data makes it a limited health data source. By sampling design, GHS is reliable only to provincial level, although the sample size it uses is more than three times larger than NiDS. SANHANES and SADHS focus specifically on health and currently include the greatest depth of measured health data. The SADHS has been irregular, however, and the regularity of SANHANES cannot be established at the moment.
As a panel survey, NiDS allows analysis of the effectiveness of intervention programmes by considering transitions between undesirable and desirable states of risk conditions and factors, facilitating assessment of longitudinal trends. The survey, which includes blood pressure and anthropometric measurements in addition to NCD self-reported data, may prove the best source for monitoring certain NCDs and related risk conditions and factors provided data quality is expanded to include omitted NCDs and other vital biomarkers such as glycosylated haemoglobin (HbA1c), hyperlipidaemia, cotinine and cardiovascular fitness tests (or expanding the definition of physical activity). Such improvements may be minimal since mechanisms exist for health practitioners to carry out these additional measurements. Being stratified by district makes NiDS useful for depicting health status beyond national and provincial levels, although it would be necessary to increase sample size. The utility of NiDS is enhanced by its policy of making data publicly available within the shortest time possible without stringent and restrictive procedures. Consequently, a wide range of researchers have utilised NiDS, disseminating vital NCD information[24,25,33-35] to a wider audience.
Quality of CoD data may still pose a challenge, especially for deaths occurring in rural and remote areas where a chief or tribal leader completes the DHA form to certify the occurrence of the death and describe circumstances that led to or caused the death. These data can be expected to improve only once there is equitable distribution of resources of healthcare infrastructure and medical practitioners who can certify deaths with reasonable certainty. Methods of improving data from this source have been suggested by Bradshaw et al.[36] and in van Wyk et al.[37]
Conclusions
We recommend that available SA data sources for NCDs and their risk conditions and factors be harmonised and in certain areas strengthened, eliminating gaps and providing a sound basis of data quality, definitions and categories used and timeliness to facilitate monitoring progress of the NCD Strategic Plan.[16] This is essential for meeting global (WHO 2013'151) and national objectives set for monitoring NCD prevention and control and guiding the NDoH in its efforts to protect the population from the emerging NCD epidemic. We suggest that the NDoH spearheads and funds this process by convening all relevant stakeholders, including data producing agencies and SA research groups, with the aim of synchronising efforts that will enable targeted prevention and control of NCDs. At a general level, we contend that healthcare interventions being implemented without monitoring the relevant outcome indicators risk being very costly in the sense that they may not be working. Hence, appropriate data sources will enable 'value for money' investments in healthcare delivery.
Acknowledgements. The making available to the public of NiDS data by DataFirst and GHS data by Stats SA is highly appreciated. We thank Patricia McCracken, who assisted with language editing of the manuscript.
REFERENCES
1. Eckerson WW. Data Quality and the Bottom Line: TDWI Report, The Data Warehouse Institute. 2002. http://download.101com.com/pub/tdwi/Files/DQReport.pdf (accessed 23 June 2016). [ Links ]
2. World Health Organization. Improving Data Quality: A Guide for Developing Countries. Manila: WHO Regional Office for the Western Pacific, 2003. [ Links ]
3. Agyepong I, Corrah T, Guo Y, et al. Making sense of health estimates. Lancet 2015;385(9976):1377-1379. https://doi.org/10.1016/S0140-6736(15)60024-1 [ Links ]
4. Joubert J, Rao C, Bradshaw D, Dorrington RE, Vos T, Lopez AD. Characteristics, availability and uses of vital registration and other mortality data sources in post-democracy South Africa. Glob Health Action 2012;5(1):19263. https://doi.org/10.3402/gha.v5i0.19263 [ Links ]
5. Dixon BE, Siegel JA, Oemige TV, Grannis SJ. Electronic health information quality challenges and interventions to improve public health surveillance data and practice. Public Health Rep 2013;128(6):546-553. https://dx.doi.org/10.1177/003335491312800614 [ Links ]
6. Dixon BE, Grannis SJ. Why "What data are necessary for this project?' and other basic questions are important to address in public health informatics practice and research. Online J Public Health Inform 2011;3(3). https://doi.org/10.5210/ojphi.v3i3.3792 [ Links ]
7. AbouZahr C, Boerma T. Health information systems: The foundations of public health. Bull World Health Organ 2005;83(8):578-583. https://dx.doi.org/10.1590/S0042-96862005000800010 [ Links ]
8. Pappaioanou M, Malison M, Wilkins K, et al. Strengthening capacity in developing countries for evidence-based public health: The data for decision-making project. Soc Sci Med 2003;57(10):1925- 1937. https://doi.org/10.1016/S0277-9536(03)00058-3 [ Links ]
9. Wilkins K, Nsubuga P, Mendlein J, Mercer D, Pappaioanou M. The data for decision making project: Assessment of surveillance systems in developing countries to improve access to public health information. Public Health 2008;122(9):914-922. https://doi.org/10.1016/j.puhe.2007.11.002 [ Links ]
10. World Health Organization. Tracking Universal Health Coverage: First Global Monitoring Report. Geneva: WHO, 2015. [ Links ]
11. Calata A. UCT team's HIV-monitoring software exported. Cape Town: Newsroom & Publications daily news. University of Cape Town, 2014. http://www.uct.ac.za/dailynews/?id=8827 (accessed 27 May 2016). [ Links ]
12. Alwan A, MacLean DR, Riley LM, et al. Monitoring and surveillance of chronic non-communicable diseases: Progress and capacity in high-burden countries. Lancet 2010;376(9755):1861-1868. https://doi.org/10.1016/S0140-6736(10)61853-3 [ Links ]
13. Gouda HN, Richards NC, Beaglehole R, Bonita R, Lopez AD. Health information priorities for more effective implementation and monitoring of non-communicable disease programs in low-and middle- income countries: Lessons from the Pacific. BMC Med 2015;13(1):1. https://doi.org/10.1186/s12916-015-0482-5 [ Links ]
14. Boutayeb A, Boutayeb S. The burden of non communicable diseases in developing countries. Int J Equity Health 2005;4(1):1. https://dx.doi.org/10.1186/1475-9276-4-2 [ Links ]
15. World Health Organization. Global Action Plan for the Prevention and Control of Noncommunicable Diseases 2013 - 2020. Geneva: WHO, 2013:1-103. [ Links ]
16. National Department of Health, South Africa. Strategic Plan for the Prevention and Control of Non-communicable Diseases 2013 - 17. Pretoria: NDoH, 2012. http://www.hsrc.ac.za/uploads/pageContent/3893/NCDs%20STRAT%20PLAN%20 %20CONTENT%208%20april%20proof.pdf (accessed 12 February 2016). [ Links ]
17. National Department of Health, South Africa. Strategy for the Prevention and Control of Obesity in South Africa 2015 - 2020. Pretoria: NDoH, 2015. https://www.health-e.org.za/wp-content/uploads/2015/12/Nationd-Strategy-for-prevention-and-Control-of-Obesity-4-August-latestpdf (accessed 24 April 2016). [ Links ]
18. National Department of Health, South Africa. South Africa Demographic and Health Survey 1998: Full Report. Pretoria: NDoH, 2002. http://dhsprogram.com/pubs/pdf/FR131/FR131.pdf (accessed 19 February 2016). [ Links ]
19. National Department of Health, South Africa. South Africa Demographic and Health Survey 2003. Pretoria: NDoH, 2004. https://dhsprogram.com/pubs/pdf/FR206/FR206.pdf (accessed 21 March 2016). [ Links ]
20. Shisana O, Labadarios D, Rehle T, Simbayi L, Zuma K. South African National Health and Nutrition Examination Survey (SANHANES-1). Cape Town: HSRC Press, 2013. [ Links ]
21. Wandai M, Day C. Trends in risk factors for non-communicable diseases in South Africa. Durban: Health Systems Trust, 2015. http://www.hst.org.za/sites/default/files/Trends_NCD_SA_HST_28Aug2015.pdf (accessed 22 April 2016). [ Links ]
22. World Health Organization. Global Physical Activity Questionnaire (GPAQ) Analysis Guide. Geneva: WHO, 2012. [ Links ]
23. Joubert J, Norman R, Lambert EV, et al. Estimating the burden of disease attributable to physical inactivity in South Africa in 2000. S Afr Med J 2007;97(8):725-731. [ Links ]
24. Cois A, Day C. Obesity trends and risk factors in the South African adult population. BMC Obes 2015;2(1):1. https://doi.org/10.1186/s40608-015-0072-2 [ Links ]
25. Day C, Groenewald P, Laubscher R, Chaudhry S, van Schaik N, Bradshaw D. Monitoring of non- communicable diseases such as hypertension in South Africa: Challenges for the post-2015 global development agenda. S Afr Med J 2014;104(10):680-687. https://dx.doi.org/10.7196/SAMJ.7868 [ Links ]
26. Singh E, Underwood J, Nattey C, Babb C, Sengayi M, Kellett P. South African National Cancer Registry: Eflffect of withheld data from private health systems on cancer incidence estimates. S Afr Med J 2015;105(2):107-109. https://dx.doi.org/10.7196/SAMJ.8858 [ Links ]
27. Dorrington R, Bradshaw D, Laubscher R, Nannan N. Rapid Mortality Surveillance Report 2014. Cape Town: South African Medical Research Council, 2015. http://www.mrc.ac.za/bod/RapidMortalitySurveillanceReport2014.pdf (accessed 4 March 2016). [ Links ]
28. Burger EH, Groenewald P, Rossouw A, Bradshaw D. Medical certification of death in South Africa - moving forward. S Afr Med J 2015;105(1):27-30. https://doi.org/10.7196/SAMJ.8578 [ Links ]
29. Vellakkal S, Millett C, Basu S, et al. Are estimates of socioeconomic inequalities in chronic disease artefactually narrowed by self-reported measures of prevalence in low-income and middle-income countries? Findings from the WHO-SAGE survey. J Epidemiol Community Health 2014;69(3):jech-2014-204621. https://doi.org/10.2139/ssrn.2603197 [ Links ]
30. Osler M, Hilderbrand K, Hennessey C, et al. A three-tier framework for monitoring antiretroviral therapy in high HIV burden settings. J Int AIDS Soc 2014;17(1). https://dx.doi.org/10.7448/IAS.17.1.18908 [ Links ]
31. Oni T, Youngblood E, Boulle A, McGrath N, Wilkinson RJ, Levitt NS. Patterns of HIV, TB, and non- communicable disease multi-morbidity in peri-urban South Africa - a cross sectional study. BMC Infect Dis 2015;15(1). https://doi.org/10.1186/s12879-015-0750-1 [ Links ]
32. Health Systems Trust. Central Chronic Medicine Dispensing and Distribution Programme (CCMDD). Durban: HST, 2015. http://www.hst.org.za/projects/central-chronic-medicine-dispensing-and-distribution-programme-ccmdd (accessed 24 June 2016). [ Links ]
33. Cois A, Ehrlich R. Analysing the socioeconomic determinants of hypertension in South Africa: A structural equation modelling approach. BMC Public Health 2014;14(414). https://doi.org/10.1186/1471-2458-14-414 [ Links ]
34. Cois A, Ehrlich R. Socioeconomic status modifies the seasonal effect on blood pressure: Findings from a national panel study. Medicine 2015;94(35). https://doi.org/10.1097/md.0000000000001389 [ Links ]
35. Sartorius B, Veerman LJ, Manyema M, Chola L, Hofman K. Determinants of obesity and associated population attributability, South Africa: Empirical evidence from a national panel survey, 2008-2012. PloS One 2015;10(6). http://dx.doi.org/10.1371/journal.pone.0130218 [ Links ]
36. Bradshaw D, Pillay-van Wyk V, Laubscher R, et al. Cause of death statistics for South Africa: Challenges and possibilities for improvement. Cape Town: South African Medical Research Council Burden of Disease Research Unit, 2010. http://www.mrc.ac.za/bod/cause_death_statsSA.pdf (accessed 27 April 2016). [ Links ]
37. Van Wyk VP, Bradshaw D, Groenewald P, Laubscher R. Improving the quality of medical certification of cause of death: The time is now! S Afr Med J 2011;101(9):626. [ Links ]
 Correspondence:
M Wandai
muchiriwandai@gmail.com
Accepted 13 December 2016

