


Servicios Personalizados
Articulo
 Inglés (pdf)
 Articulo en XML
 Referencias del artículo
Indicadores

Links relacionados
-
 Citado por Google
 -
 Similares en Google
Compartir

 Permalink
SAMJ: South African Medical Journal
versión On-line ISSN 2078-5135
versión impresa ISSN 0256-9574
SAMJ, S. Afr. med. j. vol.106 no.5 Pretoria may. 2016
http://dx.doi.org/10.7196/samj.2016.v106i5.10783
RESEARCH
Active surveillance of hospital-acquired infections in South Africa: Implementation, impact and challenges
W Lowman
MB BCh, MMed, FC Path (SA) Vermaak and Partners Pathologists, Wits Donald Gordon Medical Centre, Johannesburg, South Africa, and Department of Clinical Microbiology and Infectious Diseases, School of Pathology, Faculty of Health Sciences, University of the Witwatersrand, Johannesburg
ABSTRACT
BACKGROUND. Hospital-acquired infections (HAIs) are a significant although unquantified burden in South Africa. Lack of adequate surveillance compounds this problem.
OBJECTIVE. To report on the establishment and outcomes of a unit-specific surveillance system for hospital-acquired infections, based on international standards, in a private academic hospital.
METHODS. Active unit-specific surveillance of device-associated infections (DAIs) was introduced over a 2-year period. The surveillance system was based on the US National Healthcare Safety Network (NHSN) utilising standardised definitions. Analysis of DAI rates and device utilisation was done according to Centers for Disease Control and Prevention methods. Comparative analysis using study-derived annualised data and existing NHSN data was done.
RESULTS. Surveillance results of DAI rates showed significant reductions in intensive care unit-related ventilator-associated pneumonia (42%) and central line-associated bloodstream infections (100%) over a 3-year period. Substantial variations in DAI rates and utilisation ratios between wards highlight the importance of unit-specific surveillance.
CONCLUSIONS. Active surveillance requires a significant investment in resources and is a sustained operational challenge, although equally significant benefits are derived from a better understanding of HAIs with more targeted interventions and efficient use of resources. A robust surveillance system is an essential component of any healthcare infection prevention and control programme and is a prerequisite to contextualising the HAI burden of hospitals.
Hospital-acquired infections (HAIs) are a significant problem globally, and a greater burden in the developing world than in more developed regions.[1] Addressing the problem of HAIs requires an understanding and appreciation of the extent of the problem, a key benefit of performing surveillance.
Surveillance of HAIs is the cornerstone of any infection prevention and control (IPC) programme. A well-co-ordinated and effective surveillance system should prevent a significant proportion of HAIs from occurring and support construction and implementation of further IPC efforts. These concepts were established more than 30 years ago in the SENIC project (a study on the efficacy of nosocomial infection control)[2] and have been reaffirmed by more recent studies.[3]
Surveillance of HAIs in South Africa (SA) is neglected and poorly resourced. The true burden of HAIs is unknown, although it is largely accepted that it is greater in the public sector than in the private sector, and probably somewhere in the region of 10 - 20%.[4] However, a figure of 10 - 20% provides a very limited perspective on HAIs, and if we are to use the scarce resources at our disposal efficiently, more detailed analyses and reporting of HAI rates are required. A systematic review of HAIs in developing countries over the years 1995 - 2008 revealed only 13 studies from Africa, none of them from SA.[1] The lack of data from SA is an indictment of our healthcare system and raises serious concerns.
Firstly, SA has no national standardised surveillance system for HAIs. A recently published document (under the auspices of the Global Antibiotic Resistance Partnership) provides a situational analysis of the current IPC challenges in the country.[5] In the public sector, surveillance activities are sorely lacking owing to understaffing and lack of training. Similarly, in the private sector, human resources dedicated to surveillance activities are often insufficient. The majority of surveillance activities in both the public and private sectors are laboratory based, which is not ideally suited to the hospital environment. The Centers for Disease Control and Prevention (CDC) in Atlanta, USA, have developed standardised definitions for HAIs that are generally accepted as the global standard.[6,7] Many of these definitions are clinically based, not requiring a culture result, and therefore necessitate clinical assessment of patients. In SA these definitions are generally accepted as the standard in both the private and public sectors, despite the lack of staff and training to implement these definitions in a comprehensive manner.
Objective
To report on the establishment and results of an active surveillance system in the setting of a private academic teaching hospital. It serves as a first report, based on an internationally accepted standard surveillance system, of device-associated HAI rates in SA and as a starting point to address some of the abovementioned deficiencies in surveillance of HAIs in this country. Furthermore, the impact of and challenges associated with implementing such a surveillance system in the context of the SA private healthcare setting are described.
Methods
The Wits Donald Gordon Medical Centre (WDGMC) is a specialist referral, private academic teaching hospital in Johannesburg, SA. This 194-bed facility serves as a referral centre for transplant, oncology (adult and paediatric), colorectal and hepatobiliary patients. It also caters for orthopaedic, neurosurgical, vascular, general medical and a large subset of geriatric patients. In 2009, a strategy to initiate a fully fledged clinically based surveillance system was developed. This system, largely based on the National Healthcare Safety Network (NHSN) in the USA, was first introduced in 2010 in the intensive care unit (ICU). Implementation and refinement with subsequent expansion to other units in the hospital took place over a 2-year period (2010 and 2011), with data only being analysed following successful implementation. During this time the hospital underwent extensive renovation with subsequent rearrangements of units and wards. The hospital currently has a 29-bed ICU/high-care unit, a 34-bed surgical ward, a 24-bed adult oncology unit, including a 4-bed high-care area, a 17-bed medical ward, a 24-bed hepatorenal/ transplant ward, a 42-bed mixed ward and a 16-bed paediatric oncology ward (these will be referred to as units A - H, although not necessarily in that order). Unit-specific surveillance was undertaken.
Device-associated infections (DAIs), including catheter-associated urinary tract infections (CAUTIs), central line-associated bloodstream infections (CLABSIs) and ventilator-associated pneumonias (VAPs), were initially targeted for surveillance. At initiation only one or two types of DAI per unit were selected for surveillance, based on need perceived by the IPC team and medical staff in the unit. Unit managers and other designated permanent staff in each individual ward/unit were trained to use the standardised surveillance definitions as defined by the CDC.[7] Denominator data were collected by trained unit staff on a daily basis using a standardised denominator data collection tool. Final decisions regarding an HAI were made and its categorisation done by the IPC team, which included a trained infection prevention specialist and clinical microbiologist.
During the implementation phase, weekly surveillance/audit rounds were conducted by the IPC team to monitor aspects of the surveillance programme including verification, correct application of surveillance definitions and collection of denominator data. Errors and potential challenges in conducting surveillance were identified through analysis of the collected data (outliers and inconsistencies). These were then discussed with staff to determine the underlying reasons for discrepancies, with subsequent implementation of corrective actions, extra training and support.
Data collection in each unit commenced on completion of training in a DAI-specific module. Data analysis only commenced after a period of assessment (as per weekly audits) when the unit was deemed to be compliant with data collection and application of surveillance definitions.
The data were subsequently used to guide specific interventions in wards where a problem was identified. This principally involved evaluation of device-associated 'bundles' with a combination of bundle component assessment, retraining of nursing staff and monitoring of compliance. The 'bundle' approach followed the principles of the 'Best Care...Always!' initiative, a quality improvement campaign established in 2009 (www.bestcare.org.za).
Data analysis
The DAI surveillance data were analysed using outcome measures as defined by the NHSN/CDC.[7] The primary outcome measures were rates of infection per 1 000 device days, calculated for each month as follows:
DAI rate = No. infections/Total device days x 1 000.
Device utilisation (DU) ratios were calculated each month as follows:
DU ratio = No. device days/Total patient days.
Cumulative annual rates for DAIs were determined as above by adding the numerator and denominator data for the 12 months of the calendar year. The cumulative rate therefore represents a mean for the year. The annual mean rates were assessed statistically, with determination of 95% confidence intervals (CIs). Comparative assessment of annual mean rates for CLABSIs was done using the standardised infection ratio (SIR).[8] In the absence of national data from which to derive a benchmark SIR, the CDC NHSN 2012 and 2013 data (for major teaching medical/surgical ICUs) were used as a standard.[9,10] For VAP a non-parametric comparison of means (for 2012 v. 2014) using the Wilcoxon rank sum test was utilised, with p<0.5 considered statistically significant.
Results are presented graphically as follows. DAI and cumulative rates are displayed as number of infections per 1 000 device days on the left-sided y-axis, and utilisation ratios on the right-sided y-axis. The mean cumulative rate for each year is reported (represented by the dotted grey line) and sets the benchmark for the following year.
The relationship between DU ratios and CAUTI rates across different wards was assessed using linear regression (GraphPad software).
Selected facility-wide and unit-specific surveillance results for the period 1 January 2012 - 31 December 2014 are presented.
Results
DAI rates
Fig. 1 (A-C) illustrates the VAP rate for the ICU for the period 2012 - 2014. A 42% reduction in the mean VAP rate from 2012 (11.29/1 000 ventilator days; 95% CI 1.17 - 24.58) to 2014 (6.53/1 000 ventilator days; 95% CI -0.19 - 13.04) is demonstrated (p=0.76).


Fig. 2 (A-C) illustrates the CLABSI rates for the ICU for the period 2012 - 2014. It highlights a marked reduction, with achievement of a zero rate for 23 consecutive months, representing a decrease in cumulative rates from 2.15 in 2012 (95% CI 0.41 - 3.78) to 0.0 in 2014 (95% CI 0.0 - 0.0). The SIRs for 2012 and 2013 were 0.48 and 0.11, respectively. The central line utilisation ratio increased from 0.52 in 2012 to 0.67 for the years 2013 and 2014.
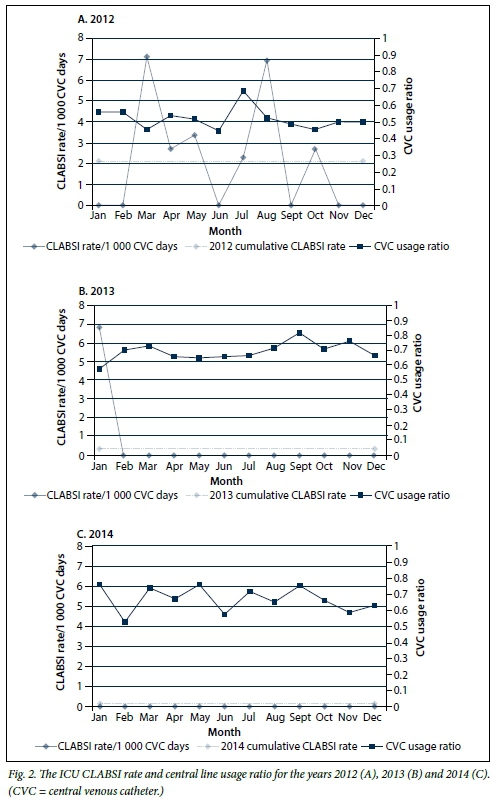
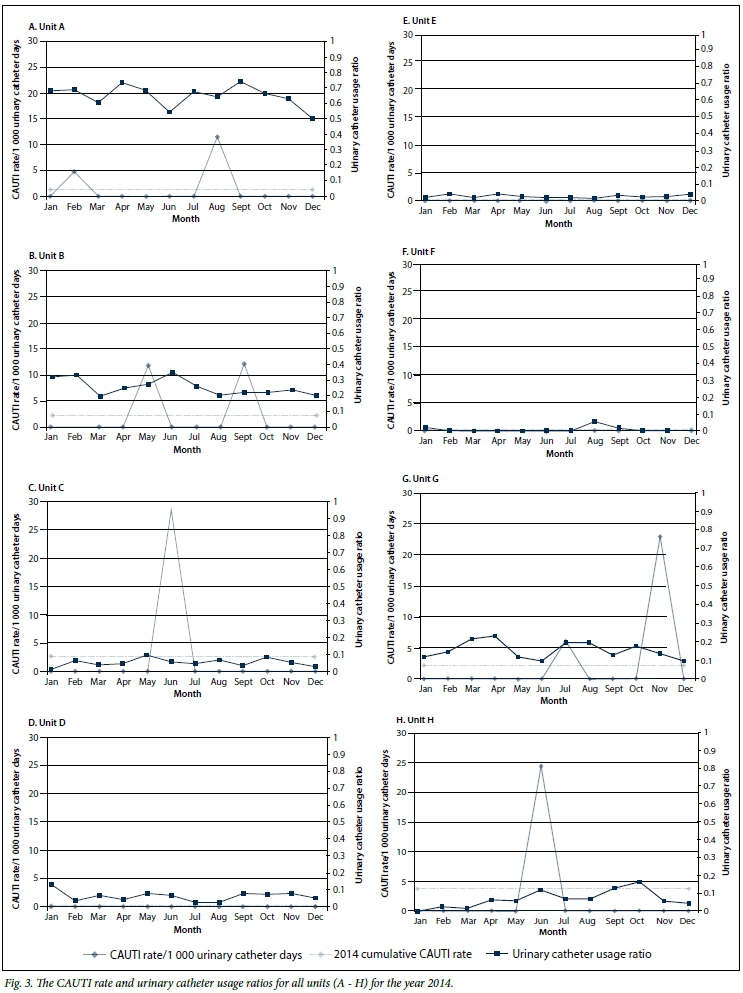
Fig. 3 illustrates the 2014 CAUTI rates for all the units in the hospital (A- H). The data represented highlight the importance of unit-specific surveillance data, where noticeably different targets are achieved and catheter utilisation ratios vary considerably. There was a non-significant relationship between DU ratios and DAI rates (p=0.81).
Discussion
We report on the establishment of a hospital-wide, unit-specific surveillance system, to our knowledge the first of its kind reported in SA. The intention was to establish robust baseline data from which to reduce the cumulative rate on an annual basis.
Comparisons of the ICU DAI rates with published data from both developed and developing countries are positive. The mean cumulative ICU CAUTI rate for 2014 (Fig. 3, A) was 1.28/1 000 catheter days. This rate compares favourably with CAUTI rates for ICU patients in developed countries (range 2.0 - 5.3) and far surpasses those in developing countries (range 6.6 - 17.2). [1] Similarly, the mean cumulative VAP rate (6.53/1 000 ventilator days) for 2014 (Fig. 1, C) is far superior to those in developing countries (range 19.8 - 48.0) and seemingly on a par with those in developed countries (2.9 - 8.0).[1] The mean cumulative VAP rate of 11.29/1 000 ventilator days for 2012 (Fig. 1, A) compares favourably with that reported from a single centre in Turkey for the same year (24.04). However, the Turkish unit was a 55-bed ICU catering for a variety of patients (including neurosurgical patients, who typically have higher VAP rates), whereas our ICU is principally a surgical/medical one, so the two cannot be directly compared.'111 For CLABSIs, using the recognised standard for risk adjusting and comparing HAI rates, we demonstrated a SIR of <1 for all 3 years. A SIR of <1 indicates that fewer infections were observed than expected, and this coupled with the sustained decrease in annual rates is a positive indicator of quality in care.
The reduction in ICU DAI cumulative rates can possibly be attributed to a focused and sustained implementation of infection prevention bundles. The CLABSI bundle was reviewed in the middle of 2012 and a sustained intervention of training and implementation, corroborated by improved compliance, resulted in achievement of a zero rate within a few months. The surveillance data clearly illustrate the impact of these interventions and provide a basis upon which to systematically monitor existing and future interventions. However, it is difficult to statistically quantify the impact of these interventions on rates. The VAP rate, despite showing a dramatic decrease, was not statistically significant. This probably relates to the difficulty in statistically evaluating HAI rates, where adjusting for risk is particularly problematic.[8] For this reason, SIRs are employed by the CDC to monitor progress in reduction of HAIs and to guide efforts in intensifying interventions. Calculation of SIRs requires a robust surveillance system to allow for comparable observed v. predicted infections at national, regional and local levels. The lack of comparative CDC data meant that we were unable to determine a SIR for VAP.
A hospital is very complex environment, and each hospital is unique. In fact, each ward within a hospital has its own unique HAI profile based on the discipline and the patient profile associated with that discipline. The 2014 CAUTI data demonstrate this, with rates varying considerably between wards (range 0 - 3.73/1 000 catheter days) despite an aggregate (hospital) rate of 1.29/1 000 catheter days (95% CI 0.29 - 2.29). The non-significant relationship between catheter usage ratios and CAUTI rates indicates that infection rates are independent of catheter usage. This suggests that patient-specific factors may play an important role, although individual ward compliance with bundles and IPC measures are possibly inconsistent and may be a confounder. It is therefore imperative to monitor compliance of interventions in conjunction with surveillance data analysis. The requirement for stratification by ward/patient profile is further highlighted by the CDC classification of surgical site infections (SSIs), where the risk of SSI is deemed highest in patients undergoing colorectal or transplant surgery and among the lowest in orthopaedic and obstetric surgery. The value of unit-specific data has also been demonstrated in terms of microbiological profiles and formulation of unit-specific antibiograms.[12] Unit-specific and targeted surveillance allows for more directed use of resources coupled with a more specific (by ward, discipline, patient type) measurable impact.
There were a number of challenges in establishing this system. The surveillance system was established over a significant period of time (6 years), and the fruits thereof are only now being realised. In most instances the introduction of the surveillance system (per unit) took more than a year before data collection became sufficiently reliable to analyse. The CDC surveillance definitions change on a yearly basis, complicating standardisation in defining HAIs, which necessitates a dedicated IPC specialist with experience in using the definitions. Clinical liaison is essential, as patients with HAIs on clinical grounds go undetected if there is no positive microbiological culture, or if no culture is submitted. Handling of the data is time consuming and currently counters real-time analysis thereof. An additional challenge is dissemination of the surveillance data, which is a crucial aspect if the data are to guide interventions. Consistent training, follow-up, analysis feedback and dissemination of data are critical components to any surveillance system, and sustainability of the HAI surveillance system is reliant on adequate resource allocation.
The system has grown tremendously in the past 2 years, and current surveillance activities per unit include: (i) at least four different HAIs per unit; (ii) antimicrobial use (in defined daily doses) per unit; and (iii) six different multidrug-resistant organisms per unit. The information generated by such a system can assist in understanding HAIs and provide guidance on the most appropriate utilisation of resources. As the surveillance system developed, it became apparent that surveillance for certain DAIs was unnecessary in certain units. This was based on low DU ratios with subsequent zero infection rates for certain units (Fig. 3). This is largely attributable to the patient profile of the individual units, and similarly other HAIs were considered more relevant with subsequent introduction of replacement HAI surveillance. Additionally, as the data became more robust and analysable, trends were followed, and based on further investigation of these trends interventions and/or modifications of practice were made.
A hospital surveillance system is not a stand-alone entity and requires significant investment in IPC, both from a management and an operational perspective. A recent systematic review by Zingg et al.[13] has highlighted the complex and multifaceted nature of effectively organising and implementing IPC programmes. Ten components were identified and graded according to quality of evidence, ease of implementation and applicability to the European Union. Interestingly, not one component scored a 'high' grade for any of the aforementioned criteria, although prospective surveillance, together with staff-to-occupancy ratios and hand hygiene, scored the highest (intermediate level) across all three criteria.[13]
Conclusions
We have shown that a surveillance system has contributed significantly towards a proactive rather than reactive IPC approach, with a resultant decrease in infection rates. Targeted interventions are implemented based on reliable and accurate data. However, for the system to become truly revolutionary, it is necessary to interpret data over the immediate to short term and to identify a particular problem before it escalates. This would circumvent the traditional reactionary response to outbreaks and IPC interventions. Statistical process control may be a potential solution, and we aim to assess its value. Ultimately, unless we understand the burden of HAIs there is little we can do about them, and currently very few SA healthcare facilities understand their own HAI burden at a sufficiently detailed level. This study is a first step towards creating an awareness of the need for more such data. We firmly believe that our system has contributed significantly to the quality of patient care and provided a sound basis from which to reduce the burden of HAIs in the future.
Acknowledgements. I would like to extend my sincere gratitude to the management and clinical staff of the WDGMC whose efforts have made this work possible. I would particularly like to acknowledge Sr Ronel Senekal for her commitment to surveillance-associated activities and resolve in facilitating the establishment of this surveillance programme. I also thank Dr Alison Bentley for her thorough and critical review of the manuscript, Dr Sue Tager for her continued support of this initiative, and the WDGMC research team for their support and guidance.
References
1. Allegranzi B, Bagheri Nejad S, et al. Burden of endemic health-care-associated infection in developing countries: Systematic review and meta-analysis. Lancet 2011;377(9761):228-241. DOI:10.1016/S0140-6736(10)61458-4 [ Links ]
2. Hughes JM. Study on the Efficacy of Nosocomial Infection Control (SENIC Project): Results and implications for the future. Chemotherapy 1988;34(6):553-561. [ Links ]
3. Gastmeier P, Geffers C, Brandt C, et al. Effectiveness of a nationwide nosocomial infection surveillance system for reducing nosocomial infections. J Hosp Infect 2006;64(1):16-22. DOI:10.1016/j.jhin.2006.04.017 [ Links ]
4. Durlach R, McIlvenny G, Newcombe RG, et al. Prevalence survey of healthcare-associated infections in Argentina: Comparison with England, Wales, Northern Ireland and South Africa. J Hosp Infect 2012;80(3):217-223. DOI:10.1016/j.jhin.2011.12.001 [ Links ]
5. Visser A, Moore DP, Whitelaw A, et al. Global antibiotic resistance partnership situation analysis: Antibiotic use and resistance in South Africa. Part VII. Interventions. S Afr Med J 2011;101(8):587-595. [ Links ]
6. Horan TC, Andrus M, Dudeck MA. CDC/NHSN surveillance definition of health care-associated infection and criteria for specific types of infections in the acute care setting. Am J Infect Control 2008;36(5):309-332. DOI:10.1016/j.ajic.2008.03.002 [ Links ]
7. Centers for Disease Control. CDC/NHSN Surveillance Deinition of Healthcare-Associated Infection and Criteria for Speciic Types of Infections in the Acute Care Setting 2014. www.cdc.gov/nhsn (accessed 1 January 2014). [ Links ]
8. Gustafson TL. Three uses of the standardized infection ratio (SIR) in infection control. Infect Control Hosp Epidemiol 2006;27(4):427-430. DOI:10.1086/503019 [ Links ]
9. Dudeck MA, Weiner LM, Allen-Bridson K, et al. National Healthcare Safety Network (NHSN) report, data summary for 2012, device-associated module. Am J Infect Control 2013;41(12):1148-1166. DOI:10.1016/j.ajic.2013.09.002 [ Links ]
10. Dudeck MA, Edwards JR, Allen-Bridson K, et al. National Healthcare Safety Network report, data summary for 2013, device-associated module. Am J Infect Control 2015;43(3):206-221. DOI:10.1016/j.ajic.2014.11.014 [ Links ]
11. Alp E, Altun D, Cevahir F, Ersoy S, Cakir O, McLaws ML. Evaluation of the effectiveness of an infection control program in adult intensive care units: A report from a middle-income country. Am J Infect Control 2014;42(10):1056-1061. DOI:10.1016/j.ajic.2014.06.015 [ Links ]
12. Kuster SP, Ruef C, Zbinden R, et al. Stratification of cumulative antibiograms in hospitals for hospital unit, specimen type, isolate sequence and duration of hospital stay. J Antimicrob Chemother 2008;62(6):1451-1461. DOI:10.1093/jac/dkn384 [ Links ]
13. Zingg W, Holmes A, Dettenkofer M, et al. Hospital organisation, management, and structure for prevention of health-care-associated infection: A systematic review and expert consensus. Lancet Infect Dis 2015;15(2):212-224. DOI:10.1016/S1473-3099(14)70854-0 [ Links ]
 Correspondence:
W Lowman
warren.lowman@wits.ac.za
Accepted 31 March 2016.

