


Serviços Personalizados
Artigo
 Inglês (pdf)
 Artigo em XML
 Referências do artigo
Indicadores

Links relacionados
-
 Citado por Google
 -
 Similares em Google
Compartilhar

 Permalink
SAMJ: South African Medical Journal
versão On-line ISSN 2078-5135
versão impressa ISSN 0256-9574
SAMJ, S. Afr. med. j. vol.106 no.2 Pretoria Fev. 2016
http://dx.doi.org/10.7196/SAMJ.2016.V106I2.10125
RESEARCH
Which test is best for diagnosing peanut allergy in South African children with atopic dermatitis?
C L GrayI; M E LevinII; G du ToitIII
IMB ChB, FRCPCH, MSc, PhD; Division of Allergology, Red Cross War Memorial Children's Hospital, Cape Town, South Africa
IIMB ChB, FCPaeds, PhD; Division of Allergology, Red Cross War Memorial Children's Hospital, Cape Town, South Africa
IIIMB ChB, FRCPCH King's College London, King's Health Partners, MRM & Asthma UK Centre in Allergic Mechanisms of Asthma, and Department of Paediatric Allergy, Guy's and St Thomas' NHS Foundation Trust, London, UK
ABSTRACT
BACKGROUND: Diagnosing peanut allergy based on sensitisation alone leads to an unacceptable rate of overdiagnosis.
OBJECTIVE: To define parameters that may help differentiate peanut allergy from asymptomatic sensitisation in a cohort of South African (SA) children with atopic dermatitis (AD). It is the first study in SA to utilise oral food challenge tests and analyse peanut component patterns.
METHODS: This was a prospective, observational study at a paediatric university hospital in Cape Town, SA. Children with AD, aged 6 months - 10 years, were recruited randomly. They were assessed for sensitisation and allergy to peanut by questionnaire, skin-prick tests (SPTs), immuno solid-phase allergen chip (ISAC) tests, ImmunoCAP component tests to Ara h 1, 2, 3, 8 and 9, and incremental food challenges.
RESULTS: One hundred participants (59 Xhosa (black Africans) and 41 of mixed race, median age 42 months) were enrolled. Overall, 44% of patients were peanut sensitised and 25% had a true peanut allergy. SPTs and ImmunoCAP Ara h 2 produced the highest areas under the receiver operating characteristic curve for predicting peanut allergy in peanut-sensitised patients. The ISAC test was less sensitive, more specific and produced significantly lower median values than ImmunoCAP tests. Ara h 2 was the most useful component in differentiating allergy from tolerance in both ethnic groups, being positive in 92% of allergic and 40% of sensitised but tolerant children (p<0.001). There was little additional contribution from Ara h 1 and 3. Ara h 8 and 9 were associated with tolerance. Commonly used 95% positive predictive values (PPVs) for SPTs, peanut-specific IgE and Ara h 2 levels fared suboptimally in our population. Maximum PPVs for this study population were found at SPT 11 mm, peanut IgE 15 kU/L and ImmunoCAP Ara h 2 of 8 kU/L, but these adjusted levels still had suboptimal PPVs in Xhosa subjects. Severe peanut allergy was associated with increased median peanut IgE and Ara h 2.
CONCLUSIONS: The component Ara h 2 was useful for differentiating allergy from tolerance in both ethnic groups in this SA cohort. Ninety-five percent PPVs for peanut allergy tests may need to be revised, especially in Xhosa patients. An SPT result >11 mm as well as Ara h 2 >8 kU/L had the best predictive value for peanut allergy.
The increase in allergy to peanut in westernised countries[1] has sparked widespread interest in peanut allergy. Recent progress has been made in identifying risk factors for peanut allergy, such as epithelial barrier defects leading to epicutaneous sensitisation by peanut protein.[2] Further research into possible strategies to prevent peanut allergy in high-risk patients has favoured early introduction of peanut protein, which may promote tolerance in selected patients.[3] Screening for peanut allergy is an important part of the management of the patient at risk of peanut allergy. However, sensitisation does not equate to allergy in peanut-sensitised patients, and further specialised tests such as food challenges may be required to differentiate between asymptomatically sensitised and truly allergic patients. Ninety-five percent positive predictive values (PPVs) have been established to predict food allergies more reliably and reduce the number of labour-intensive and potentially hazardous food challenges. However, these PPVs may be population and age specific.[4]
The use of molecular allergology using component-resolved diagnostics has become commonplace in peanut allergy diagnosis in the past decade. Peanut components are prefixed 'Ara' after the name for peanut, Arachis hypogaea. Component testing for peanut proteins helps differentiate between nonspecific cross-reactive components such as Ara h 5, 8 and 9 and specific peanut components such as Ara h 1, 2, 3 and 6, which are heat-resistant storage proteins. Ara h 2 (2S albumin storage protein) has been shown to be the most important component in prediction of food allergy in several countries, including the UK,[5] France,[6] Japan[7] and the USA,[8] with a positive result (>0.35 kU/L) to Ara h 2 having a high predictive value for peanut allergy. In Mediterranean countries, the lipid transfer factor Ara h 9 is an important peanut allergen.[9] Ara h 8, in the PR10 protein group of labile food allergens, is more prominent in those exposed to certain pollens such as birch and alder.[10] The pattern and relevance of peanut components may therefore vary between geographical areas and possibly between ethnic groups.
Currently there are no reliable data on peanut allergy prevalence in South Africa (SA), but prevalence studies are underway. A recent study on food allergy prevalence in patients with atopic dermatitis (AD) suggests a high rate of peanut allergy of 25% in this high-risk population.[11] However, the rate of asymptomatic sensitisation was also high: a further 19% of patients were peanut sensitised but not allergic. The objective of this study was to determine parameters that may help in differentiating between peanut allergy and asymptomatic sensitisation in our cohort of children with AD. It is the first study in SA to utilise oral food challenge tests in equivocal cases, and also the first to analyse peanut component patterns. Patterns of peanut component sensitisation (Ara h 1, 2, 3, 8 and 9) and the value of internationally derived 95% PPVs for peanut allergy were explored.
Methods
The methods have been described in detail in a previous article.[11] In brief, 100 children (aged 6 months - 10 years) with moderate to severe AD were randomly selected from a dermatology clinic at Red Cross War Memorial Children's Hospital (RCWMCH), Cape Town, SA. They completed an allergy questionnaire and underwent eczema scoring by SCORAD (SCORing Atopic Dermatitis) assessment, and a panel of skin-prick tests (SPTs) including peanut extract (Alk Abello, Spain). They all underwent an ImmunoCAP immuno solid-phase allergen chip (ISAC) 103 microarray test that tested for peanut components Ara h 1, 2, 3 and 8. The patients who were sensitised to peanut by the SPT or ISAC test (n=44) further underwent ImmunoCAP testing to whole-peanut extract and components, Ara h 1, 2, 3, 8 and 9 (Phadia, Sweden). In all patients in whom there was uncertainty regarding peanut allergy, an incremental open food challenge was performed as a day case at RCWMCH. The challenge food was given in the form of peanut butter, starting with a lip challenge then moving from 0.3 g to 17 g of peanut butter over 2 hours with dose increments every 15 - 20 minutes.
Study definitions
IgE-mediated peanut sensitisation was defined as a positive SPT (>3 mm above the negative control) and/ or positive food-specific IgE by ISAC (>0.3 ISAC units).
IgE-mediated peanut allergy was defined as either a positive food challenge or a convincing clinical history of significant type I allergic reactions after isolated ingestion of peanut-containing food in the preceding 6 months, with significantly positive SPT/specific IgE above the 95% PPV for peanut of 8 mm for SPT and 14 kU/L for ImmunoCAP.[12,13]
Ethical considerations
The study was approved by the University of Cape Town's Faculty of Science Human Ethics committee (reference 426/2009). Informed consent was obtained from a parent/legal guardian for study participation, food challenges and blood testing.
Data entry and statistics
Data were entered onto a computerised database using STATA version 11.1 (Stata Corp, USA). Statistical tests were performed according to parametric or non-parametric distribution of data for comparisons between continuous parameters and categorical variables. The Χ2 test or the two-sample test of proportion was used to test for statistical differences between proportions. A p-value of <0.05 was considered statistically significant. Receiver operating characteristic (ROC) curves were used to assess the capacity of a variable or component to diagnose food allergy. Specificity, sensitivity and PPVs were calculated at various cut-off levels.
Results
Peanut sensitisation and allergy patterns
Overall, 44% of the patients (n=44) were sensitised to peanut (40% (24/59) of Xhosa (black African) patients and 50% (20/40) of mixed-race patients (p=0.1)). Overall, 24% (n=24) of the patients were peanut allergic (15% (9/59) of Xhosa patients and 38% (15/40) of mixed-race patients). The inter-ethnic difference was significant (p=0.01) (Fig. 1).
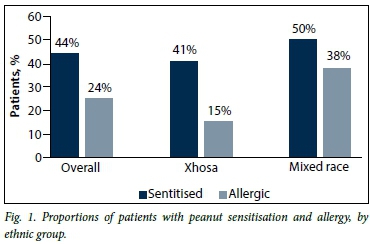
Overall, 57% of peanut-sensitised patients were peanut-allergic; this ratio was 75% in children of mixed race and 38% in Xhosas, and was significantly different at p<0.001.
Value of history of past reaction to peanut allergy in the diagnosis of peanut allergy
Overall, 23% of the patients (n=23) reported a reaction to peanut, of whom 16 were found to be allergic; 70% (16/23) with a perceived peanut allergy therefore had a true peanut allergy. Eight patients who were subsequently found to be allergic had never eaten peanut before.
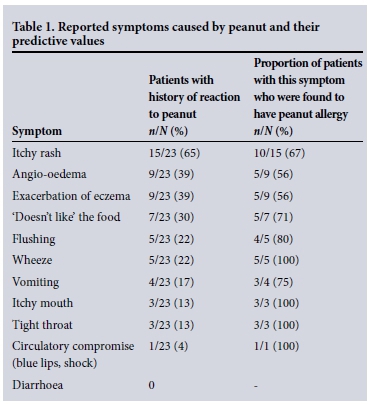
Symptoms of a severe reaction such as wheeze, tight throat and circulatory compromise were 100% accurate in predicting peanut allergy, as was an itchy mouth. However, symptoms such as perceived angio-oedema and eczema exacerbation had a poor predictive value (Table 1).
Sensitivity and specificity of positive SPTs, ISAC tests and ImmunoCAP tests in differentiating peanut allergy from tolerance in peanut-sensitised patients (n=44)
Patients who were found to be sensitised to peanut by the screening SPTs/ISAC tests underwent ImmunoCAP tests to whole peanut and components Ara h 1, 2, 3, 8 and 9 (n=44). A positive test result was considered to be >3 mm for SPT, >0.35 kU/L for ImmunoCAP tests and >0.3 ISAC units/L for ISAC tests.
In the 44 peanut-sensitised patients, the highest sensitivity for diagnosis of peanut allergy was achieved by both the SPT and the ImmunoCAP test to whole peanut, at 100% in both ethnic groups. However, the specificity of these tests and the PPV was poor: for SPT >3 mm the specificity was 73% and the PPV 55%, and for ImmunoCAP Peanut >0.35 kU/L the specificity was 40% and the PPV 67%. Component testing for Ara h 2 by both ISAC test and the ImmunoCAP test produced lower sensitivities than the SPT but higher specificities and PPVs: for ISAC Ara h 2 >0.3 ISAC units, sensitivity for peanut allergy diagnosis was 83%, specificity 75% and PPV 80%, and for ImmunoCAP to Ara h 2 sensitivity was 92%, specificity 60% and PPV 73%. Sensitivities, specificities and PPVs for peanut-sensitised patients are set out in Table 2.
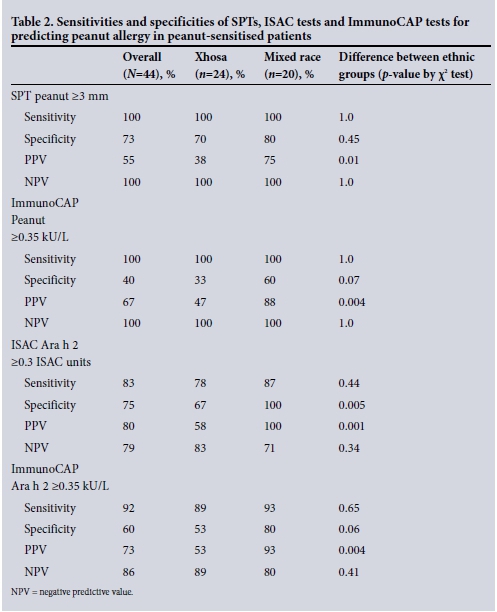
The trend for all the above screening tests was towards a lower specificity and PPV in the Xhosa patients, as depicted in Table 2.
ROC curves for diagnosis of peanut allergy in peanut-sensitised patients
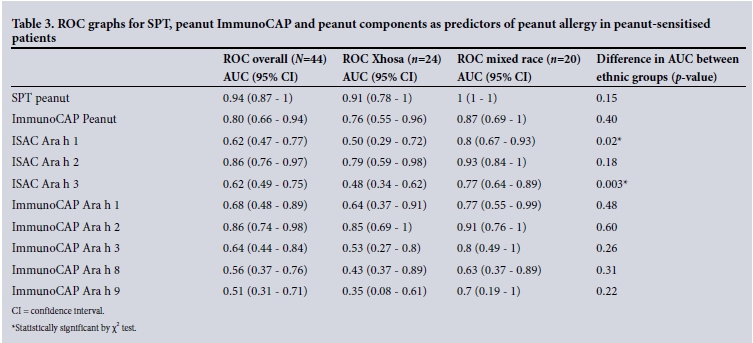
ROC curves were performed to assess the capacity of variables to diagnose peanut allergy in peanut-sensitised patients. The highest area under the ROC curve (AUC) was attained for SPT to peanut (0.94), followed by ImmunoCAP Ara h 2 and ISAC Ara h 2 (both 0.86), then ImmunoCAP to whole peanut (0.80). The ROC AUC was significantly lower for Ara h 1, both by ISAC (AUC 0.62) and ImmunoCAP (AUC 0.68), and for Ara h 3 for ISAC (AUC 0.62) and ImmunoCAP (AUC 0.64). Performance in the prediction of peanut allergy was poor for ImmunoCAP Ara h 8 (AUC 0.56) and Ara h 9 (AUC 0.51). The ROC AUC results and ethnic comparisons for peanut-sensitised patients are depicted in Table 3 and Fig. 2.

Peanut component patterns
Peanut component testing in the overall study population (n=99)
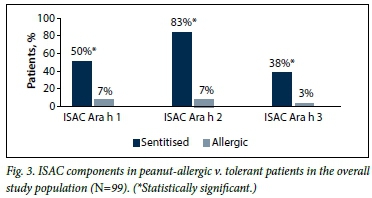
Of the 100 patients, 99 completed their peanut allergy investigations. In this group, the proportion of patients who tested positive was significantly higher for all three ISAC components in peanut-allergic v. tolerant patients (p<0.001 for all components Ara h 1, 2 and 3), as depicted in Fig. 3.
Peanut component testing in peanut-sensitised patients (n=44)
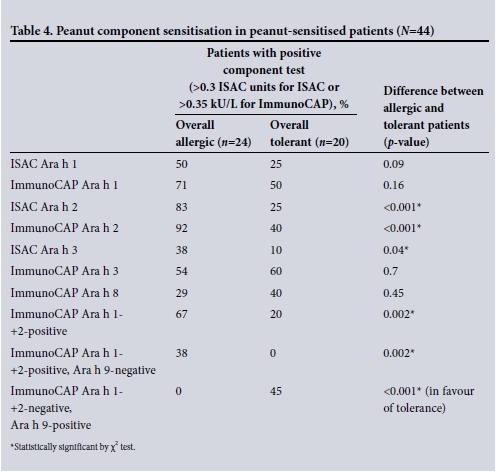
Overall, in the 44 peanut-sensitised patients, the most common peanut components by ImmunoCAP were Ara h 2 (69%), Ara h 1 (62%), Ara h 3 (58%), Ara h 9 (49%) and Ara h 8 (33%). ImmunoCAP Ara h 2 was 92% positive in peanut-allergic patients v. 40% positive in peanut-tolerant patients (p<0.001.) The significant trend in Ara h 2 positivity in allergic patients was followed in both ethnic groups: in Xhosa patients, 89% of allergic v. 47% of tolerant patients were Ara h 2-positive (p=0.04), and in mixedrace patients 93% of peanut-allergic and 20% of tolerant patients were Ara h 2-positive (p=0.001). The components ImmunoCAP Ara h 1 and ImmunoCAP Ara h 3 were not significantly different between allergic and tolerant patients in this peanut-sensitised group, both overall and in each ethnic group (Fig. 4). In all cases of peanut allergy with Ara h 1 and/or 3 positivity, Ara h 2 was also positive. Ara h 8 and 9 were higher in tolerant than allergic patients in both ethnic groups, and this reached statistical significance in the Xhosa group for Ara h 9, and was significantly more frequent in non-allergic patients (p=0.04). In all but one case of Ara h 8 positivity, Ara h 9 was also positive. In the Xhosa population, Ara h 9 therefore seems to be the most useful test in assessing tolerance by cross-reactivity.
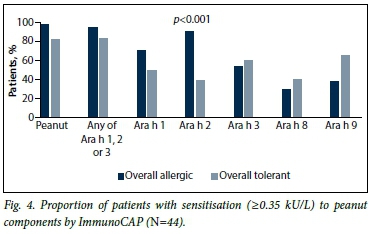
When analysing the best predictive combination of components for predicting peanut allergy, Ara h 2 positivity was 73% predictive of true peanut allergy in the overall population. If Ara h 1 and 2 were positive (n=16) this increased to 80%, and if Ara h 1 and 2 were positive and Ara h 9 was negative (n=9) the predictive value became 100% for peanut allergy in both ethnic groups.
By ISAC components, the proportion of patients with sensitisation to Ara h 2 and Ara h 3, as well as Ara h 1 in mixed-race patients only, was significantly higher in allergic patients. Peanut component distribution in allergic and tolerant patients is set out in Table 4.
Despite the overall superiority of Ara h 2 in differentiating allergy from tolerance in both ethnic groups, the Xhosa patients had a significantly higher false-positive rate. The likelihood of being peanut allergic given a positive ImmunoCAP Ara h 2 was significantly lower wSimilarly, for a positive ISAC Ara h 2 test, the chance of peanut allergy was 58% for Xhosa patients v. 100% for mixed-race patients (p=0.009).
Value of internationally derived 95% PPVs
The sensitivities, specificities and PPVs in diagnosing peanut allergy were analysed at the internationally derived levels of SPT and specific IgE widely used as 95% predictive for peanut allergy: these levels were 8 mm for SPT to peanut extract,[12] 14 kU/L for ImmunoCAP to peanut,[13] and 0.35 kU/L for ImmunoCap Ara h 2.[5] In the study population overall, these cut-off values produced PPVs of 85%, 77% and 73%, respectively, for SPT 8 mm, ImmunoCAP Peanut 14 kU/L and Ara h 2 0.35 kU/L (Table 5). These cut-off values proved useful in the mixed-race population (PPV 88%, 93% and 100%, respectively), but were of significantly less predictive value in the Xhosa population (80%, 57% and 53%, respectively).

In analysing the cut-off points producing the highest PPV for allergies, at an SPT of 11 mm, the PPV was 95% overall (100% for mixed-race and 88% for Xhosa patients).
For peanut-specific IgE, a maximum PPV of 80% was attained at a level of 15 kU/L (100% for mixed-race and 57% for Xhosa patients). For Xhosas, a maximum PPV of only 66% was attained at a level of 65 kU/L.
For ImmunoCAP Ara h 2, a PPV of 93% was attained at a level of 8 kU/L for the study population overall, at which level the PPV was 100% in the mixed-race group and 80% in Xhosas.
For ISAC Ara h 2, a 93% PPV was attained at a level of 1.8 ISAC units/L, at which level the mixed-race subgroup had a PPV of 100% and the Xhosas a PPV of 83%.
Severe peanut allergy
Five patients (4 of mixed race, 1 Xhosa) had symptoms of severe peanut allergy. All 5 were ImmunoCAP Ara h 2- and ISAC Ara h 2-positive, as well as ISAC Ara h 1-positive; 80% (4/5) were also ImmunoCAP Ara h 1- and Ara h 3-positive, and 80% (4/5) were ISAC Ara h 3-positive. The presence of ISAC Ara h 1 and ISAC Ara h 3 in addition to a positive ISAC Ara h 2 significantly increased the likelihood of the allergy being severe, as depicted in Table 6.
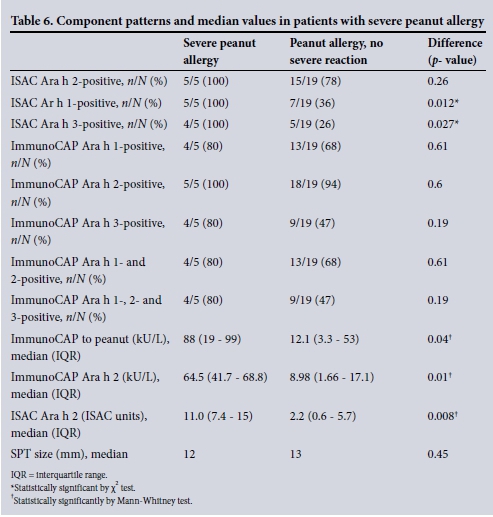
The median value for ImmunoCAP to whole peanut was significantly higher in children with severe peanut allergy than in those with an allergy but no anaphylactic symptoms (88 kU/L v. 12.1 kU/L; p=0.04). Similarly, the median value for ImmunoCAP Ara h 2 (64.5 kU/L v. 8.98 kU/L; p=0.01) and the median ISAC to Ara h 2 (11.0 ISAC units v. 2.2 ISAC units; p=0.009) were significantly higher in the patients with severe peanut allergy.
Comparing ISAC with ImmunoCAP tests for peanut allergy
In the peanut-sensitised subgroup (n=44), in which both ISAC and ImmunoCAP tests were performed, these two tests could be compared. The ISAC test proved less sensitive but more specific for peanut allergy than the ImmunoCAP tests. Of peanut-allergic patients, 88% tested positive to at least one ISAC component, and 83% to ISAC Ara h 2, while 96% tested positive to any ImmunoCAP component, and 92% to ImmunoCAP Ara h 2 (p=0.35). Testing by ISAC components alone would have missed 3 cases of peanut allergy (12.5%).
Median values for ImmunoCAP component levels were significantly higher than ISAC values for both allergic and tolerant patients. The median Ara h 2 by ImmunoCAP in peanut-allergic patients was 15.25 kU/L, v. 3.6 ISAC units (p<0.001). In tolerant patients, the median value for Ara h 2 by ImmunoCAP was 0.21 kU/L, v. 0 ISAC units (p<0.001).
Discussion
This is the first study in SA to explore challenge-proven peanut allergy, as well as component patterns, and therefore provides an opportunity to explore clinical and laboratory parameters that most accurately predict peanut allergy. The study was performed in children with moderate to severe AD, a population known to be at significantly higher risk of peanut allergy than the general population. Peanut sensitisation (44%) and allergy rates (24%) were high in our study population, yet the rate of asymptomatic sensitisation in our study was also significant (43% of sensitised patients were found to tolerate peanut). Diagnosing peanut allergy based on sensitisation alone leads to an unacceptable rate of overdiagnosis, unnecessary food elimination and anxiety. Moreover, avoiding foods unnecessarily in a child's diet may actually abrogate tolerance induction and conversely lead to higher eventual allergy rates. This has been demonstrated recently in the LEAP (Learning Early About Peanut Allergy) study, in which children at risk of peanut allergy, who were not yet significantly sensitised, had lower peanut allergy rates at 5 years of age if peanut had been introduced into their diet early and regularly.[3]
It is therefore important to identify clinical and laboratory parameters that may help differentiate true allergy from asymptomatic sensitisation, and allow patients to be selected more prudently for food challenges/ food introduction.
Our study showed that a history of perceived reaction to peanut carried only a 70% likelihood of a true allergy. Positive SPTs and ImmunoCAP Peanut were highly sensitive but not specific for peanut allergy. ROC curves in patients sensitised to peanut showed SPT size and Ara h 2 to be most valuable parameters in differentiating allergy from tolerance. However, the cut-off levels above which allergy is likely for these parameters were higher in our study than previously described.[12,13]
In this study, the pattern of component reactivity between the two ethnic groups was similar, with Ara h 2 being the superior component for differentiating true allergy from tolerance. Our study concurs with previous studies that Ara h 2 seems to be the most important peanut allergen.[5-8] Ara h 2 by ImmunoCAP as well as the ISAC test were significantly more frequently positive in peanut-allergic than in asymptomatically sensitised patients. ImmunoCAP Ara h 2 was positive in 92% of peanut-allergic patients, similar to recent studies in China[14] (87% positivity) and Japan[7] (88% Ara h 2-positive). However, the component reactivity among asymptomatically sensitised patients was significantly higher in the Xhosa population than in the mixed-race patients. In Xhosa patients shown to be sensitised to Ara h 2 by the ImmunoCAP test, the chance of having a peanut allergy was significantly lower (53%) than in the mixed-race group (93%). Food challenges may therefore be of particular importance in Xhosa patients with sensitisation to peanut. Ethnic differences in peanut sensitisation/ allergy patterns have been described in more detail in a previous article.[15]
Little additional benefit was shown from ImmunoCAP Ara h 1 and Ara h 3, which were not significantly higher in allergic patients than in tolerant patients in either ethnic group. ImmunoCAP Ara h 8 or 9 reactivity in the absence of Ara h 2 reactivity was highly suggestive of tolerance despite a positive SPT or ImmunoCAP to peanut. A cost-effective approach to component testing in this population would therefore be to test Ara h 2 and Ara h 9.
Ninety-five percent PPVs have been developed as a surrogate to oral food challenges, and also to minimise the overdiagnosis of food allergy based on laboratory results alone. Although there is some variation of PPVs for peanut allergy in the international literature, a specific IgE level of >14 kU/L is commonly used,[13] as is an SPT value of >8 mm.[12] In a recent British study, an excellent performance of Ara h 2 Immuno-CAP was attained, with 97.5% of patients correctly classified as peanut allergic v. tolerant at a cut-off of 0.35 kU/L.[5]
However, 95% PPVs may be age and population specific. The HealthNuts study, performed in infants in Australia, recently showed that an SPT of 8 mm had a PPV of 95% in this population, similar to previous studies; however, the serum IgE with a 95% PPV for peanut allergy was higher than previously quoted, at 34 kU/L.[4] A recent Japanese study has suggested an Ara h 2 cut-off of 4 kU/L to have a 91% PPV for peanut allergy,[16] and in a German study a 90% probability for positive peanut challenge for Ara h 2 was estimated at 14.4 kU/L.[17]
In our population, commonly used PPVs for SPT, ImmunoCAP Peanut and Ara h 2 performed suboptimally at 85%, 77% and 73%, respectively. Furthermore, there were significant ethnic differences, with the Xhosa patients faring even more poorly using these cut-offs. A high SPT value of >11 mm and ImmunoCAP Ara h 2 of >8 kU/L carried the best predictive value for peanut allergy. These findings suggest that 95% PPVs may have to be tailored to our local population as well as to the ethnicity of the patients, and larger studies in unselected population are needed in order to do this.
The 5 patients with severe peanut allergy tended to be sensitised to multiple storage proteins (Ara h 1, 2 or 3) and had higher median values for specific IgE to whole peanut and Ara h 2, but not for SPT size.
The use of ISAC technology offers a wider sensitisation profile for each patient and enhances diagnosis of cross-reactivity. ISAC and ImmunoCAP technologies have in the past shown high concordance in the measurement of IgE to peanut allergens.[18] Our results show that the ISAC test has lower sensitivity, higher specificity and generally lower values than the ImmunoCAP test, and missed 12.5% cases of peanut allergy. We therefore suggest that ISAC and ImmunoCAP tests are not equivalent or interchangeable.
Conclusion
Peanut allergy may be increasing in SA children. However, asymptomatic sensitisation is also common and we need tools to help differentiate true allergy from possible asymptomatic sensitisation. Widely used 95% PPVs for peanut allergy performed suboptimally in this study population of children with AD, particularly in Xhosa patients, and will need revision. A high SPT to peanut of >11 mm is valuable in diagnosing peanut allergy. Ara h 2 is the most valuable component for differentiating sensitisation from allergy in both Xhosa and mixed-race groups, little added benefit is derived from measuring Ara h 1 and 3, and Ara h 9 is the component most often associated with tolerance.
Acknowledgements. We would like to thank Thermo Fisher Scientific for sponsoring the specific IgE as well as ISAC reagents for the study, Prof. Heather Zar, Prof. Paul Potter, Prof. Nonhlanhla Khumalo and Sister Lucia Volkwyn for their input into the study, Bartha Fenemore for the laboratory work and Henri Carrera for assistance with statistics.
References
1. Venter C, Hasan AS, Grundy J, et al Time trends in the prevalence of peanut allergy: Three cohorts of children from the same geographical location in the UK. Allergy 2010;65(1):103-108. [http://dx.doi.org/10.1111/j.1398-9995.2009.02176.x] [ Links ]
2. Brough HA, Liu AH, Sicherer SH, et al. Atopic dermatitis increases the effect of peanut exposure to peanut antigen in dust on peanut sensitization and likely peanut allergy. J Allergy Clin Immunol 2015;135(1):164-170. [http://dx.doi.org/10.1016/j.jaci.2014.10.007] [ Links ]
3. Du Toit G, Roberts G, Sayre PH, et al. Randomized trial of peanut consumption in infants at high risk for peanut allergy. N Engl J Med 2015;372(9):803-813. [http://dx.doi.org/10.1056/NEJMoa1414850] [ Links ]
4. Peters RL, Allen KJ, Dharmage SC, et al. Skin prick test responses and allergen-specific IgE levels as predictors of peanut, egg and sesame allergy in infants. J Allergy Clin Immunol 2013;132(4):874-880. [http://dx.doi.org/10.1016/j.jaci.2013.05.038. [ Links ]]
5. Nicolaou N, Murray C, Belgrave D, et al. Quantification of specific IgE to whole peanut extract and peanut components in prediction of peanut allergy. J Allergy Clin Immunol 2011;127(3):684-685. [http://dx.doi.org/10.1016/j.jaci.2010.12.012] [ Links ]
6. Codreanu F, Collignon O, Roitel O, et al. A novel immunoassay using recombinant allergens simplifies peanut allergy diagnosis. Int Arch Allergy Immunol 2011;154(3):216-226. [http://dx.doi.org/10.1159/000321108] [ Links ]
7. Ebisawa M, Moverare R, Sato S, et al Measurement of Ara h 1-, 2-, and 3-specific antibodies is useful in diagnosis of peanut allergy in Japanese children. Pediatr Allergy Immunol 2012;23(6):573-581. [http://dx.doi.org/10.1111/j.1399-3038.2012.01332.x] [ Links ]
8. Hong X, Caruso D, Kumar R, et al. IgE, but not IgG4, antibodies to Ara h 2 distinguish peanut allergy from asymptomatic peanut sensitization. Allergy 2012;67(12):1538-1546. [http://dx.doi.org/10.1111/all.12047] [ Links ]
9. Krause S, Reese G, Randow S, et al. Lipid transfer protein (Ara h 9) as a new peanut allergen relevant for a Mediterranean allergic population. J Allergy Clin Immunol 2009;124(4):771-778. [http://dx.doi.org/10.1016/j.jaci.2009.06.008] [ Links ]
10. Maeda Y, Ono E, Fukutomi Y, et al. Correlations between alder specific IgE and alder-related tree pollen specific IgE by RAST method. Allergol Int 2008;57(1):79-81. [http://dx.doi.org/10.2332/allergolint.o-07-496] [ Links ]
11. Gray CL, Levin ME, Zar H, et al. Food sensitization and allergy in South African children with atopic dermatitis. Paediatr Allergy Immunol 2014;25(6):572-579. [http://dx.doi.org/10.1111/pai.12270] [ Links ]
12. Sporik R, Hill DJ, Hosking CS. Specificity of allergen skin testing in predicting positive open food challenges to milk, egg and peanut in children. Clin Exp Allergy 2000;30(11):1540-1546. [http://dx.doi.org/10.1046/j.1365-2222.2000.00928.x] [ Links ]
13. Sampson HA. Utility of food-specific IgE concentrations in predicting symptomatic food allergy. J Allergy Clin Immunol 2001;107(5):891-896. [http://dx.doi.org/10.1067/mai.2001.114708] [ Links ]
14. Chiang WC, Pons L, Kidon MI, et al. Serological and clinical characteristics of children with peanut sensitization in an Asian community. Pediatr Allergy Immunol 2010;21(2):e429-e438. [http://dx.doi.org/10.1111/j.1399-3038.2009.00930.x] [ Links ]
15. Gray CL, Levin ME, du Toit G. Ethnic differences in peanut allergy patterns in South African children with atopic dermatitis. Pediatr Allergy Immunol 2015;26(8):721-730. [http://dx.doi.org/10.1111/pai.12459] [ Links ]
16. Ebisawa M, Moverare R, Sato S, et al. The predictive relationship between peanut- and Ara h 2-specific serum IgE concentrations and peanut allergy. J Allergy Clin Immunol Pract 2015;3(1):131-132. [http://dx.doi.org/10.1016/j.jaip.2014.10.014] [ Links ]
17. Beyer K, Grabenhenrich L, Hartl M, et al Predictive values of component-specific IgE for the outcome of peanut and hazelnut food challenges in children. Allergy 2015;70(1):90-98. [http://dx.doi.org/10.1111/all.12530] [ Links ]
18. Gadisseur R, Chapelle JP, Cavalier E. A new tool in the field of in-vitro diagnosis of allergy: Preliminary results in the comparison of ImmunoCAP© 250 and ImmunoCAP© ISAC. Clin Chem Lab Med 2011;49(2):277-280. [http://dx.doi.org/10.1515/CCLM.2011.052. [ Links ]]
 Correspondence:
C Gray
claudiagray.paediatrics@gmail.com
Accepted 29 September 2015.

