


Serviços Personalizados
Artigo
 Inglês (pdf)
 Artigo em XML
 Referências do artigo
Indicadores

Links relacionados
-
 Citado por Google
 -
 Similares em Google
Compartilhar

 Permalink
SAMJ: South African Medical Journal
versão On-line ISSN 2078-5135
versão impressa ISSN 0256-9574
SAMJ, S. Afr. med. j. vol.105 no.11 Pretoria Nov. 2015
http://dx.doi.org/10.7196/SAMJ.2015.V105I11.9780
RESEARCH
Childhood cancer incidence in South Africa, 1987 - 2007
D C StefanI, II; D K StonesIII; R D WainwrightIV; M KrugerV; A DavidsonVI; J PooleVII; G P HadleyVIII; D FormanIX; M ColombetX; E Steliarova-FoucherXI
IMD, PhD;Department of Paediatrics and Child Health, Tygerberg Hospital and Faculty of Medicine and Health Sciences, Stellenbosch University, Tygerberg, Cape Town, South Africa
IIMD, PhD; South African Medical Research Council, Cape Town, South Africa
IIIMB ChB, DCH, MMed (Paed), FCP (SA); Department of Paediatrics and Child Health, Universitas Academic Hospital Complex and Faculty of Health Sciences, University of the Free State, Bloemfontein, South Africa
IVMB ChB, FCP; Paediatric Haematology and Oncology Unit, Department of Paediatrics, Chris Hani Baragwanath Academic Hospital and Faculty of Health Sciences, University of the Witwatersrand, Johannesburg, South Africa
VMB ChB, MMed (Paed), FCP, M Phil, PhD; Department of Paediatrics and Child Health, Tygerberg Hospital and Faculty of Medicine and Health Sciences, Stellenbosch University, Tygerberg, Cape Town, South Africa
VIMB ChB, DCH (SA), FCPaed (SA), Cert Med One (Paed) (SA), M Phil; Haematology-Oncology Service, Red Cross War Memorial Children's Hospital, and Department of Paediatrics and Child Health, Faculty of Health Sciences, University of Cape Town, South Africa
VIIMB BCh, FCP (SA) Paed;Paediatric Haematology/Oncology, Department of Paediatrics, Charlotte Maxeke Johannesburg Academic Hospital, Johannesburg, South Africa
VIIIMB ChB FRCS (Edin), FCS (SA); Department of Paediatric Surgery, Inkosi Albert Luthuli Central Hospital, Durban, South Africa
IXBA, PhD, FFPHM; International Agency for Research on Cancer, Lyon, France
XMSc; International Agency for Research on Cancer, Lyon, France
XIPhD, RNDr, MSc; International Agency for Research on Cancer, Lyon, France
ABSTRACT
BACKGROUND: Childhood cancer is an emerging problem in Africa. Its extent is hazy because data are scarce, but it should be addressed. This is the first report from the South African Children's Tumour Registry (SACTR), which covers the whole of South Africa (SA). It provides minimal estimates of cancer incidence and discusses the challenges of cancer surveillance and control in a child population in a middle-income country. Only about 2% of the African population is covered by cancer registries producing comparable incidence data.
OBJECTIVE: To present and interpret incidence patterns and trends of childhood cancer over a 21-year period. The results should raise awareness of the problem of childhood cancer in an African population and provide sensible data for taking this problem in hand.
METHODS: All eligible and validated cancer cases registered in the SACTR over the period 1987 - 2007 and classified according to the International Classification of Childhood Cancer were included. Population data were retrieved from official sources and estimated for the population subcategories. Incidence rates were standardised to the world standard and time trends were evaluated using joinpoint models, adjusting for sex and age.
RESULTS: Based on the 11 699 cases, the overall age-standardised average annual incidence rate was 45 per million. Threefold differences in the overall incidence rates were observed between the ethnic groups, ranging from 116 for whites to 37 for black Africans, and they differed by diagnostic group. Differences between the nine provinces of SA relate to the ethnic composition and prevailing socioeconomic status. The overall incidence rate declined by 1.2% per year for the whole country (p<0.01). However, the decline was mainly observed during the first few years of the study period, after which rates stabilised or increased.
CONCLUSIONS: Diagnosis and notification of childhood cancer should improve. The differences in incidence between ethnic groups suggest the priorities for cancer control.
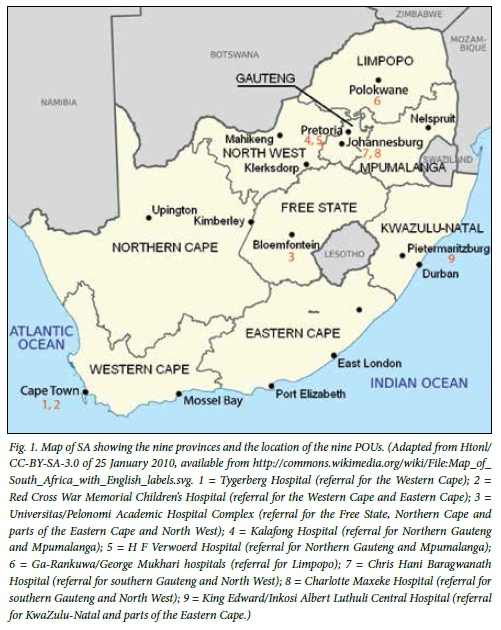
South Africa (SA), located at the southern tip of Africa, is divided into nine provinces (Fig. 1). The Western Cape and Gauteng provinces are the most densely populated regions and, together with KwaZulu-Natal Province, contribute two-thirds of the economy of the country.[1]
Of the total SA population of 52 million, 49% are males. About 79% are black African, 9% white, 2.5% Asian or Indian and 9% coloured. The population is young: 73% are aged under 40 years, 30% under 15 and 11% under 5. The birth rate is 19/1 000, with an infant mortality rate of 42/1 000 live births; the under-5 mortality rate is 60/1 000 live births. The most common causes of death in children under 5 years of age are diseases of infectious origin and malnutrition.[1]
Over 80% of South Africans have no health insurance, and 15% pay for private insurance.[2] In public hospitals treatment is free for all children below the age of 6 years, while modest income-based contributions are required for older children. A new National Health Insurance scheme to provide basic health cover for all will be implemented shortly, according to the policy Green Paper of the National Department of Health published in 2011. The Health System Trust assessed in 2012 that there are 3 880 primary public healthcare facilities. These may refer patients with a diagnosis of cancer to a secondary hospital. If the diagnosis is confirmed, paediatric patients are referred to the relevant paediatric oncology unit (POU) for treatment.
Africa has 1 billion inhabitants, of whom 41% are younger than 15 years of age.[3] Over 36 000 children are diagnosed with cancer annually, and their number is increasing with improving control of infectious diseases. In any given year, the ratio of children who die from cancer represents 60% of those diagnosed; the equivalent figure is 20% or less in developed countries of Europe and North America.[4] Data on which the above figures are based are extremely scarce. Only about 2% of the total population of Africa is covered by population-based cancer registries producing comparable incidence figures.[5] Collection of data on childhood cancers throughout the country was started in 1987 by the South African Children's Cancer Study Group (SACCSG) as a collaboration between the nine referral POUs shown in Fig. 1.
The objective of the South African Children's Tumour Registry (SACTR) is to describe the cancer burden in the national childhood population. In this first report from the SACTR, we aimed to present and interpret incidence patterns and trends of childhood cancer over a 21-year period (1987 - 2007) in this ethnically diverse population. The results should raise awareness of the problem of childhood cancer in an African population and provide sensible data for dealing with this problem.
Methods
The South African Children's Tumour Registry
During 1987 - 2007, the nine POUs (Fig. 1) treated children with cancer and provided data to the SACTR. More recently, the SACTR data sources have included two new satellite units in the Eastern Cape Province and one in KwaZulu-Natal. Each POU sends its data to the central SACTR office as electronic files or as physical records by registered post. In addition to the POU sites, data also come from several oncologists treating children with cancer in private healthcare institutions and from some private paediatricians.
In the central registry, the relevant information is recorded into the electronic database of a customised CanReg 4 computer program, adapted for childhood cancer by the International Agency for Research on Cancer (IARC). Data are validated in collaboration with the data originators. Duplicate registration is prevented by manual matching of new cases. Relapses are matched with earlier registration of the same patient and flagged. Since 2002, information on tumour site, morphology and behaviour has been coded according to the International Classification of Diseases for Oncology, 3rd edition (ICD-O-3).[6] The cases originally coded to the ICD-O-2[7] were recoded to the ICD-O-3 in agreement with the original medical records. The registry respects confidentiality principles at all times. Identifying information is used for data input, quality control and follow-up. In all reports only grouped data are presented.
Cancer cases
The SACTR records all malignant tumours, as well as non-malignant central nervous system (CNS) tumours, occurring in children aged under 15 years of age who are resident in SA. Children are considered resident if their parents have been resident for >12 months or if they themselves have lived in SA for at least 6 months, according to the identity documents examined by designated administrative personnel.
Records of all patients registered during the period 1987 - 2007 included identification number, province of residence, gender, age in years, ethnic group, dates of birth and diagnosis, tumour site, histological classification, behaviour and most valid basis of diagnosis. The extracted data were verified in collaboration with the IARC and converted to the International Classification of Childhood Cancer, 3rd edition (ICCC-3).[8]
Population data
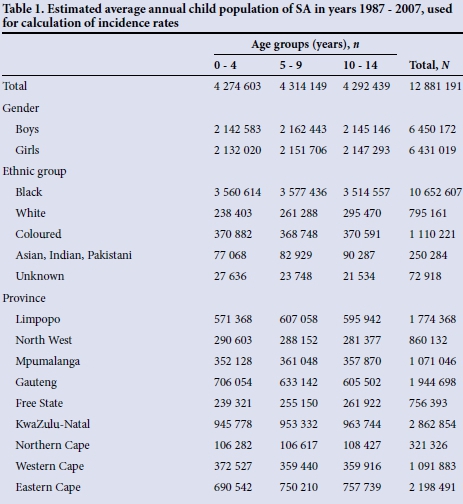
Population data were obtained from the United Nations[9] and from Statistics South Africa,[1] although these sources did not provide figures for all cross-categories of gender, age, ethnic group and province in each calendar year. We were able to extract 1 201 data cells within the study period and a further 122 from the preceding or succeeding years. We have estimated the missing population figures by linear interpolation or extrapolation of available data, using the relevant gender, age, ethnic and province categories. The derived population estimates are based on the assumptions of linear population growth within the population subcategories over the periods with unavailable data. The estimated population data used for calculating the incidence rates in this study are shown in Table 1.
Analysis of incidence rates
Incidence rates are expressed as an average annual number of cases per million person-years.[10] The age-standardised average annual incidence rate (ASR) for the age range 0 - 14 years is the weighted average of the age-specific incidence rates using the weights of the world standard population for the age groups 0 - 4, 5 - 9 and 10 - 14 years.
The parameters of the incidence trends were estimated using software for analysis of trends using Jointpoint Regression Program 3.5.4 of 2012 developed at the National Cancer Institute, Bethesda, USA. These analyses were based on the crude rate, assuming Poisson variance of counts. The joinpoints were identified using the Hudson method and their optimal number was determined by the permutation test.
Results
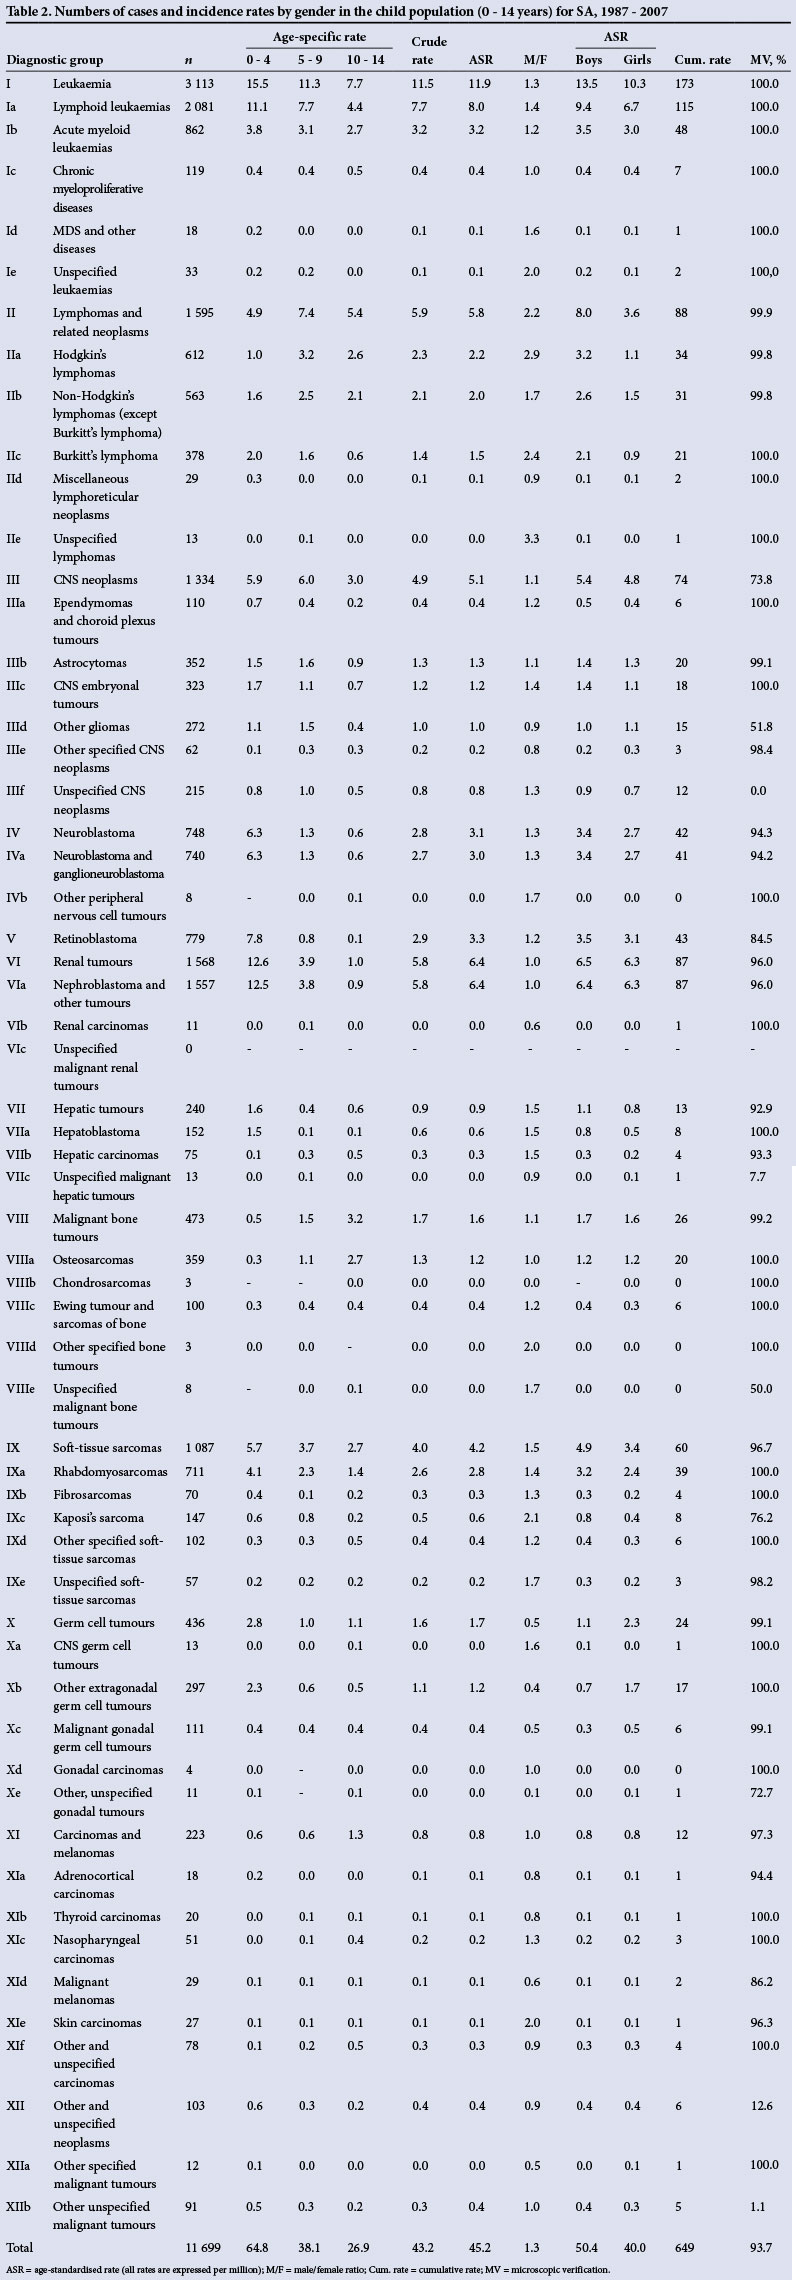
During the period 1987 - 2007, there were 11 712 cancer cases reported to the registry. Thirteen of these were non-malignant tumours in sites other than the CNS and were excluded from the analyses. No second primary tumours were recorded. Overall, 93.7% of cases were microscopically verified and in 0.7% of cases (n=77) the basis of the diagnosis was unknown. There were no cases identified from a death certificate only. The date of birth was imprecise in approximately 13% of all cases (day and month missing). There were 301 cases (2.6%) in which the patient was considered too young or too old for the given cancer type. One case of mixed carcinoma of major salivary gland in an infant was checked and confirmed. Less than 4% of cases (n=452) were classified into unspecified diagnostic categories. Of the tumours that occurred in the brain, 6.7% (n=90 cases) were non-malignant. Information on laterality was available for 61.2% of retinoblastomas, 56.9% of nephroblastomas and 64.3% of gonadal tumours.
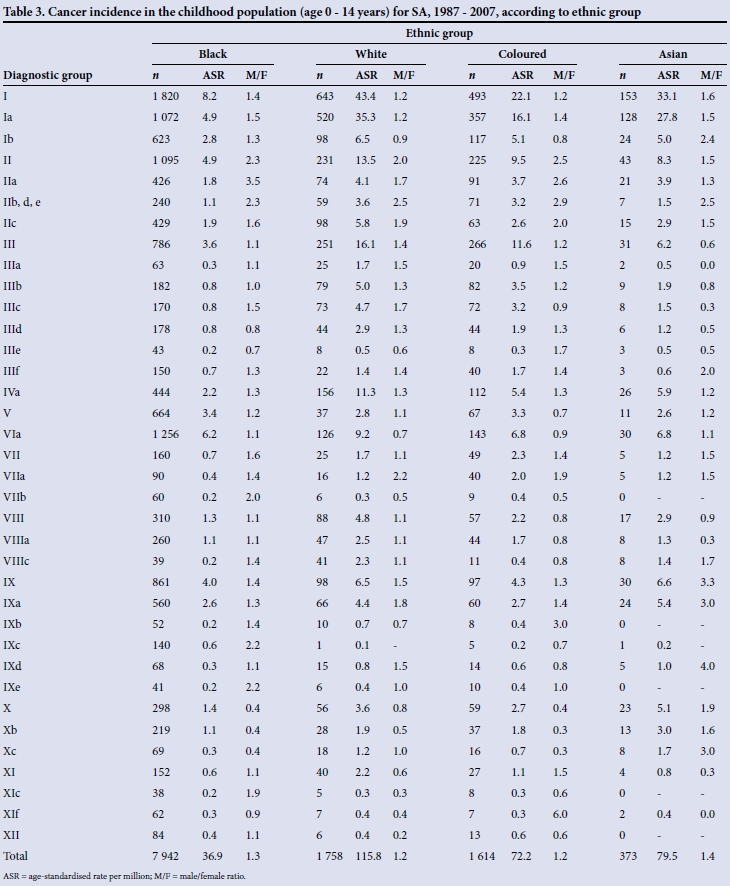
Information on ethnicity was unavailable in 12 cases (0.1%). Of all cases, 67.9% occurred in black African, 15.0% in white, 13.8% in coloured and 3.2% in Asian/Indian children. The overall male/female ratio was 1.3, and varied by ethnic group (Table 3).
Based on the 11 699 cases included in the analyses, the overall ASR was 45.2 per million (Table 2). ASRs differed between the individual diagnostic groups and the ethnic groups (Table 3). The incidence rates were highest among white children in almost all diagnostic groups examined, except retinoblastoma and hepatic tumours (highest in coloured children), germ cell tumours (highest in Asian/Indian children) and Kaposi's sarcoma (highest in black Africans).
The incidence rates differed between the provinces fivefold (data not shown); the highest ASRs per million were seen in the Western Cape (88.4) and Gauteng (81.0). The Western Cape was the province with the lowest proportion of black African (33%) and the largest proportion of coloured (49%) and white (16%) ethnicity. Gauteng also had a lower proportion of black African (77%) and a larger proportion of white (9%) populations compared with the other provinces. The lowest incidence rates were observed in the Eastern Cape (21.8) and Limpopo provinces (18.4). The overall ASRs were intermediate in the Northern Cape (52.9), Free State (64.3), KwaZulu-Natal (39.0), Mpumalanga (26.0) and North West (26.4) provinces.
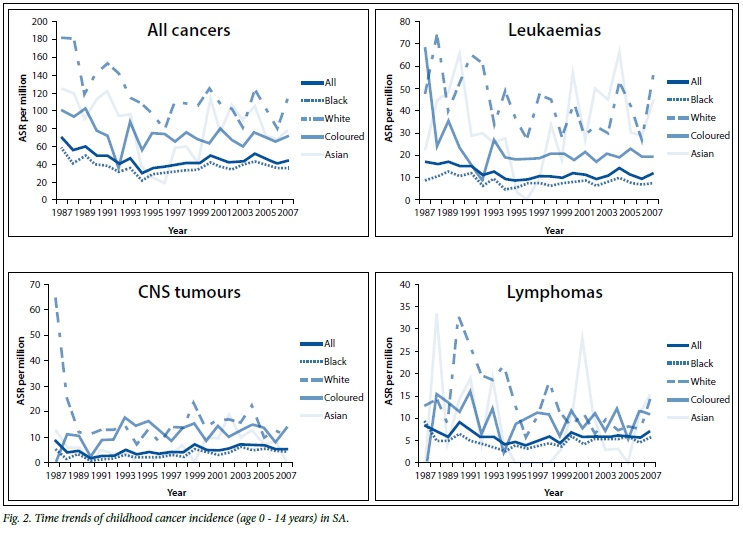
A set of graphs (Fig. 2) shows the incidence trends for selected tumour groups. Over the 21-year study period, the overall incidence rate (adjusted for age group and gender) was seen to decline by 1.2% per year for the whole country (p<0.01). However, the decline was not homogeneous during the study period. Overall rates decreased markedly between 1987 and 1994 by 8.1% per year (p<0.001), and increased thereafter by 1.9% per year (p=0.002). Leukaemia dropped by 7.8% per year (p<0.001) to 1995 and increased by 1.7% per year (p=0.082) thereafter. The incidence of lymphomas decreased by 7% per year (p<0.004) until 1995 and then increased by 2.7% per year (p=0.03). The dramatic decline in the incidence of CNS tumours (-28.3; p=0.037) was reversed from 1990, with a sustained increase of 4.7% per year (p<0.001).
Discussion
This is the first report of the SACTR, a member of the African Network of Cancer Registries (http://afcrn.org/) since its creation in January 2011. Compared with Globocan 2012,[4] where the estimated incidence of all paediatric cancers (0 - 14 years) in Africa is 96 and 73 per million for boys and girls, respectively, the rates we observed are much lower. It should, however, be noted that the Globocan estimates are largely based on data from regional cancer registries, most of them urban, and they may therefore overestimate the national cancer incidence. The rural areas show lower rates.[11]
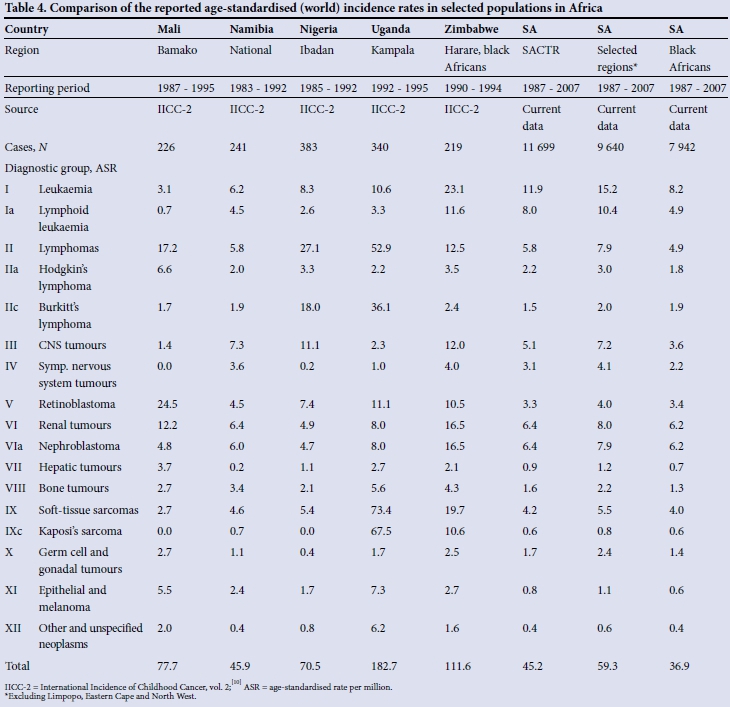
The observed overall ASR of 36.3 per million for black Africans is nevertheless low in comparison with the rates reported from Malawi (220 per million for males), Uganda (140 per million for females) or Zimbabwe[10] (Table 4). The lack of cases pertains predominantly to lymphomas, CNS tumours, retinoblastomas, bone tumours, carcinomas and possibly Kaposi's sarcomas. Burkitt's lymphoma is the most common childhood cancer in holoendemic malaria regions in Africa, with a strong association with both intense malaria infection and Epstein-Barr virus.[12,13] In SA, malaria is present only in very small areas and Burkitt's lymphoma is sporadic. In sub-Saharan Africa, with a high prevalence of HIV, the incidence of Kaposi's sarcoma in children has increased considerably over the past 30 years. However, even if the prevalence of HIV in SA (17.9%)[14] is higher than in Uganda (7.2%)[10] or Zambia (12.7%),[15] the incidence rates of Kaposi's sarcoma in SA are much lower than in other southern African countries.[11] This may be explained by the comparatively low rates of endemic Kaposi's sarcoma in SA[16] and the lower prevalence of human herpesvirus infection in SA than, for example, in Uganda.[17] The overall incidence rates for the white population (ASR 116.2 per million) are rather low, but comparable with rates observed in the 1980s in some populations of South America (ASR 118 - 136 per million) and Eastern Europe (ASR ~125 per million).[10] The higher incidence rates in the white compared with the black African population may be explained by a better rate of diagnosis and access to tertiary healthcare treatment in a POU. The cultural background and genetic factors may also be relevant, as the higher incidence rates in the white population, compared with the black, are also observed in the USA.[10] Our rates for the Asian/Indian ethnic group (ASR 79 per million) are at the lower end of the ASR range observed in India and the developing countries of South-East Asia in the 1980s or early 1990s (74 - 110 per million).[10] As black African children constitute two-thirds of the total dataset, their very low registration rates impact heavily on the national incidence estimates.
The low incidence rates may be partly explained by under-diagnosing, misdiagnosing or under-reporting. The diagnosis of many tumours, in particular those of the CNS, may be delayed as the appropriate technology required to confirm the diagnosis is not always available.[18] In many rural areas there is also cultural pressure that traditional healers should be consulted before modern medical services are accessed. All these obstacles lead to children dying without a proper diagnosis, referral and treatment. For the majority of SA citizens, the public health system is the only means to access the POUs. Once the diagnosis has been suspected or confirmed, patients are likely to be referred to and registered by a POU.
It is possible that some cases are diagnosed but not registered. The lack of medical services in some provinces impacts on both access to care and the likelihood of being diagnosed and registered. Although under-registration should not differ between the ethnic groups, reporting may be more difficult in more deprived areas where the proportion of black African population is larger. Limpopo and the Eastern Cape have the highest proportion of population (55%) with no income, while in the two provinces with the highest incidence rates, Gauteng and Western Cape, this proportion is lower (41%).[1] Table 4 shows the impact of exclusion of the provinces with lowest rates.
There are a number of smaller centres and individual practices that are able to diagnose and treat children with cancer but do not necessarily send data to the SACTR. Although the SACCSG encourages reporting to the SACTR, the registration process remains challenging. As a consequence, the rates reported here should be considered minimal estimates of the true status.
Deaths are certified in SA, and there is a central collection of death certificates. The SACTR did not attempt to link these records with the registry database, as the quality of their information has been assessed as low.[19] In countries where death data are available to cancer registries, these may help to achieve higher registration completeness, provided the causes of death are correctly assessed and coded.
The correct incidence estimates depend on the registration quality as much as on the population data. We had to estimate figures for a large number of categories under many assumptions, which may have influenced the incidence rates in some ethnic groups and provinces more than others. There could also have been a mismatch of the classification of ethnic group or province between the official data and the SACTR, which would have affected the calculated rates in subgroups.
Internationally, ASRs for childhood cancers have tended to increase in recent decades, while our data show a decrease in incidence rates over the study period. The overall decline was caused by the high rates observed at the beginning of the period. In particular, the dramatic decline in the rates of the CNS tumours in whites between 1987 and 1989 may suggest a break in links between the registry and the neurosurgical departments. This pattern could also reflect inclusion of prevalent cases in the first years of registration, typical of new cancer registries. The annual rates stabilised for several tumour types from 1995, and further close monitoring of the trends is required.
National cancer registration for all ages was launched in SA in 1986 under the auspices of the National Health Laboratory Service. However, this initially relied on voluntary reporting, which mostly came from pathological laboratories and isolated physicians. Clinically diagnosed cases (6% in the present series) were therefore not registered. The National Cancer Registry (NCR) was revitalised on the initiative of the Department of Health on 26 April 2011 with Government Notice No. R.380, stipulating compulsory reporting of all cancers to the NCR based in Johannesburg.
Since 2011, POUs have submitted the same dataset to both the NCR and the SACTR every 3 months. The databases of both cancer registries should therefore be equally complete and include the same registered tumours. However, from a recently published report[20] based on data from the NCR for 2000 - 2006 it became evident that further efforts are required to unify the registration procedures and strengthen collaboration between the two cancer registries. Although the overall rate they reported (45.7 per million) was very similar to ours (45.2/million), there are differences in the incidence rates of several diagnostic groups. These differences may be caused by the use of additional data sources by the NCR, which would explain the higher incidence rates of lymphomas, epithelial neoplasms, soft-tissue sarcomas and bone tumours. The SACTR may be more efficient in excluding unconfirmed diagnoses, metastatic extension of primary tumours, duplicate registrations of such tumours, etc. On the other hand, the SACTR reports higher incidence rates of leukaemia and solid tumours characteristic of the paediatric age range, such as retinoblastoma, neuroblastoma or renal tumours.
The continued work of the SACTR is required for multiple reasons. First, the data on childhood cancers are collected through the network of the POUs that ensures a link to detailed clinical information on each patient, which is not mandated by the NCR. Supporting the SACTR enables the SACCSG to have the feedback required for deciding on new treatment protocols, improving data quality and describing outcome results in terms of survival. The POUs also strive to acquire data on some patients from private practice through the paediatrician links, which would not necessarily be possible through the general cancer registry with an at least 20-fold higher volume of cases. Specific focus on childhood cancer helps to improve registration in this age range. The NCR continues to present itself as a pathology cancer registry,'211 and no report on cancer incidence for all ages has been produced to date. It is likely that only the childhood cancer data are of sufficient quality, to a large extent attributable to the work of the SACTR and SACCSG.
Conclusions
The SACTR is the first paediatric population-based cancer registry established in Africa, and it has national coverage. Despite uncertainties inherent in the presented data, the SACTR constitutes an invaluable resource of information for policy planning and research. This report challenges us to improve the diagnosis and notification of childhood cancer to both the NCR and the SACTR, and to tackle the ethnic inequalities in access to appropriate care. Continuous collection of data is indispensable for evaluation of demographic, geographical and temporal variations. Ultimately this will lead to earlier diagnosis, better management, and improved outcomes for children with cancer in SA.
Acknowledgments. The following colleagues played a prominent role in establishing and supporting the SACTR: Ruellyn Cockcroft, founder of the SACCSG tumour registry in 1987 - H F Verwoerd Hospital 1987 - 1990, Ga-Rankuwa Hospital 1990 - 1996; Paddy Hartley and Cyril Karabus - Red Cross War Memorial Children's Hospital; Richard Cohn - Johannesburg (until 1997); Lourens de Jager - H F Verwoerd Hospital 1993 - 2000, and his private patients since 2006; East London - Sydney Smith and Mark Painter; Tygerberg Hospital - Peter Hesseling and Glyn Wessels; Polokwane as satellite till 2009, thereafter independent - Oloko Wedi; Durban - Joan Naidoo until 1993 and R Thejpal from 1993; Bloemfontein - Sydney Smith until 1990, and all consultants and medical officers in the department from 1987 to 2007; Rina Nortje - secretary, SACTR.
References
1. Statistics South Africa. www.statssa.gov.za/publications/P0302/P03022014.pdf (accessed 3 March 2015). [ Links ]
2. World Health Organization. Bridging the gap in South Africa. Bull World Health Organ 2010;88(11):803-804. [http://dx.doi.org/10.2471/BLT.10.021110] [ Links ]
3. United Nations, Department of Economic and Social Affairs, Population Division. World Population Prospects: The 2012 Revision, DVD Edition. New York: United Nations, 2013. [ Links ]
4. International Agency for Research on Cancer. Globocan 2012: Estimated Cancer Incidence, Mortality and Prevalence Worldwide in 2012. http://globocan.iarc.fr/Default.aspx (accessed 2 October 2012). [ Links ]
5. Forman D, Bray F, Brewster D, et al. Cancer Incidence in Five Continents. Vol. X. Lyon: International Agency for Research on Cancer, 2014. [ Links ]
6. Fritz A, Percy C, Jack A, et al. International Classification of Diseases for Oncology. 3rd ed. Geneva: World Health Organization, 2000. [ Links ]
7. Percy C, van Holten V, Muir C. International Classification of Diseases for Oncology. 2nd ed. Geneva: World Health Organization, 1992. [ Links ]
8. Steliarova-Foucher E, Stiller C, Lacour B, Kaatsch P. International Classification of Childhood Cancer, third edition. Cancer 2005;103(7):1457-1467. [http://dx.doi.org/10.1002/cncr.20910] [ Links ]
9. United Nations Department of Economic and Social Affairs. Population Division. http://www.un.org/en/development/desa/population/ (accessed 2 October 2015). [ Links ]
10. Parkin DM, Kramarova E, Draper GJ, et al. International Incidence of Childhood Cancer. Lyon: International Agency for Research on Cancer, 1998. [ Links ]
11. Somdyala NI, Bradshaw D, Gelderblom WC, Parkin DM. Cancer incidence in a rural population of South Africa, 1998-2002. Int J Cancer 2010;127(10):2420-2429.[http://dx.doi.org/10.1002/ijc.25246] [ Links ]
12. Van den Bosch CA. Is endemic Burkitt's lymphoma an alliance between three infections and a tumour promoter? Lancet Oncol 2004;5(12):738-746. [http://dx.doi.org/10.1016/S1470-2045(04)01650-X] [ Links ]
13. Geser A, Brubaker G, Draper CC. Effect of a malaria suppression program on the incidence of African Burkitt's lymphoma. Am J Epidemiol 1989;129(4):740-752. [ Links ]
14. Minhas V, Crabtree KL, Chao A, et al. The Zambia Children's KS-HHV8 Study: Rationale, study design, and study methods. Am J Epidemiol 2011;173(9):1085-1092. [http://dx.doi.org/10.1093/aje/kwq465] [ Links ]
15. AVERT. HIV and AIDS in Sub-Saharan Africa. http://www.avert.org/hiv-aids-sub-saharan-africa.htm (accessed 2 October 2015). [ Links ]
16. Cook-Mozaffari P, Newton R, Beral V, Burkitt DP. The geographical distribution of Kaposi's sarcoma and of lymphomas in Africa before the AIDS epidemic. Br J Cancer 1998;78(11):1521-1528. [http://dx.doi.org/10.1038/bjc.1998.717] [ Links ]
17. Dollard SC, Butler LM, Jones AM, et al. Substantial regional differences in human herpesvirus 8 seroprevalence in sub-Saharan Africa: Insights on the origin of the 'Kaposi's sarcoma belt. Int J Cancer 2010;127(10):2395-2401. [http://dx.doi.org/10.1002/ijc.25235] [ Links ]
18. Stefan DC, Siemonsma F. Delay and causes of delay in the diagnosis of childhood cancer in Africa. Pediatr Blood Cancer 2011;56(1):80-85. [http://dx.doi.org/10.1002/pbc.22714] [ Links ]
19. Mathers CD, Fat DM, Inoue M, Rao C, Lopez AD. Counting the dead and what they died from: An assessment of the global status of cause of death data. Bull World Health Organ 2005;83(3):171-177. [ Links ]
20. Erdmann F, Kielkowski D, Schonfeld SJ, et al. Childhood cancer incidence patterns by race, sex and age for 2000-2006: A report from the South African National Cancer Registry. Int J Cancer 2015;136(11):2628-2639. [http://dx.doi.org/10.1002/ijc.29308] [ Links ]
21. Babb C, Urban M, Kielkowski D, Kellett P. Prostate cancer in South Africa: Pathology based national cancer registry data (1986-2006) and mortality rates (1997-2009). Prostate Cancer 2014;2014:419801. [http://dx.doi.org/10.1155/2014/419801, http://dx.doi.org/10.1155/2014/391257] [ Links ]
 Correspondence:
D C Stefan
cristina.stefan@mrc.ac.za
Accepted 29 June 2015.

