


Serviços Personalizados
Artigo
 Inglês (pdf)
 Artigo em XML
 Referências do artigo
Indicadores

Links relacionados
-
 Citado por Google
 -
 Similares em Google
Compartilhar

 Permalink
SAMJ: South African Medical Journal
versão On-line ISSN 2078-5135
versão impressa ISSN 0256-9574
SAMJ, S. Afr. med. j. vol.105 no.10 Pretoria Out. 2015
http://dx.doi.org/10.7196/SAMJNEW.8087
RESEARCH
Meeting national response time targets for priority 1 incidents in an urban emergency medical services system in South Africa: More ambulances won't help
C SteinI; L WallisII; O AdetunjiIII
IPhD; Department of Emergency Medical Care, Faculty of Health Sciences, University of Johannesburg, South Africa
IIMB ChB, FCEM, MD; Division of Emergency Medicine, Faculty of Health Sciences, University of Cape Town, South Africa
IIIPhD; Department of Industrial and Systems Engineering, Faculty of Engineering, Built Environment and Information Technology, University of Pretoria, South Africa
ABSTRACT
BACKGROUND: Response time is viewed as a key performance indicator in most emergency medical services (EMS) systems.
OBJECTIVE: To determine the effect of increased emergency vehicle numbers on response time performance for priority 1 incidents in an urban EMS system in Cape Town, South Africa, using discrete-event computer simulation.
METHOD: A simulation model was created, based on input data from part of the EMS operations. Two different versions of the model were used, one with primary response vehicles and ambulances and one with only ambulances. In both cases the models were run in seven different scenarios. The first scenario used the actual number of emergency vehicles in the real system, and in each subsequent scenario vehicle numbers were increased by adding the baseline number to the cumulative total.
RESULTS: The model using only ambulances had shorter response times and a greater number of responses meeting national response time targets than models using primary response vehicles and ambulances. In both cases an improvement in response times and the number of responses meeting national response time targets was observed with the first incremental addition of vehicles. After this the improvements rapidly diminished and eventually became negligible with each successive increase in vehicle numbers. The national response time target for urban areas was never met, even with a seven-fold increase in vehicle numbers.
CONCLUSION: The addition of emergency vehicles to an urban EMS system improves response times in priority 1 incidents, but alone is not capable of the magnitude of response time improvement needed to meet the national response time targets.
Access to emergency care, including that delivered outside hospital, is guaranteed for all South Africans under section 27 of the Constitution.[1] A logical component of this notion of access to emergency care is that the care provided should be timely, as determined by the acuity of the patient's condition.[2] Indeed, timeliness of care goes beyond access to healthcare; it has also been identified as an important dimension of healthcare quality.[3]
Although questions remain about the impact of emergency medical services (EMS) response times on patient outcomes in a range of high-acuity conditions, response time is still viewed as a key performance indicator in most EMS systems,[4,5] expressed through response time targets. In South Africa (SA), national response time targets exist and are used as a standard against which to measure the performance of EMS provided by the provinces. In urban areas, 90% of high-acuity (priority 1, P1) incidents should be responded to within 15 minutes, and all other incidents should be responded to within 60 minutes.[6-8] In this context, 'response time' refers to the time interval between receipt of a call for emergency assistance at an emergency dispatch centre and arrival of the first EMS vehicle at the corresponding incident location.
Annual reports published by provincial departments of health detail their compliance with the response time targets. Review of these annual reports for three provinces with the largest urban centres (Gauteng, Western Cape and KwaZulu-Natal) over the past 2 years shows that none of them have met the targets, although some have shown improvement.[6-8] Others have regressed in their ability to provide timely emergency care,'71 and the reason most often cited for this situation is the lack of operational vehicle numbers.[6-8] Many services supplement ambulances (which carry patients) with primary response vehicles (PRVs, which deliver providers to the patient) to help meet targets. There is a common perception in EMS that there is a more or less inverse linear relationship between vehicle numbers and response times, and that meeting the response time targets would be greatly aided by buying more vehicles.
We undertook a study to determine the effect of increased numbers of ambulances and PRVs on response time performance in P1 incidents using a discrete-event simulation model of operations in a large urban SA EMS system.
Methods
The simulation model was based on input data from the modelled system's operations and computer-aided dispatch system, and was validated against a set of response data from the same system. A number of different scenarios were then constructed with increasing ambulance and PRV numbers, using the validated simulation model and its outputs to determine the effect of increased vehicle numbers on response time performance.
The modelled EMS system: Cape Town
Cape Town's EMS system, serving a population of approximately 3.74 million people,[9] is geographically divided into six sectors, each of which is associated with the drainage area of a provincial hospital. Public requests for medical emergency assistance are received at an emergency control centre where caller and incident details are recorded, the incident is prioritised and an appropriately staffed emergency vehicle from the sector in which the incident occurred is dispatched. Incidents are classified as P1 or priority 2 (P2), which are high and lower acuity, respectively.
Emergency vehicles consist mainly of ambulances, which may be either advanced life support (ALS) or non-ALS (ALS means that the ambulance is staffed by at least one ALS paramedic). Non-transport PRVs staffed by an ALS paramedic or a doctor are also used, but there are few of these in the system and they are only dispatched to major incidents (a small subset of P1 incidents).
The emergency response interval
The total time interval required for servicing an emergency incident is referred to as the emergency response interval,[10] which is in turn broken up into a number of other intervals, the first of which is the response interval. The response interval begins from the time when an incident is created at the emergency call centre following receipt of a call for emergency assistance and ends when the first emergency vehicle arrives at the location of the corresponding incident. The response interval is therefore made up of two parts, one devoted to call taking and dispatch activities in the emergency control centre and one to travel of an emergency vehicle from an originating point to the incident location.[10]
The response interval is followed by the scene interval, transport interval and post-incident interval. The term 'response time' typically refers to the elapsed time of the response interval as defined above, and forms the major focus of this study.[10]
The simulation model
Simulation modelling followed the Banks stepwise approach:[11] conceptual modelling, EMS system input data collection and modelling, model translation and verification, and validation. The conceptual model, a high-level software independent description of the system, was derived from observation of the real system and system documents, and information obtained from system experts. This was followed by extraction of computer-aided dispatch data spanning the period 1 January - 31 December 2012. Only data from four of the six sectors representing an urban environment were used, comprising 312 387 incidents. These four sectors corresponded with the drainage areas of Groote Schuur, GF Jooste, Tygerberg and Victoria hospitals.
Computer-aided dispatch data were used to establish statistical probability distributions for incident occurrence rates, dispatching times and scene times for P1 and P2 incidents. Incident geographical co-ordinates were used, in conjunction with a Geographic Information System application, to determine geospatial distribution of incidents in the four sectors. System documents and information from system experts were used to record the geographical locations of EMS bases and emergency vehicle holding points as well the numbers of ambulances and PRVs available under typical operating conditions.
Vehicle dispatch policies and procedures comprised an important part of the conceptual model. Triage category (P1 or P2), type of vehicle (ambulance or PRV), type of ambulance (ALS or non-ALS) and distance from the incident to the closest available ambulance were all reflected in the dispatch logic of the conceptual model as they were implemented in the real system. Although only response times for P1 cases were included in this study, the conceptual model took into account incident occurrence rates, spatial distribution and dispatching of vehicles to P1 and P2 incidents.
The conceptual model and EMS system input data were translated into a computer software representation using an object-orientated simulation software application (Simio Design Edition, version 6.97; Simio LLC, USA). Verification of the simulation model was conducted throughout the translation process by assessing data outputs of the model and by using model animation and debugging tools in order to ensure that emergency vehicle and other behaviour was in keeping with processes described in the conceptual model. Once completed, the model was validated by comparing its outputs during 15 replications of 7 days of simulated operations with a random sample of real system data. Comparative analysis of these data showed that, with regard to response, scene and transport intervals, percentage differences between model and real data ranged between 0.59% and 1.31%. These differences were considered to be small enough to be of no practical significance, so for the purpose of this study the model was considered a valid representation of the system.[12]
Addition of vehicles
The effect of adding vehicles to the simulated system was assessed by creating seven different scenarios in two categories. The first category included both ambulances and PRVs, as in the real system. Scenario 1 was configured with the baseline number of ambulances and PRVs existing in the validated model. Each subsequent scenario (2 - 7) involved adding the baseline number of vehicles to the cumulative number of vehicles each time.
The second category was identical, except that it included only ambulances in the model. This was done in order to assess any difference between response time performance with ambulances and PRVs v. only ambulances, as the number of PRVs was small (at baseline, only one per sector).
Process logic was incorporated into the model to automatically place the additional emergency vehicles with each scenario at EMS bases and holding points with the greatest demand so as to make the best use of these resources. Each scenario was run for 15 repetitions of the simulation equivalent of 7 days.
Data recording and analysis
Response time was measured in a way identical to that described for the response interval above. An important component of the response time, called the waiting time, was also recorded for each response. Waiting time was defined and measured as the time interval between an incident in the emergency control centre dispatch process being ready for allocation to a vehicle and the vehicle accepting the incident and beginning its response. Waiting time varies with vehicle availability - it may be short or non-existent under conditions of high vehicle availability, or moderate to long when vehicle availability is low. Data on emergency vehicle availability in the modelled system as a whole were also recorded.
All data were written to and stored in a spreadsheet application with each replication of the simulation. Data analysis was descriptive in nature, with all response times reported as the mean over 15 replications for each scenario and associated 95% confidence intervals (CIs). STATA (version 13.0, Stata Corporation, USA) was used for data analysis.
Results
Scenarios and vehicle numbers
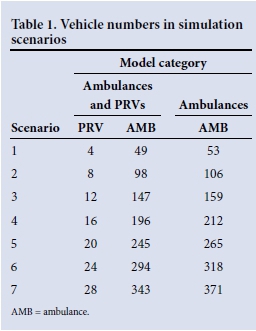
Vehicle numbers for the seven scenarios are shown in Table 1. PRV and ambulance numbers were increased sequentially by the baseline (scenario 1) number in each successive scenario. For the model with only ambulances, one ALS ambulance per sector was added to the baseline number in order to compensate for the removal of the same number of PRVs.
Mean response times
Mean response times and 95% CIs for each scenario and both models are shown in Fig. 1.

The simulation model with only ambulances produced the better baseline response time performance (shorter mean response time in scenario 1). In both models, the first iteration of increased vehicle numbers (scenario 2) produced a 35.9 - 26.9% decrease in mean response time; this was followed by incrementally smaller decreases with an eventual plateauing.
Percentage of responses meeting targets
Fig. 2 shows the mean percentage of responses meeting the response time target in each scenario.
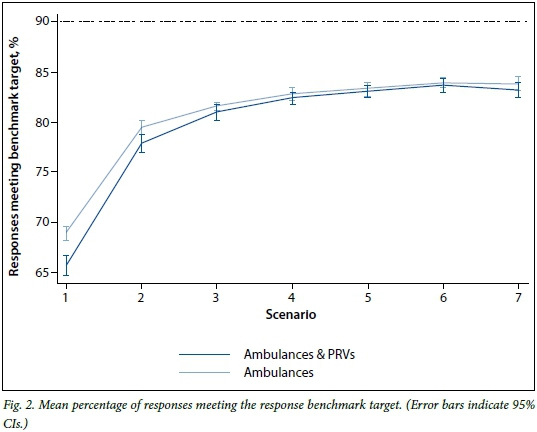
The model with ambulances only had a better baseline performance against the target; a similar pattern was observed to Fig. 1, with an initial 14.2 - 17.0% increase in performance in scenario 2, followed by a progressive flattening out up to and including scenario 7. The target of 90% of responses within 15 minutes was not achieved despite a 150% increase in vehicles.
Waiting time and vehicle availability
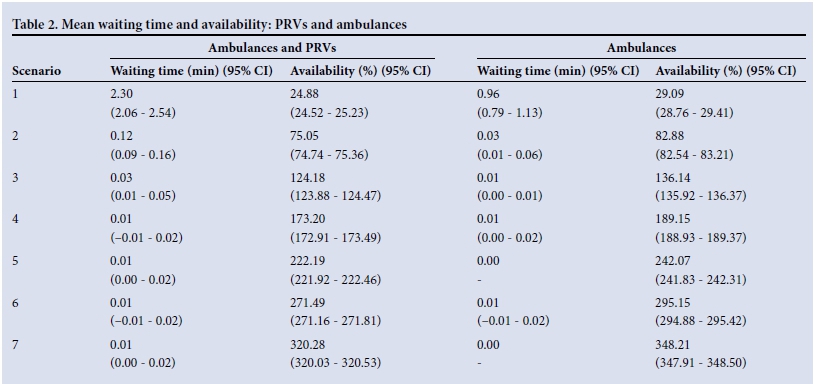
The mean waiting time for each scenario was measured, along with mean vehicle availability, and is shown in Table 2 for each of the models.
At baseline there was a longer mean waiting time with ambulances and PRVs; however, in both models there was a rapid decrease with the first incremental increase in vehicle numbers, followed by a series of smaller decreases with each successive addition of vehicles. Vehicle availability increased in a linear fashion and did not display the same pattern of change over the scenarios. This linear increase in vehicle availability across scenarios with a limited initial improvement in response time performance indicates a high degree of vehicle redundancy from scenario 1 to scenario 7.
Discussion
Providing timely access to EMS in SA remains elusive in both urban and rural environments. Research into the functioning of real EMS systems, particularly experimental research focused on response times, is often not feasible for practical and ethical reasons. Consequently, most of what is known about the factors affecting response time performance in EMS systems has been obtained through simulation modelling.[13] Our simulation, based on part of a large urban SA EMS system, was designed to investigate the theory that response time performance in high-acuity incidents can be improved merely by increasing a single resource - emergency vehicles - while leaving the rest of the system in its original state.
Our data suggest that increasing vehicle numbers in an urban EMS system does improve response time performance. However, two important facts emerge: firstly, this effect is not linearly related to the number of additional vehicles; and secondly, the number of vehicles required to bring about this transient improvement is unrealistically large. With the cost of an equipped ambulance (including staffing) estimated at ZAR3 670 998 (Dr Shaheem de Vries, vehicle cost estimates, personal correspondence 12 May 2015), the total cost of the initial 14% response time improvement in the ambulance-only model (Fig. 1) would be ZAR194 562 894 (ZAR13 897 349 per % improvement).
The limited effectiveness of larger vehicle numbers can be explained by consideration of changeable and unchangeable determinants of response time performance. In our model, the addition of emergency vehicles was effective in minimising the waiting time and thus decreasing response times, which consist in part of the delay represented by waiting times. This effect is easy to understand -greater availability of vehicles means that delays in allocating a vehicle to a waiting incident will be minimised and the waiting time too will therefore be decreased. The initial changes shown between baseline (scenario 1) and scenario 2 illustrate this (Figs 1 and 2, Table 2). In relation to vehicle numbers, the waiting time can therefore be considered a changeable determinant of response time performance.
Although there are a number of other determinants of response time performance, one of the most important is the proximity of an available vehicle to an incident at the time when it is deployed. Simulation research conducted since the late 1960s has made some advances in understanding ways of optimising emergency vehicle deployment and redeployment problems and, to some degree at least, in coupling EMS system demand patterns with available resources in order to minimise response time.[14-21] These studies, using a variety of approaches including mathematical modelling, use of geographic information systems, demand pattern analysis and dynamic allocation and reallocation of vehicles, have identified that the only way to significantly reduce response times is somehow to address the proximity problem. If this is not done, the addition of more vehicles to an EMS system can only have an impact on waiting time. Beyond this, the proximity of vehicles to incidents remains an unchangeable determinant of response times unless the way vehicles are deployed and redeployed is improved.
Response time benchmark targets in SA are modest compared with those in parts of Europe and the USA, which range between 4 and 8 minutes for 90% of high-acuity cases.[22-24] The typical model of EMS vehicle location and allocation in SA may explain why these targets remain difficult to meet. In most of our EMS systems, vehicles are statically located at bases that are not strategically placed in terms of proximity to areas of demand, and certainly do not take into consideration changes in demand that occur over time.
Under these conditions, the addition of vehicles to a system without any other changes will result in an initial response time improvement representing elimination of waiting times. This will only be possible through high availability and significant redundancy of vehicles, which can only be achieved at great cost.
Many EMS systems also use the two-tiered PRV and ambulance model, which our data show to be inferior. The reason for this is again probably related to the proximity problem. In the modelled system, there were far fewer PRVs than ambulances (Table 1), which meant that each PRV needed to cover a larger distance in responding to the P1 incidents that it was dispatched to. In addition, longer responses were associated with decreased availability and increased waiting times. The addition of more PRVs with each successive scenario contributed to the improvement of response times in the two-tiered model relative to that of the single-tier model, mainly by decreasing waiting times and increasing availability (Fig. 1, Table 2).
For decision-makers in SA EMS systems to improve response time performance in high-acuity cases, a different approach is required -not just more vehicles. This will require a fundamental realisation that the key to better response times is optimal vehicle utilisation and efficiency rather than numbers. The only way to address efficiency will be to rethink the old models of response system design (many of which have not changed in decades), and to develop a deep understanding of the dynamics of our urban EMS systems as a means to engage in a more scientific form of EMS system design and implementation.
Study limitations
The results produced by our simulation model are specific to the modelled EMS system and do not necessarily reflect the performance and operations of other EMS systems. In particular, EMS systems that are not currently as well resourced with vehicles as the modelled system may initially see more of an impact from additional vehicle numbers. However, we believe that a very similar response pattern will be seen in EMS systems with similar methods of emergency dispatch and vehicle deployment.
Conclusion
This study showed that the addition of emergency vehicles to a busy urban EMS improves response times in high-acuity cases but alone is not capable of the magnitude of response time improvement needed to meet the national response time targets. Changes to the way emergency vehicles are deployed, and how proximity between available vehicles and high-acuity incidents is optimised, are required in order to bring about cost-effective and significant improvements in response time performance.
Acknowledgements. The authors thank Simio LLC for a grant allowing the use of their software in this study. This study was supported in part by the National Research Foundation of South Africa (Unique Grant 86454).
References
1. The Constitution of the Republic of South Africa. 1996. http://www.gov.za/documents/constitution/chapter-2-bill-rights (accessed 5 May 2015). [ Links ]
2. Gulliford M, Figueroa-Munoz J, Morgan M, et al What does 'access to health care' mean? J Health Serv Res Policy 2002;7(3):186-189. [http://dx.doi.org/10.1258/135581902760082517] [ Links ]
3. Committee on Quality of Health Care in America. Crossing the Quality Chasm: A New Health System for the 21st Century. Washington, DC: National Academies Press, 2001. [ Links ]
4. Moore L. Performance measurement in EMS. In: Lerner E, Pirallo R, Swor R, White L, eds. Evaluating and Improving Quality in EMS. Dubuque, Iowa: Kendall Hunt Professional, 2009:80-98. [ Links ]
5. Dunford J, Domeier RM, Blackwell T, et al. Performance measurements in emergency medical services. Prehosp Emerg Care 2002;6(1):92-98. [http://dx.doi.org/10.1080/10903120290938896] [ Links ]
6. Western Cape Department of Health. Western Cape Department of Health Annual Report 2012-2013. pp. 100-109. 2013. http://www.westerncape.gov.za/dept/health/documents/annual_reports/2012 (accessed 5 May 2015). [ Links ]
7. Gauteng Department of Health and Social Development. Gauteng Department of Health and Social Development Annual Report 2012-2013. pp. 74-76. 2013. http://www.health.gpg.gov.za/Document/Pages/AnnualReports.aspx (accessed 10 May 2015). [ Links ]
8. KwaZulu-Natal Department of Health. KwaZulu-Natal Department of Health Annual Report 20132014. Part B: Programme 3: Emergency Medical Services. pp. 121-131. 2014. http://www.kznhealth.gov.za/AnnualReport/2013_2014.pdf (accessed 10 May 2015). [ Links ]
9. Statistics South Africa. Census 2011. Pretoria: SSA, 2012. http://beta2.statssa.gov.za/publications/P03014/P030142011.pdf (accessed 7 May 2015). [ Links ]
10. Spaite DW, Valenzuela TD, Meislin HW, Criss EA, Hinsberg P. Prospective validation of a new model for evaluating emergency medical services systems by in-field observation of specific time intervals in prehospital care. Ann Emerg Med 1993;22(4):638-645. [http://dx.doi.org/10.1016/S0196-0644(05)81840-2] [ Links ]
11. Banks J, Carson JS, Nelson BND. Discrete-event System Simulation. Upper Saddle River, NJ: Prentice-Hall, 2010:4-22. [ Links ]
12. Law A, Kelton DW. Building valid, credible, and appropriately detailed simulation models. In: Simulation Modeling and Analysis. 3rd ed. Singapore: McGraw-Hill, 2000:264-291. [ Links ]
13. Aboueljinane L, Sahin E, Jemai Z. A review on simulation models applied to emergency medical service operations. Computers & Industrial Engineering 2013;66(4):734-750. [http://dx.doi.org/10.1016/j.cie.2013.09.017] [ Links ]
14. Savas E. Simulation and cost-effectiveness analysis of New York's emergency ambulance service. Manage Sci 1968;18(12):B608-B627. [http://dx.doi.org/10.1287/mnsc.15.12.B608] [ Links ]
15. Fitzsimmons JA. A methodology for emergency ambulance deployment. Management Science 1973;19(6):627-636. [http://dx.doi.org/10.1287/mnsc.19.6.627] [ Links ]
16. Berlin GN, Liebman JC. Mathematical analysis of emergency ambulance location. Socioecon Plann Scis 1974;8(6):323-328. [http://dx.doi.org/10.1016/0038-0121(74)90036-6] [ Links ]
17. Uyeno DH, Seeberg C. A practical methodology for ambulance location. Simulation 1984;43(2):79-87. [http://dx.doi.org/10.1177/003754978404300202] [ Links ]
18. Peleg K, Pliskin JS. A geographic information system simulation model of EMS: Reducing ambulance response time. Am J Emerg Med 2004;22(3):164-170. [http://dx.doi.org/10.1016/j.ajem.2004.02.003] [ Links ]
19. Ong ME, Ng FS, Overton J, et al. Geographic-time distribution of ambulance calls in Singapore: Utility of geographic information system in ambulance deployment (CARE 3). Ann Acad Med Singapore 2009;38(3):184-191. [ Links ]
20. Wu CH, Hwang KP. Using a discrete-event simulation to balance ambulance availability and demand in static deployment systems. Acad Emerg Med 2009;16(12):1359-1366. [http://dx.doi.org/10.1111/j.1553-2712.2009.00583.x] [ Links ]
21. Lam SS, Zhang J, Zhang ZC, et al. Dynamic ambulance reallocation for the reduction of ambulance response times using system status management. Am J Emerg Med 2015;33(2):159-166. [http://dx.doi.org/10.1016/j.ajem.2014.10.044] [ Links ]
22. National Fire Protection Association. NFPA 1710 Standard for the Organization and Deployment of Fire Suppression Operations, Emergency Medical Operations, and Special Operations to the Public by Career Fire Departments. 2001 ed. National Fire Protection Association, 2001:1710-1719. [ Links ]
23. Morse A. Transforming NHS Ambulance Services. Norwich: HMSO, 2011. http://www.nao.org.uk/report/transforming-nhs-ambulance-services/ (accessed 4 May 2015). [ Links ]
24. Overton J. Benchmarking EMS in Europe. 7th Congress of the European Resuscitation Council, 2004. http://www.eed-network.eu/assets/presentations/EED_Benchmarking.pdf (accessed 4 February 2014). [ Links ]
Accepted 26 August 2015
Corresponding author: C Stein (cstein@uj.ac.za)

